| Param | Original file | Final file |
|---|---|---|
| Filename | modeM0/AS1A11_097T17_9000005194_36360cztM0_level2.evt | modeM0/AS1A11_097T17_9000005194_36360cztM0_level2_quad_clean.evt |
| Size (bytes) | 463,783,680 | 93,179,520 |
| Size | 442.3 MB | 88.9 MB |
| Events in quadrant A | 2,713,175 | 632,225 |
| Events in quadrant B | 3,452,909 | 623,077 |
| Events in quadrant C | 2,923,102 | 619,737 |
| Events in quadrant D | 4,595,709 | 574,199 |
| Mode SS | |||
|---|---|---|---|
| Quadrant | BADHDUFLAG | Total packets | Discarded packets |
| A | 0 | 108 | 0 |
| B | 0 | 108 | 0 |
| C | 0 | 108 | 0 |
| D | 0 | 108 | 0 |
| Mode M0 | |||
|---|---|---|---|
| Quadrant | BADHDUFLAG | Total packets | Discarded packets |
| A | 0 | 11516 | 3 |
| B | 0 | 13806 | 2 |
| C | 0 | 11875 | 2 |
| D | 0 | 17159 | 2 |
| Mode M9 | |||
|---|---|---|---|
| Quadrant | BADHDUFLAG | Total packets | Discarded packets |
| A | 0 | 32 | 0 |
| B | 0 | 32 | 0 |
| C | 0 | 32 | 0 |
| D | 0 | 33 | 0 |
| Quadrant | Total seconds | Saturated seconds | Saturation percentage |
|---|---|---|---|
| A | 5320 | 13 | 0.244361% |
| B | 5320 | 178 | 3.345865% |
| C | 5320 | 72 | 1.353383% |
| D | 5320 | 412 | 7.744361% |
Noise dominated data is calculated using 1-second bins in cleaned event files. If a bin has >2000 counts, and if more than 50% of those come from <1% of pixels, then it is considered to be noise-dominated and hence unusable.
| Quadrant | # 1 sec bins | Bins with >0 counts | Bins with >2000 counts | High rate bins dominated by noise | Noise dominated (total time) | Noise dominated (detector-on time) | Marked lightcurve |
|---|---|---|---|---|---|---|---|
| A | 7202 | 5321 | 0 | 0 | 0.00% | 0.00% | 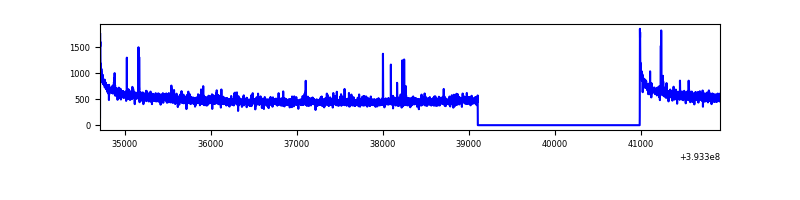 |
| B | 7202 | 5321 | 145 | 145 | 2.01% | 2.73% | 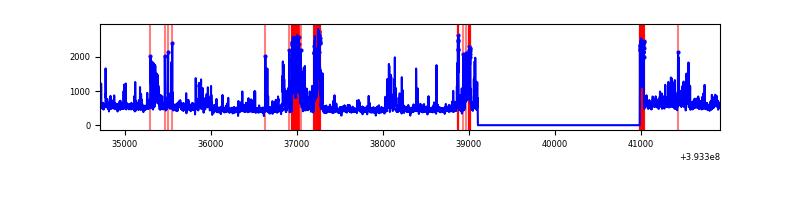 |
| C | 7202 | 5321 | 52 | 52 | 0.72% | 0.98% | 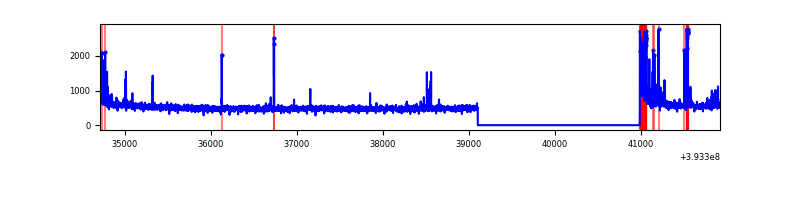 |
| D | 7202 | 5321 | 415 | 415 | 5.76% | 7.80% | 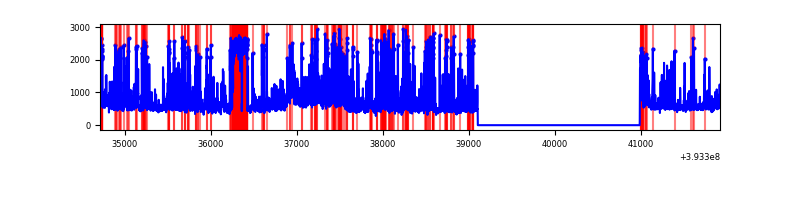 |
Top three noisy pixels from each quadrant. If the there are fewer than three noisy pixels in the level2.evt file, extra rows are filled as -1
| Pixel properties | Quadrant properties | ||||||
|---|---|---|---|---|---|---|---|
| Quadrant | DetID | PixID | Counts | Sigma | Mean | Median | Sigma |
| A | 10 | 83 | 181956 | 1405.59 | 645 | 634 | 129.0 |
| A | 9 | 143 | 16971 | 126.64 | 645 | 634 | 129.0 |
| A | 12 | 189 | 14375 | 106.52 | 645 | 634 | 129.0 |
| B | 5 | 172 | 799740 | 6703.67 | 625 | 608 | 119.2 |
| B | 0 | 189 | 90184 | 751.43 | 625 | 608 | 119.2 |
| B | 0 | 213 | 34438 | 283.79 | 625 | 608 | 119.2 |
| C | 15 | 214 | 225863 | 1565.01 | 622 | 628 | 143.9 |
| C | 0 | 10 | 158473 | 1096.76 | 622 | 628 | 143.9 |
| C | 0 | 207 | 112591 | 777.95 | 622 | 628 | 143.9 |
| D | 12 | 6 | 838056 | 5683.69 | 612 | 595 | 147.3 |
| D | 2 | 249 | 598906 | 4060.63 | 612 | 595 | 147.3 |
| D | 12 | 235 | 362434 | 2455.73 | 612 | 595 | 147.3 |
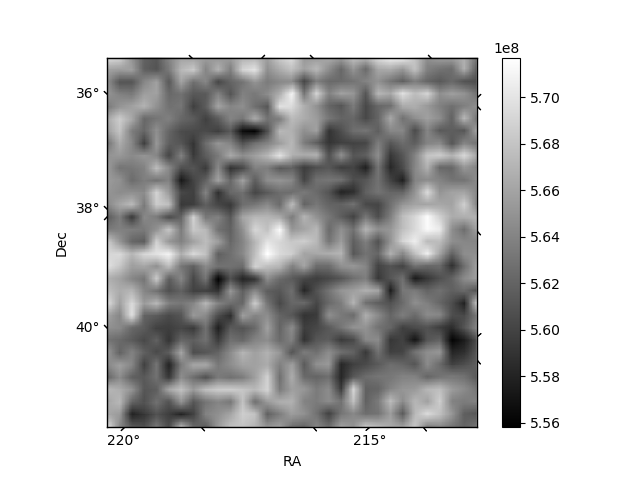
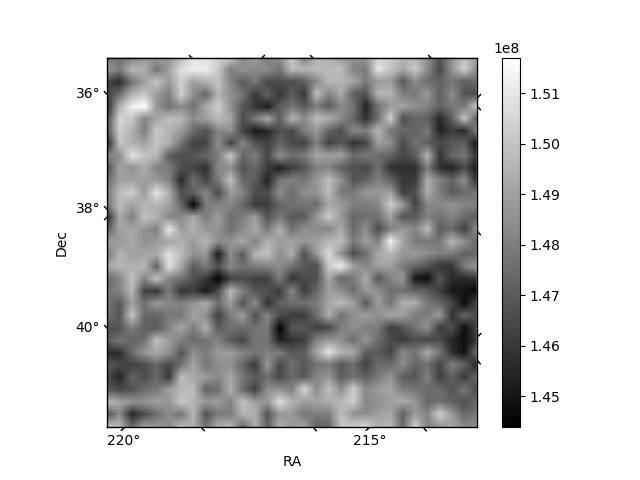
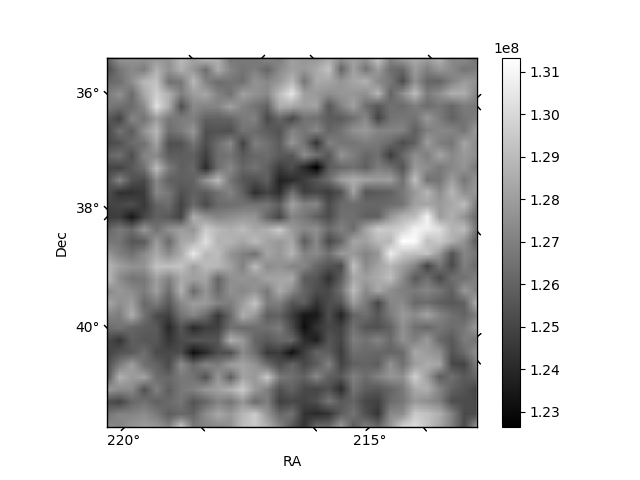
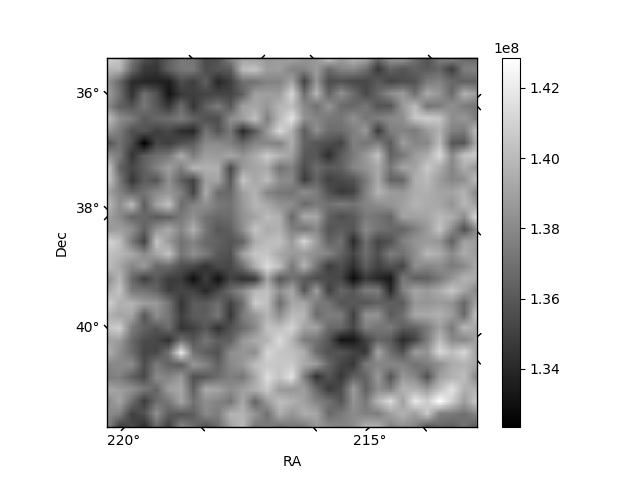
Histogram calculated using DETX and DETY for each event in the final _common_clean file
| Quadrant A | 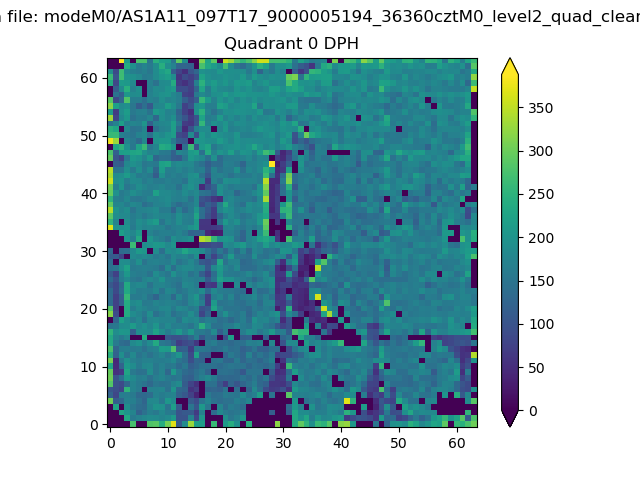 |
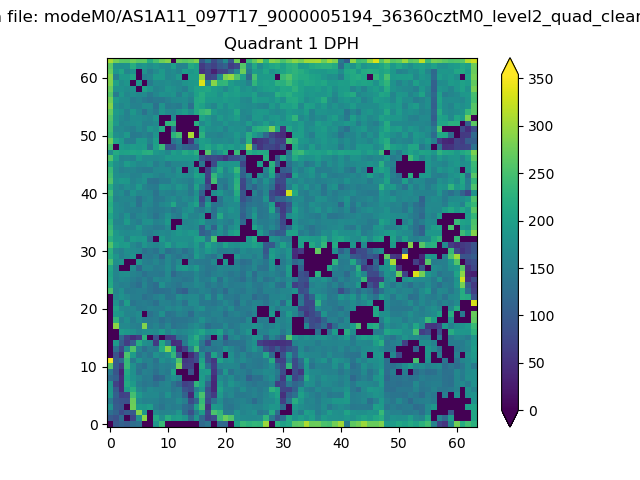 |
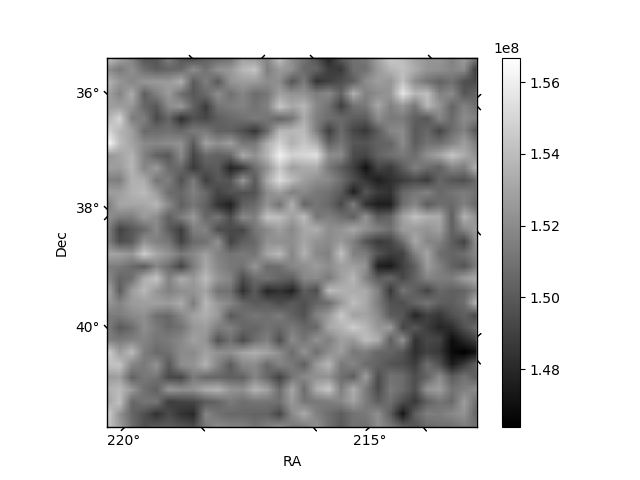
Quadrant B |
|---|---|---|---|
| Quadrant D | 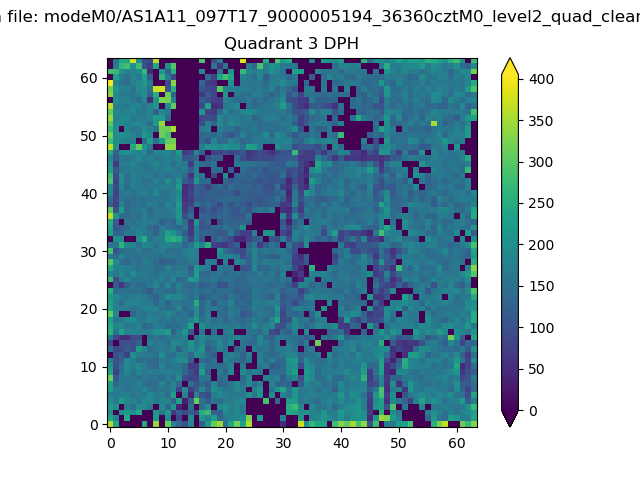 |
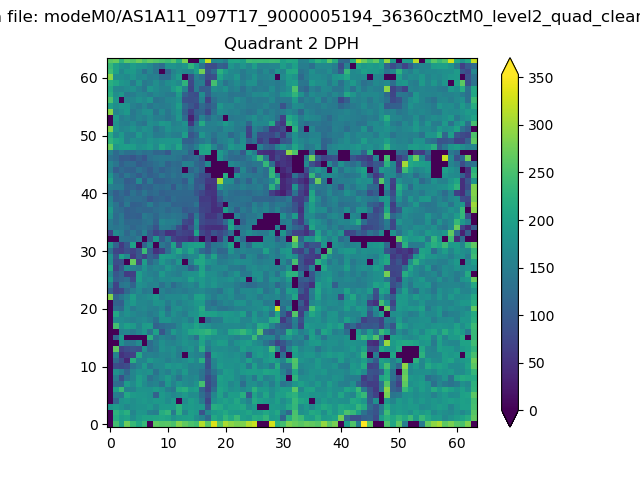 |
Quadrant C |
| Plot type | Count rate plots | Images |
|---|---|---|
| Comparison with Poisson distribution Blue bars denote a histogram of data divided into 1 sec bins. Red curve is a Poisson curve with rate = median count rate of data. |
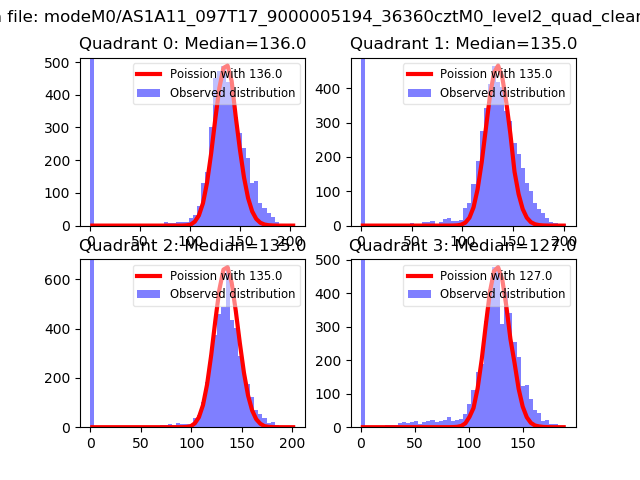 |
 |
| Quadrant-wise count rates Data is divided into 100 sec bins |
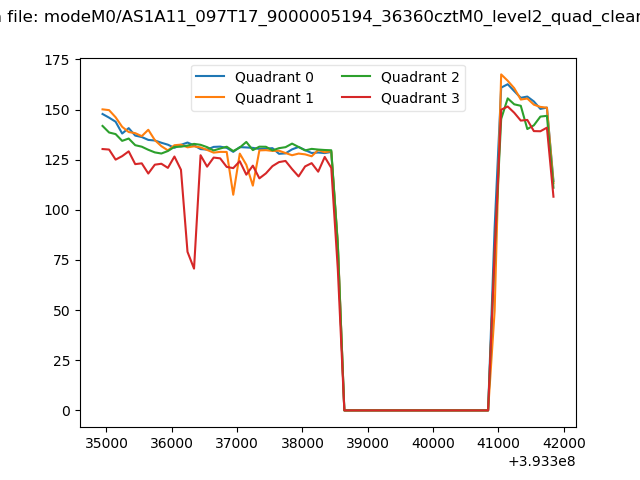 |
|
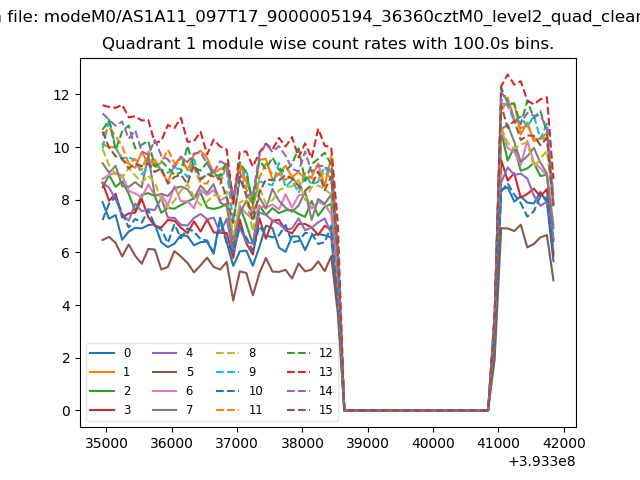
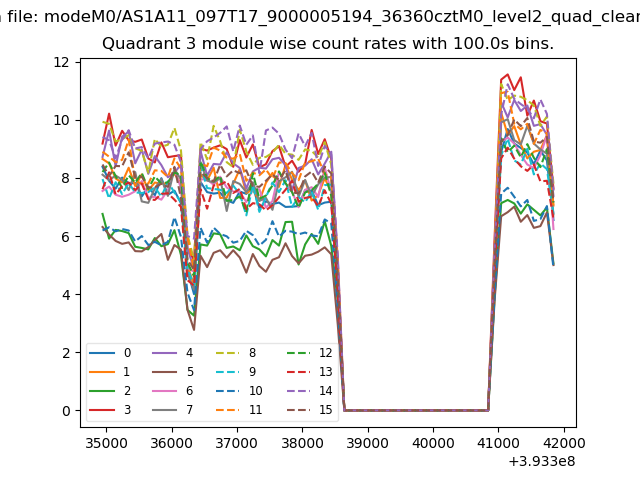
| Module-wise count rates for Quadrant A Data is divided into 100 sec bins |
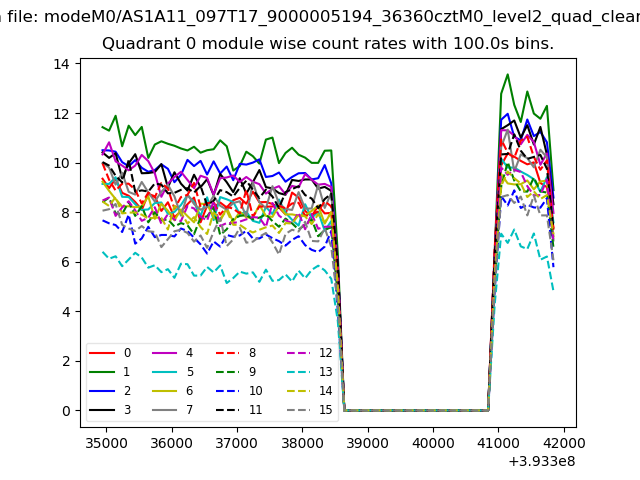 |
 |
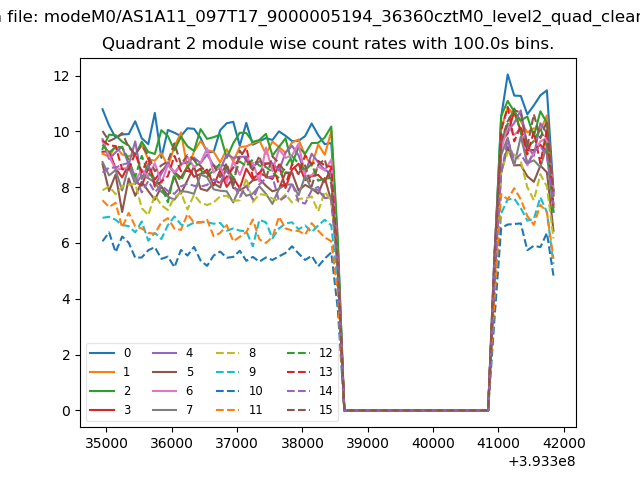
| Module-wise count rates for Quadrant B Data is divided into 100 sec bins |
 |
 |
| Module-wise count rates for Quadrant C Data is divided into 100 sec bins |
 |
 |
| Module-wise count rates for Quadrant D Data is divided into 100 sec bins |
 |
 |
| Parameter | Plot |
|---|---|
| CZT HV Monitor | 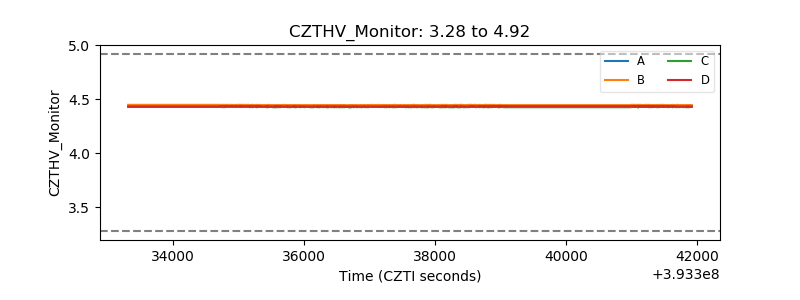 |
| D_VDD | 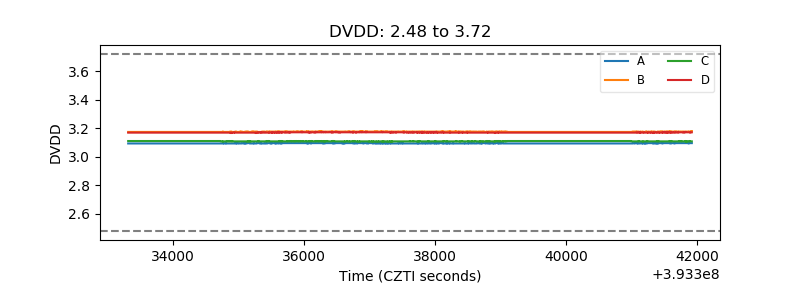 |
| Temperature 1 | 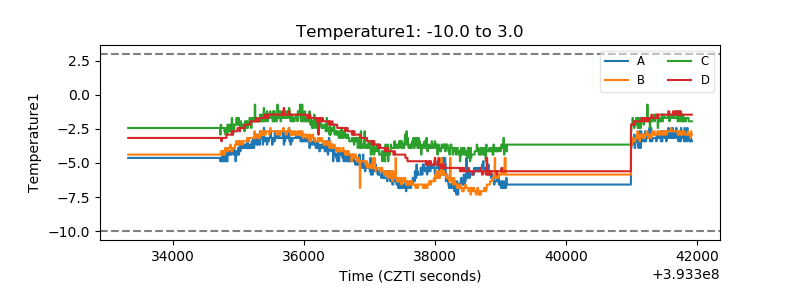 |
| Veto HV Monitor | 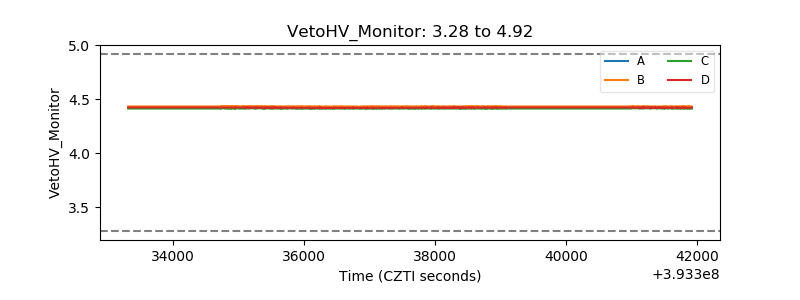 |
| Veto LLD | 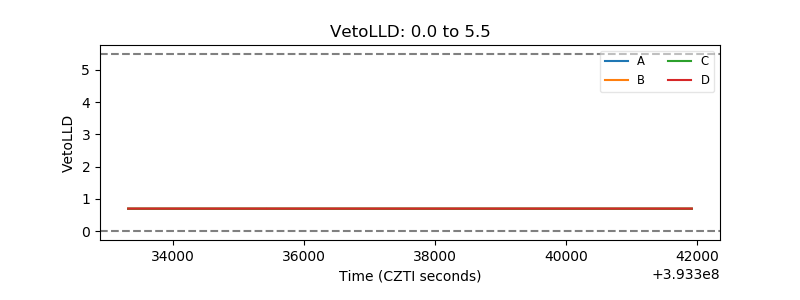 |
| Alpha Counter | 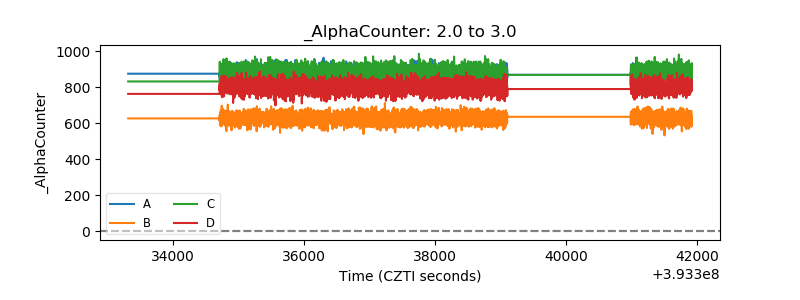 |
| _CPM_Rate |  |
| CZT Counter | 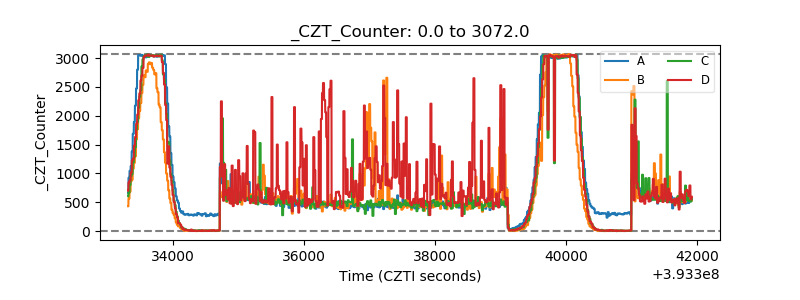 |
| +2.5 Volts monitor | 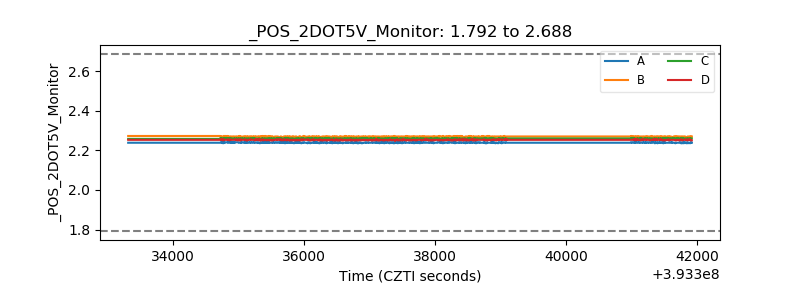 |
| +5 Volts monitor | 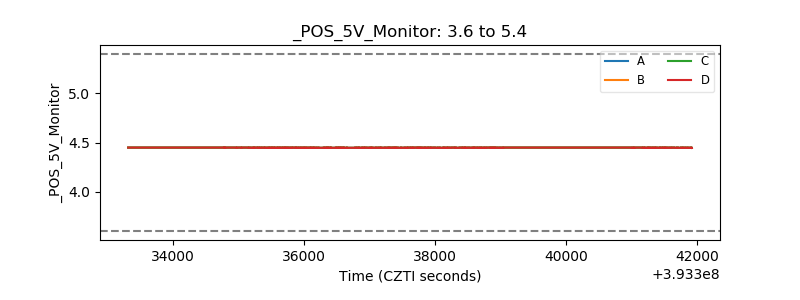 |
| _ROLL_ROT | 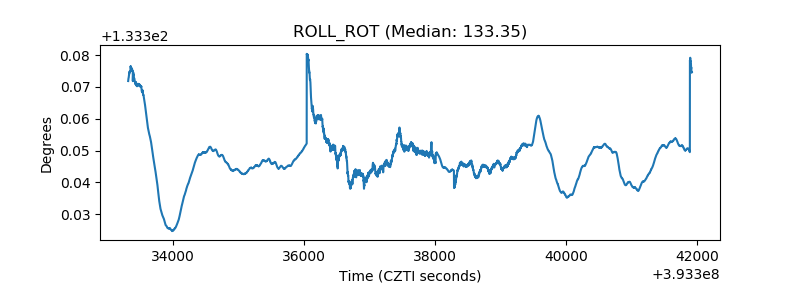 |
| _Roll_DEC | 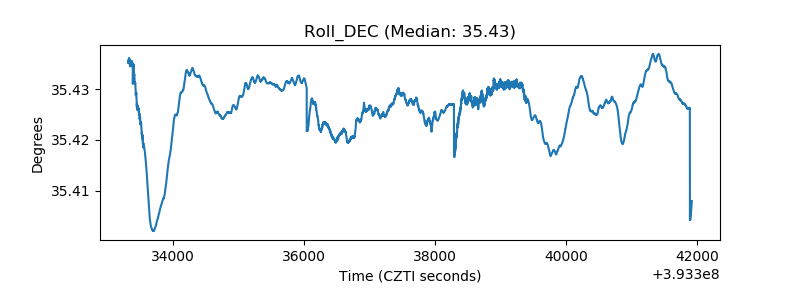 |
| _Roll_RA | 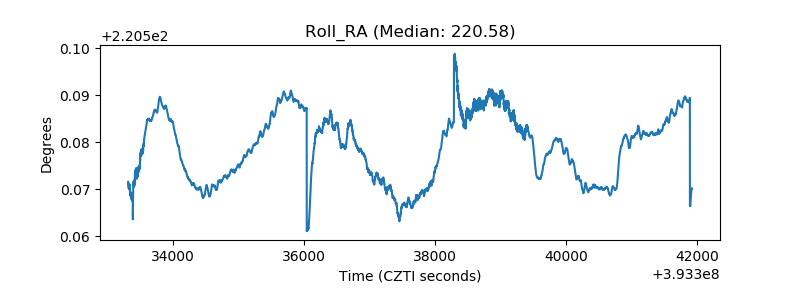 |
| Veto Counter | 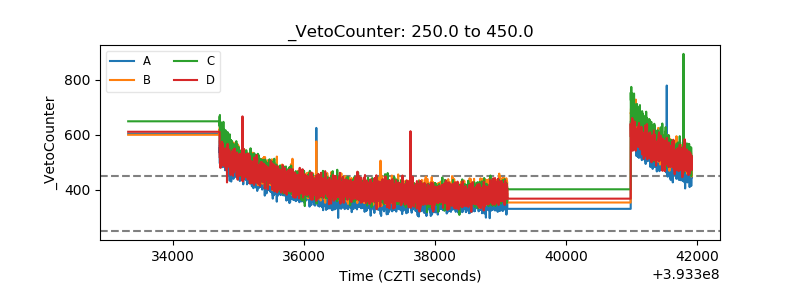 |