| Param | Original file | Final file |
|---|---|---|
| Filename | modeM0/AS1A11_097T17_9000005194_36359cztM0_level2.evt | modeM0/AS1A11_097T17_9000005194_36359cztM0_level2_quad_clean.evt |
| Size (bytes) | 459,086,400 | 86,748,480 |
| Size | 437.8 MB | 82.7 MB |
| Events in quadrant A | 2,757,522 | 571,898 |
| Events in quadrant B | 3,162,128 | 572,855 |
| Events in quadrant C | 3,033,182 | 567,557 |
| Events in quadrant D | 4,571,003 | 523,524 |
| Mode SS | |||
|---|---|---|---|
| Quadrant | BADHDUFLAG | Total packets | Discarded packets |
| A | 0 | 116 | 0 |
| B | 0 | 116 | 0 |
| C | 0 | 116 | 0 |
| D | 0 | 116 | 0 |
| Mode M0 | |||
|---|---|---|---|
| Quadrant | BADHDUFLAG | Total packets | Discarded packets |
| A | 0 | 11846 | 3 |
| B | 0 | 13004 | 2 |
| C | 0 | 12330 | 2 |
| D | 0 | 17283 | 2 |
| Mode M9 | |||
|---|---|---|---|
| Quadrant | BADHDUFLAG | Total packets | Discarded packets |
| A | 0 | 33 | 0 |
| B | 0 | 33 | 0 |
| C | 0 | 33 | 0 |
| D | 0 | 33 | 0 |
| Quadrant | Total seconds | Saturated seconds | Saturation percentage |
|---|---|---|---|
| A | 5592 | 14 | 0.250358% |
| B | 5592 | 58 | 1.037196% |
| C | 5592 | 43 | 0.768956% |
| D | 5592 | 363 | 6.491416% |
Noise dominated data is calculated using 1-second bins in cleaned event files. If a bin has >2000 counts, and if more than 50% of those come from <1% of pixels, then it is considered to be noise-dominated and hence unusable.
| Quadrant | # 1 sec bins | Bins with >0 counts | Bins with >2000 counts | High rate bins dominated by noise | Noise dominated (total time) | Noise dominated (detector-on time) | Marked lightcurve |
|---|---|---|---|---|---|---|---|
| A | 8938 | 5594 | 1 | 1 | 0.01% | 0.02% | 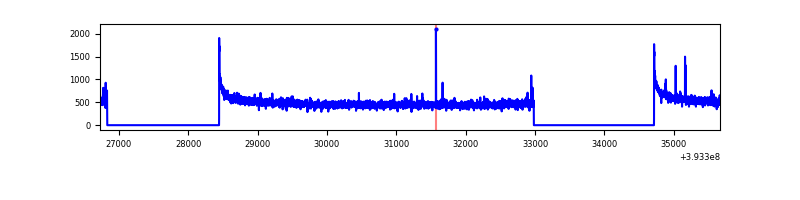 |
| B | 8938 | 5594 | 32 | 32 | 0.36% | 0.57% | 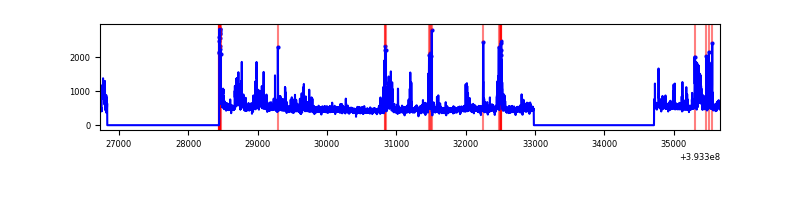 |
| C | 8938 | 5594 | 28 | 28 | 0.31% | 0.50% | 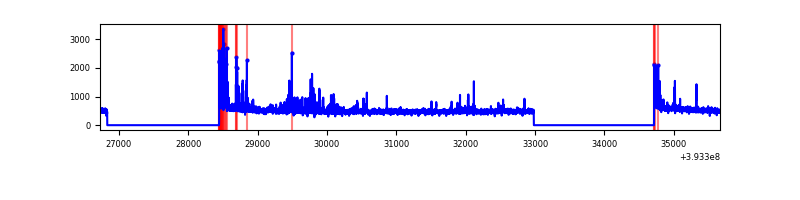 |
| D | 8938 | 5593 | 356 | 356 | 3.98% | 6.37% | 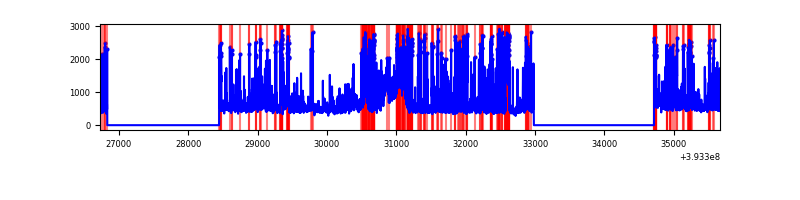 |
Top three noisy pixels from each quadrant. If the there are fewer than three noisy pixels in the level2.evt file, extra rows are filled as -1
| Pixel properties | Quadrant properties | ||||||
|---|---|---|---|---|---|---|---|
| Quadrant | DetID | PixID | Counts | Sigma | Mean | Median | Sigma |
| A | 10 | 83 | 187360 | 1415.88 | 656 | 643 | 131.9 |
| A | 12 | 189 | 23709 | 174.91 | 656 | 643 | 131.9 |
| A | 9 | 143 | 9910 | 70.27 | 656 | 643 | 131.9 |
| B | 5 | 172 | 360064 | 2886.19 | 645 | 627 | 124.5 |
| B | 5 | 236 | 129101 | 1031.61 | 645 | 627 | 124.5 |
| B | 0 | 183 | 32838 | 258.65 | 645 | 627 | 124.5 |
| C | 0 | 10 | 296208 | 1986.75 | 635 | 639 | 148.8 |
| C | 15 | 214 | 238102 | 1596.17 | 635 | 639 | 148.8 |
| C | 0 | 207 | 24555 | 160.76 | 635 | 639 | 148.8 |
| D | 12 | 6 | 946070 | 6255.9 | 621 | 602 | 151.1 |
| D | 13 | 171 | 458051 | 3026.81 | 621 | 602 | 151.1 |
| D | 2 | 249 | 363449 | 2400.86 | 621 | 602 | 151.1 |
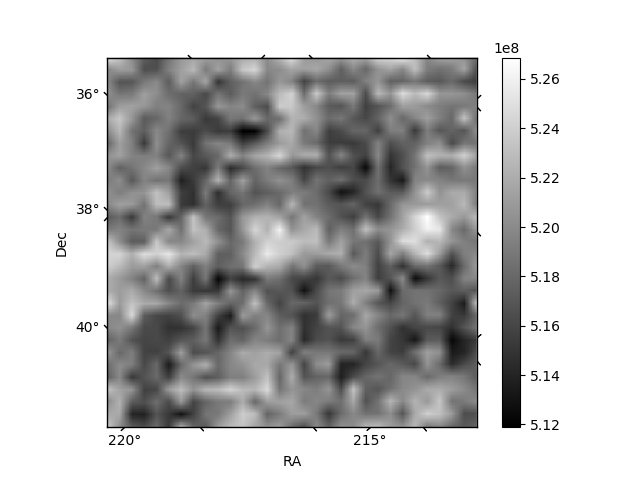
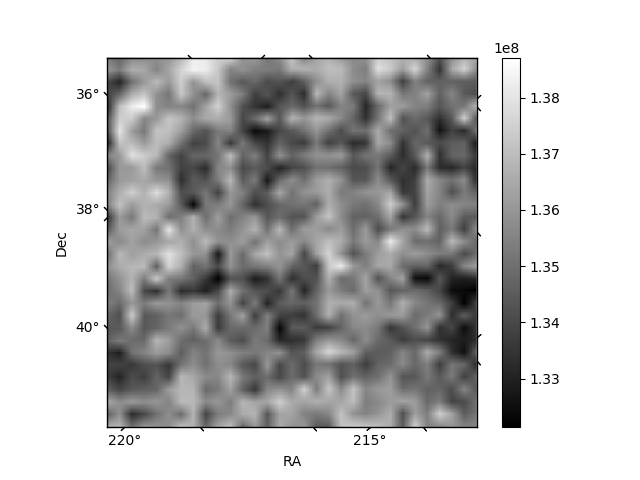
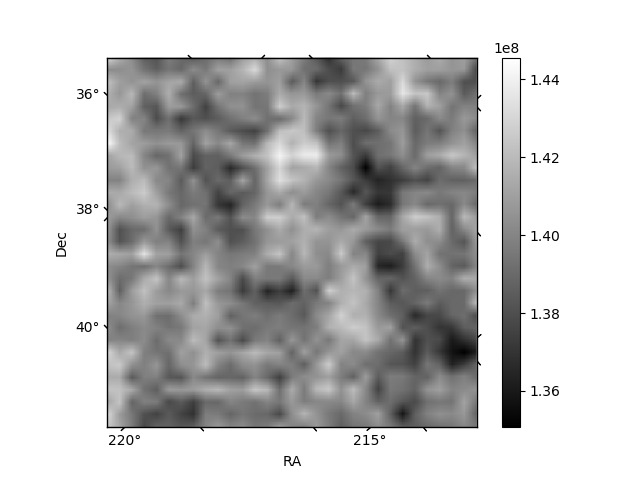
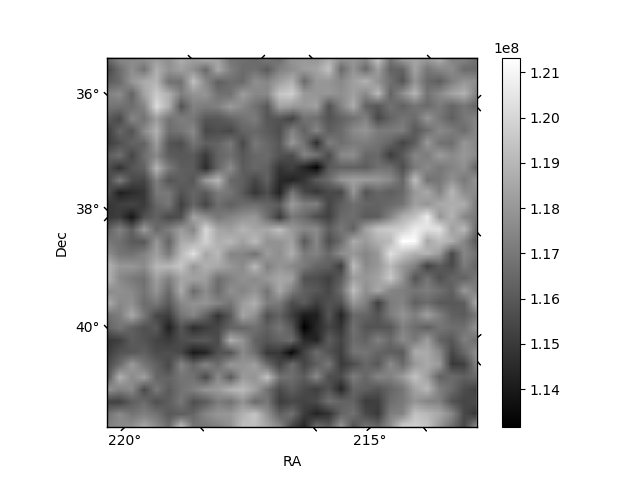
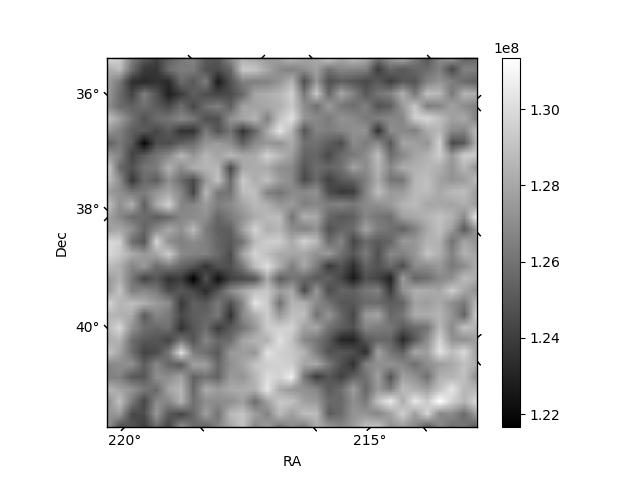
Histogram calculated using DETX and DETY for each event in the final _common_clean file
| Quadrant A | 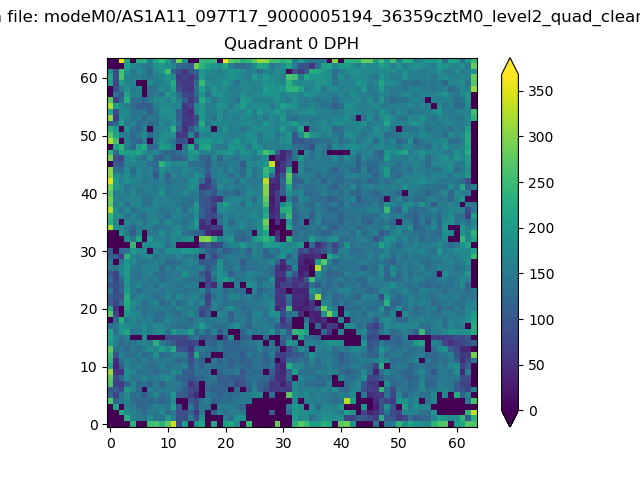 |
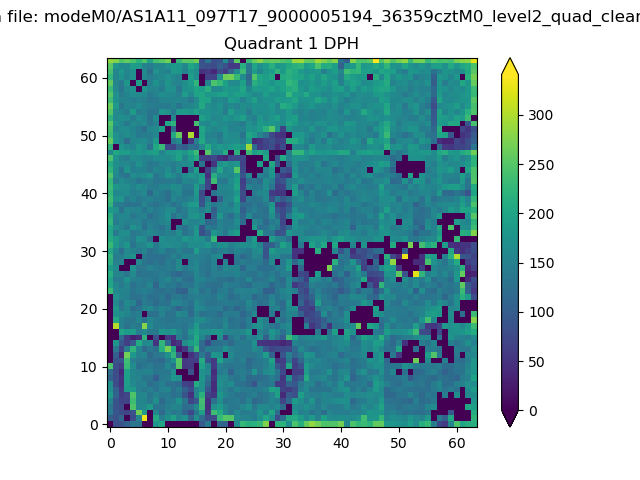 |
Quadrant B |
|---|---|---|---|
| Quadrant D | 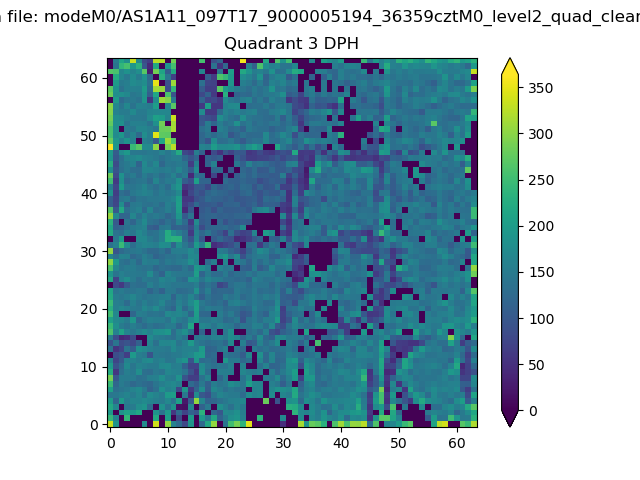 |
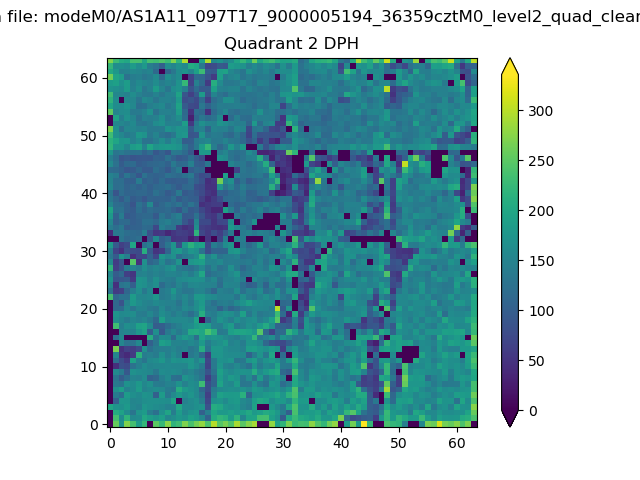 |
Quadrant C |
| Plot type | Count rate plots | Images |
|---|---|---|
| Comparison with Poisson distribution Blue bars denote a histogram of data divided into 1 sec bins. Red curve is a Poisson curve with rate = median count rate of data. |
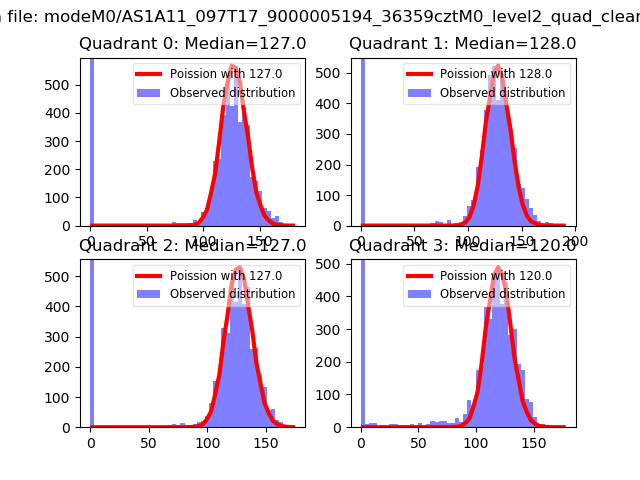 |
 |
| Quadrant-wise count rates Data is divided into 100 sec bins |
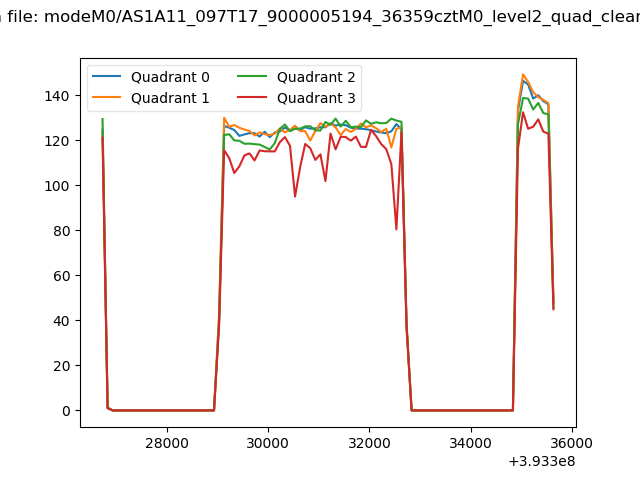 |
|
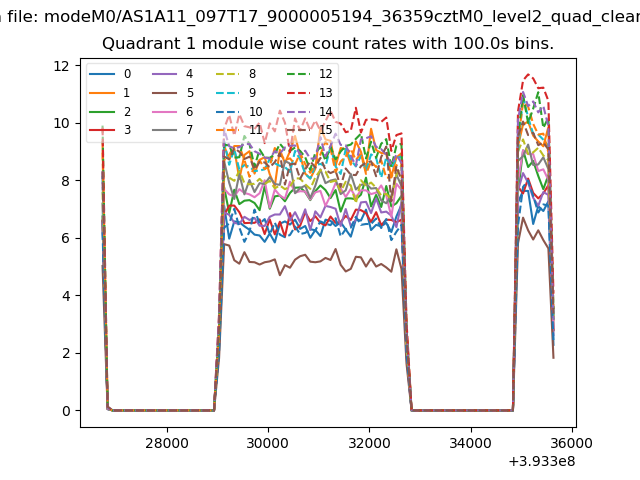
| Module-wise count rates for Quadrant A Data is divided into 100 sec bins |
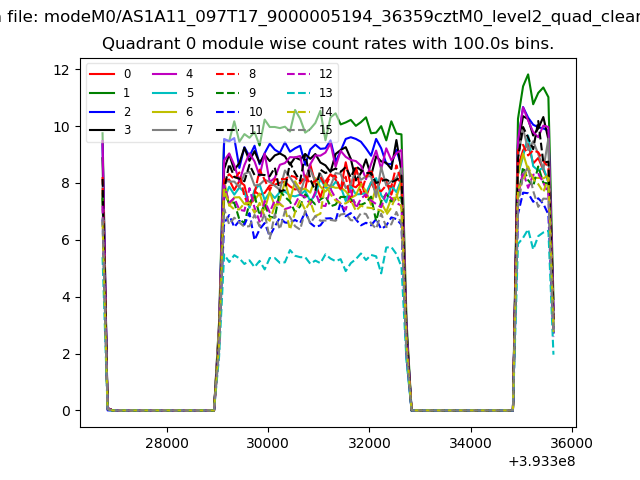 |
 |
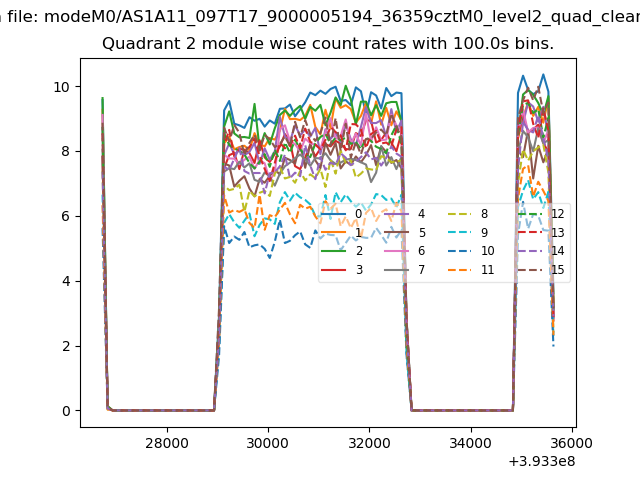
| Module-wise count rates for Quadrant B Data is divided into 100 sec bins |
 |
 |
| Module-wise count rates for Quadrant C Data is divided into 100 sec bins |
 |
 |
| Module-wise count rates for Quadrant D Data is divided into 100 sec bins |
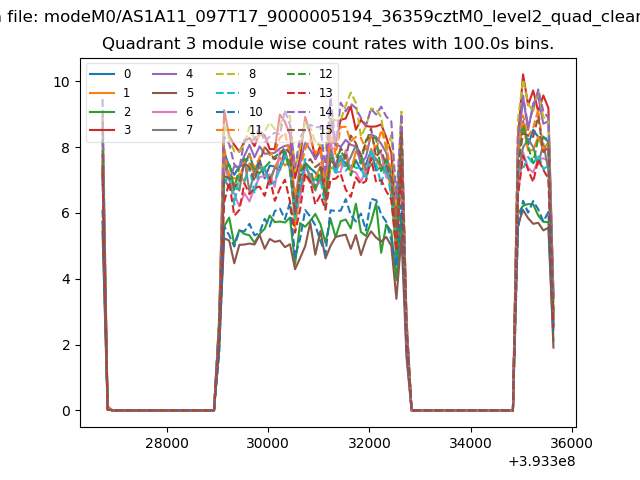 |
 |
| Parameter | Plot |
|---|---|
| CZT HV Monitor | 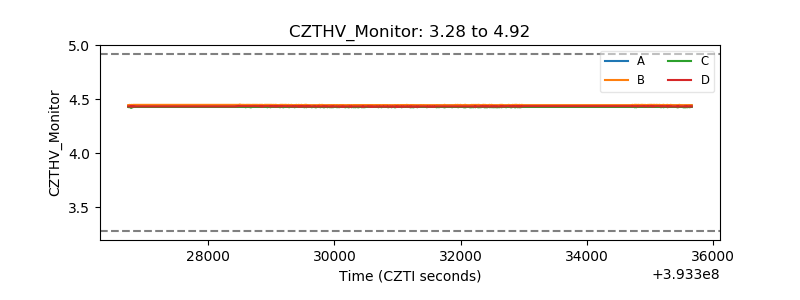 |
| D_VDD | 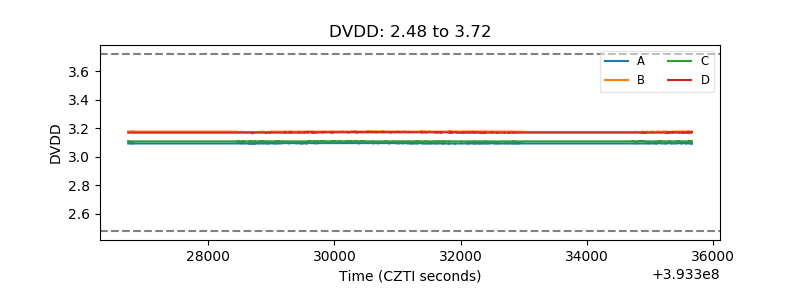 |
| Temperature 1 | 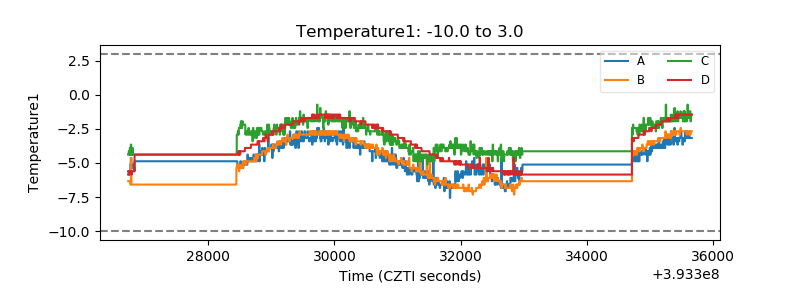 |
| Veto HV Monitor | 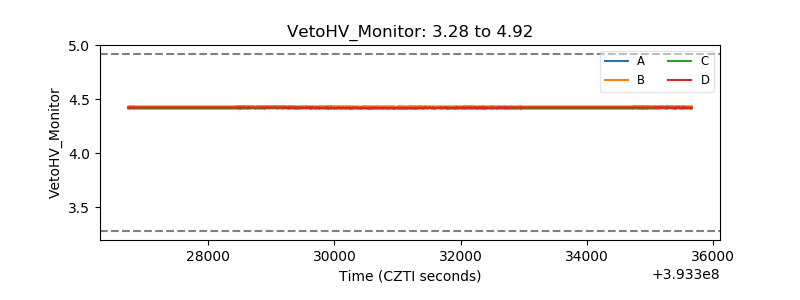 |
| Veto LLD | 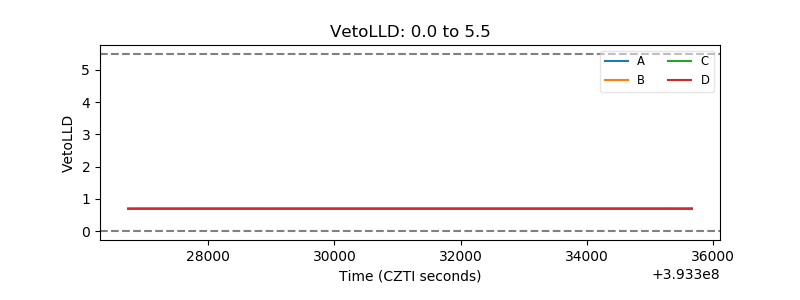 |
| Alpha Counter | 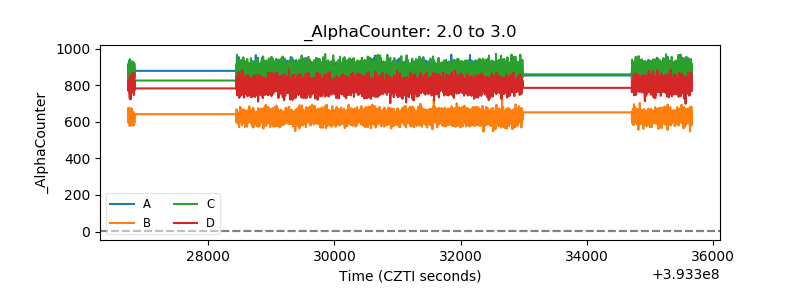 |
| _CPM_Rate | 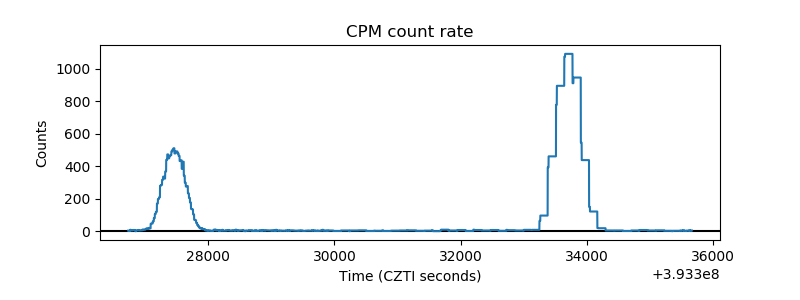 |
| CZT Counter | 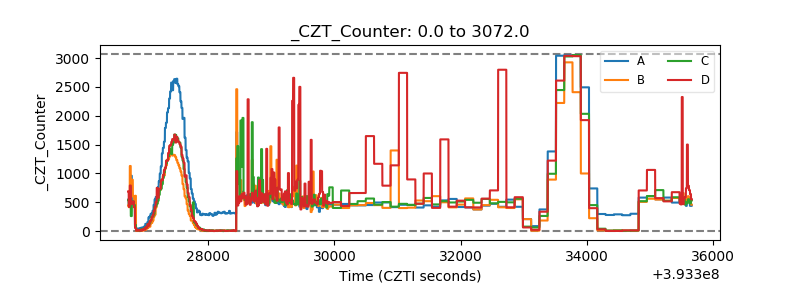 |
| +2.5 Volts monitor | 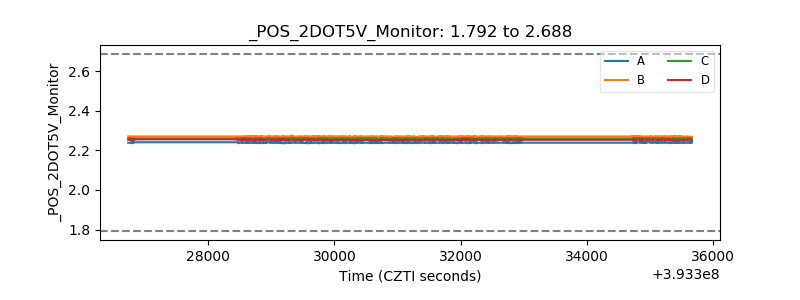 |
| +5 Volts monitor | 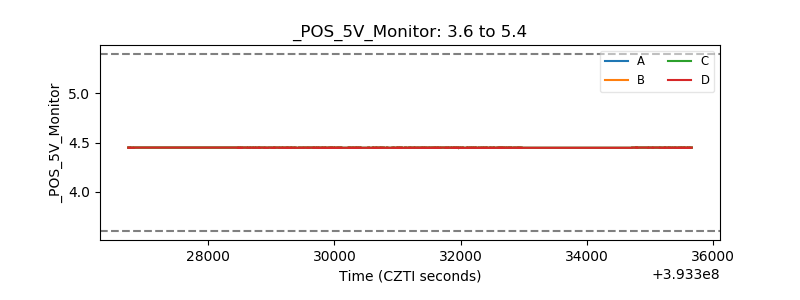 |
| _ROLL_ROT | 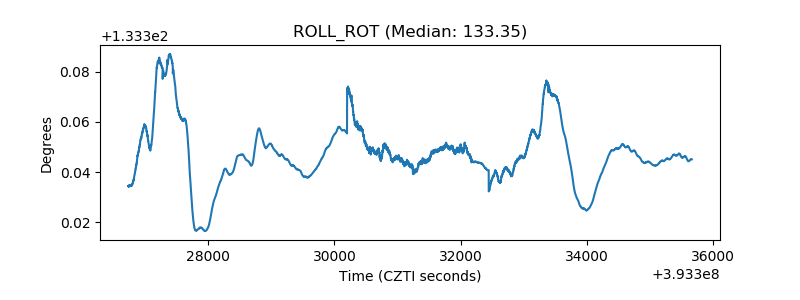 |
| _Roll_DEC | 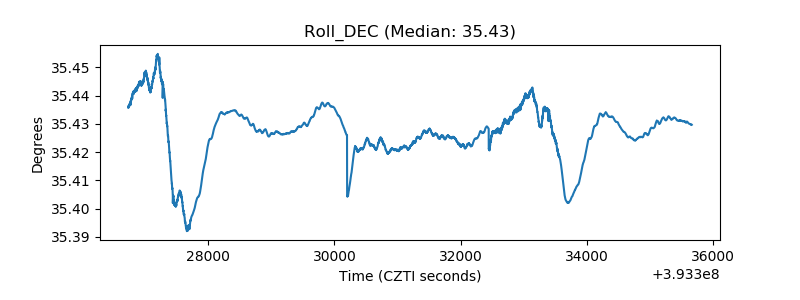 |
| _Roll_RA | 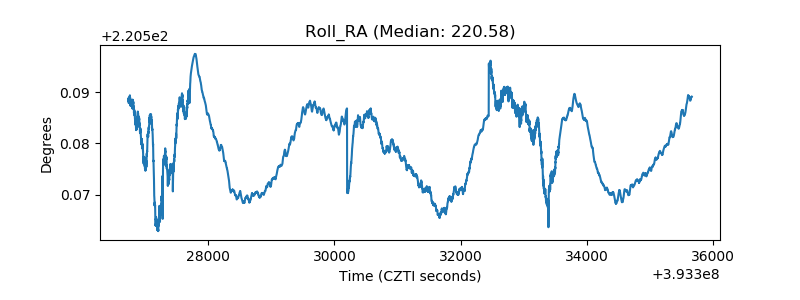 |
| Veto Counter | 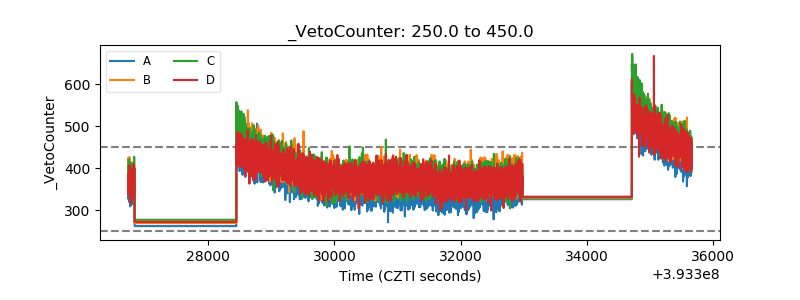 |