| Param | Original file | Final file |
|---|---|---|
| Filename | modeM0/AS1A11_097T17_9000005194_36356cztM0_level2.evt | modeM0/AS1A11_097T17_9000005194_36356cztM0_level2_quad_clean.evt |
| Size (bytes) | 1,331,236,800 | 186,310,080 |
| Size | 1.2 GB | 177.7 MB |
| Events in quadrant A | 7,889,130 | 1,163,926 |
| Events in quadrant B | 11,183,198 | 1,131,648 |
| Events in quadrant C | 8,809,129 | 1,165,632 |
| Events in quadrant D | 11,352,778 | 1,074,596 |
| Mode SS | |||
|---|---|---|---|
| Quadrant | BADHDUFLAG | Total packets | Discarded packets |
| A | 0 | 332 | 0 |
| B | 0 | 332 | 0 |
| C | 0 | 332 | 0 |
| D | 0 | 332 | 0 |
| Mode M0 | |||
|---|---|---|---|
| Quadrant | BADHDUFLAG | Total packets | Discarded packets |
| A | 0 | 33583 | 5 |
| B | 0 | 43729 | 4 |
| C | 0 | 35867 | 4 |
| D | 0 | 44609 | 4 |
| Mode M9 | |||
|---|---|---|---|
| Quadrant | BADHDUFLAG | Total packets | Discarded packets |
| A | 0 | 54 | 0 |
| B | 0 | 54 | 0 |
| C | 0 | 54 | 0 |
| D | 0 | 54 | 0 |
| Quadrant | Total seconds | Saturated seconds | Saturation percentage |
|---|---|---|---|
| A | 16026 | 35 | 0.218395% |
| B | 16026 | 1145 | 7.144640% |
| C | 16026 | 356 | 2.221390% |
| D | 16026 | 979 | 6.108823% |
Noise dominated data is calculated using 1-second bins in cleaned event files. If a bin has >2000 counts, and if more than 50% of those come from <1% of pixels, then it is considered to be noise-dominated and hence unusable.
| Quadrant | # 1 sec bins | Bins with >0 counts | Bins with >2000 counts | High rate bins dominated by noise | Noise dominated (total time) | Noise dominated (detector-on time) | Marked lightcurve |
|---|---|---|---|---|---|---|---|
| A | 21517 | 16031 | 15 | 15 | 0.07% | 0.09% | 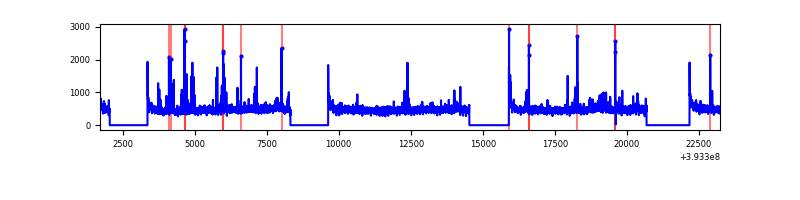 |
| B | 21517 | 16031 | 895 | 895 | 4.16% | 5.58% | 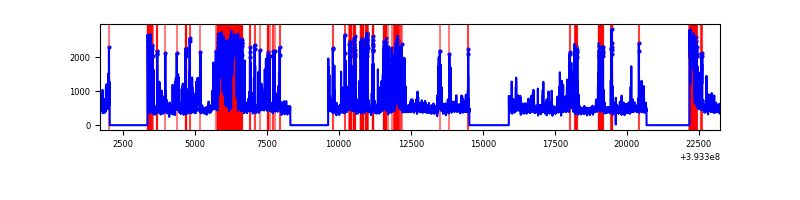 |
| C | 21517 | 16031 | 353 | 353 | 1.64% | 2.20% | 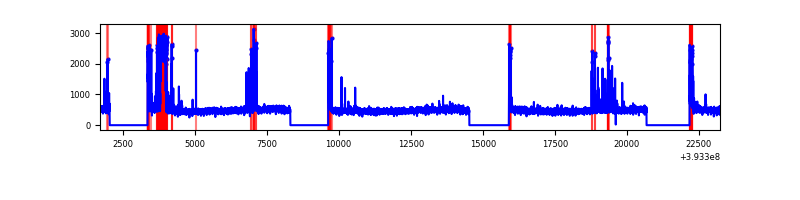 |
| D | 21517 | 16031 | 982 | 982 | 4.56% | 6.13% | 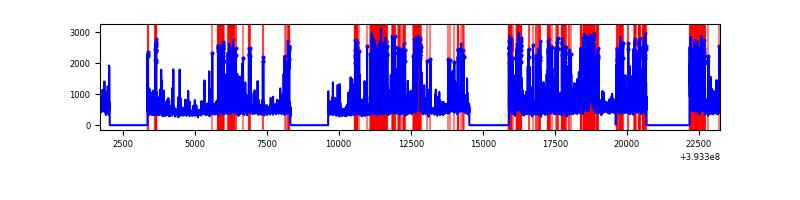 |
Top three noisy pixels from each quadrant. If the there are fewer than three noisy pixels in the level2.evt file, extra rows are filled as -1
| Pixel properties | Quadrant properties | ||||||
|---|---|---|---|---|---|---|---|
| Quadrant | DetID | PixID | Counts | Sigma | Mean | Median | Sigma |
| A | 10 | 83 | 453645 | 1235.13 | 1820 | 1785 | 365.8 |
| A | 9 | 143 | 192247 | 520.62 | 1820 | 1785 | 365.8 |
| A | 12 | 189 | 178566 | 483.22 | 1820 | 1785 | 365.8 |
| B | 5 | 172 | 2255989 | 6647.62 | 1762 | 1715 | 339.1 |
| B | 5 | 236 | 1575301 | 4640.34 | 1762 | 1715 | 339.1 |
| B | 4 | 171 | 111217 | 322.91 | 1762 | 1715 | 339.1 |
| C | 0 | 207 | 957324 | 2338.82 | 1764 | 1778 | 408.6 |
| C | 15 | 214 | 667904 | 1630.42 | 1764 | 1778 | 408.6 |
| C | 0 | 10 | 317325 | 772.34 | 1764 | 1778 | 408.6 |
| D | 12 | 6 | 1537603 | 3645.24 | 1733 | 1685 | 421.3 |
| D | 2 | 250 | 998435 | 2365.62 | 1733 | 1685 | 421.3 |
| D | 2 | 249 | 724452 | 1715.36 | 1733 | 1685 | 421.3 |
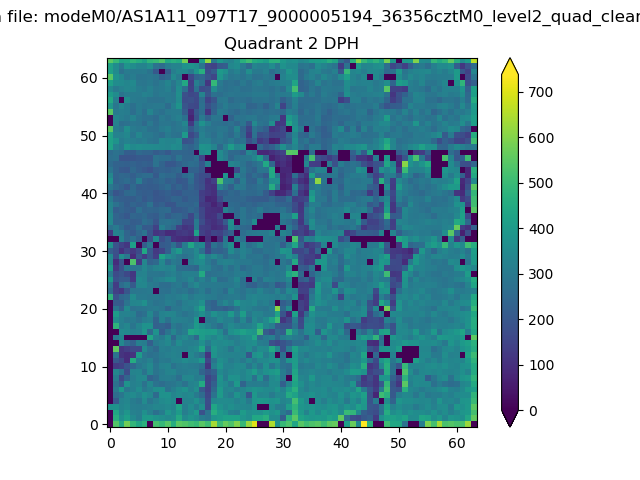
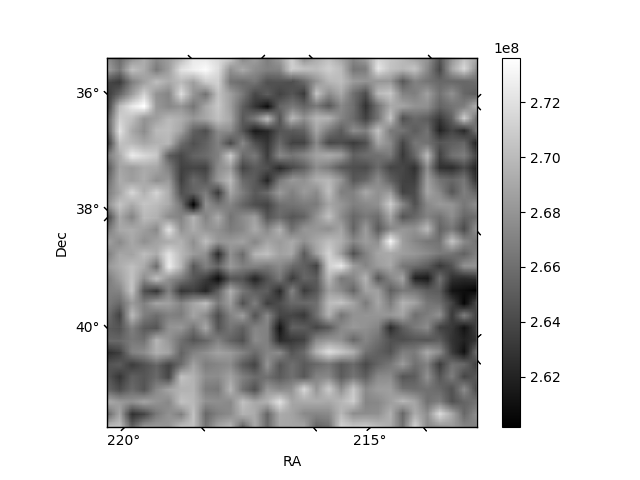
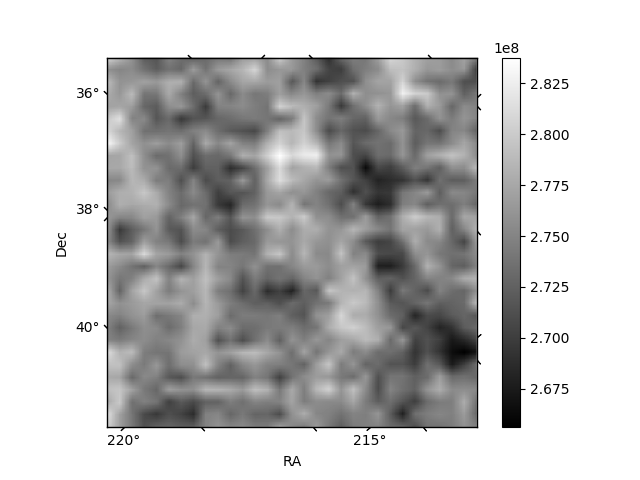
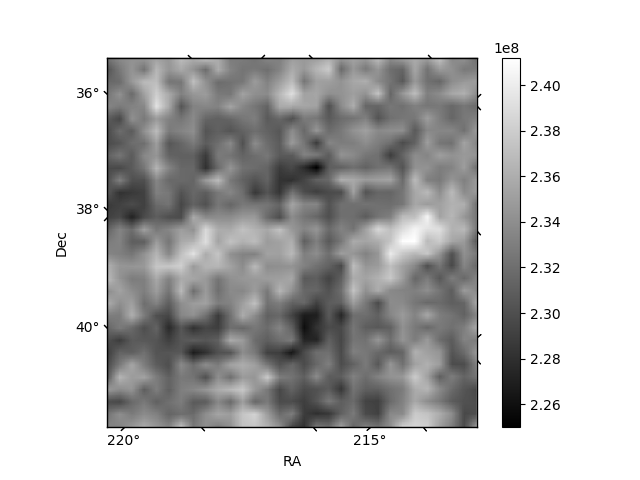
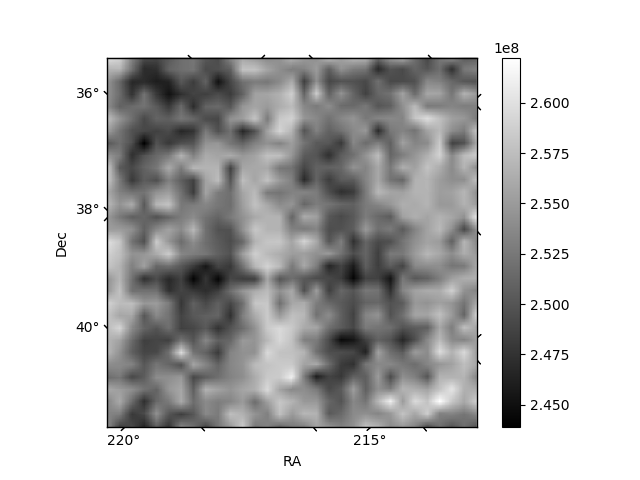
Histogram calculated using DETX and DETY for each event in the final _common_clean file
| Quadrant A | 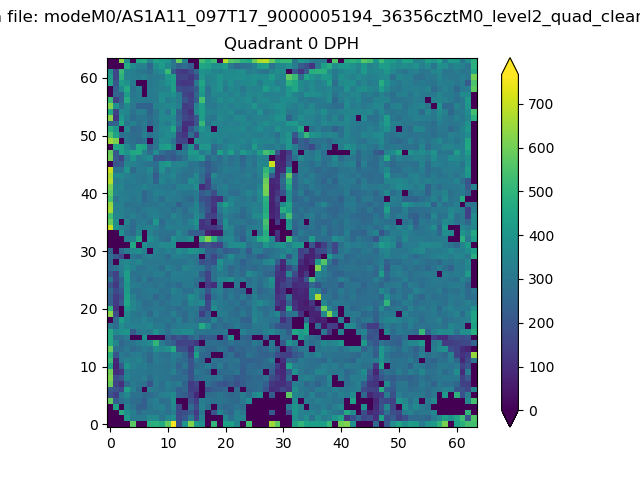 |
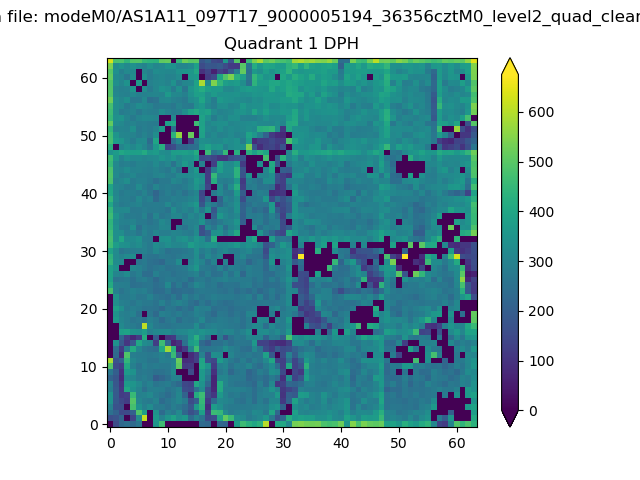 |
Quadrant B |
|---|---|---|---|
| Quadrant D | 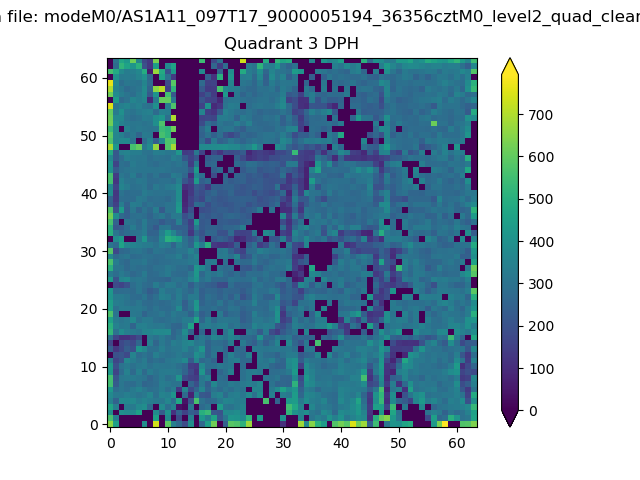 |
 |
Quadrant C |
| Plot type | Count rate plots | Images |
|---|---|---|
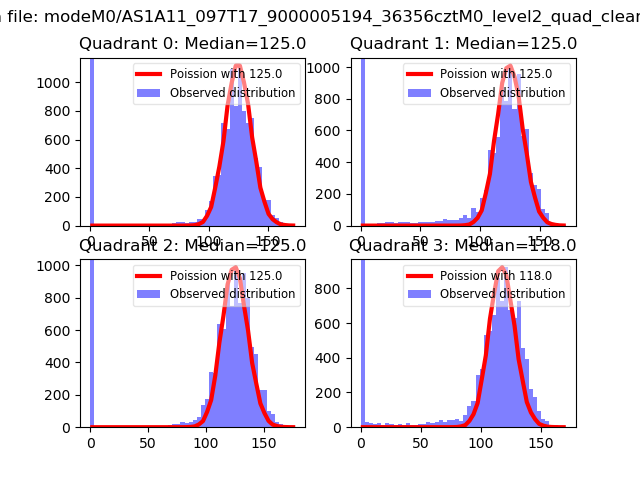
| Comparison with Poisson distribution Blue bars denote a histogram of data divided into 1 sec bins. Red curve is a Poisson curve with rate = median count rate of data. |
 |
 |
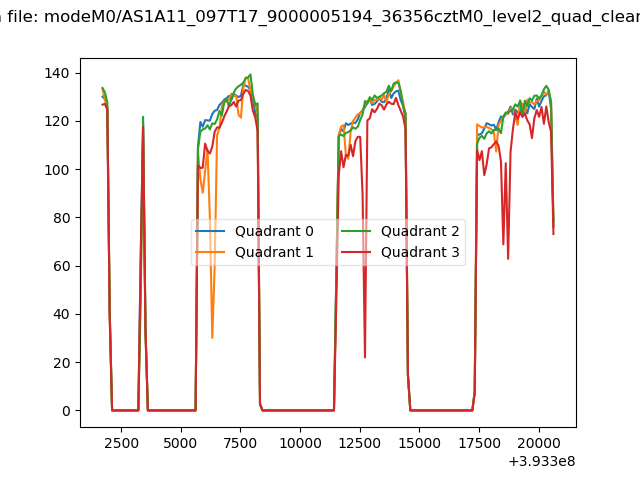
| Quadrant-wise count rates Data is divided into 100 sec bins |
 |
|
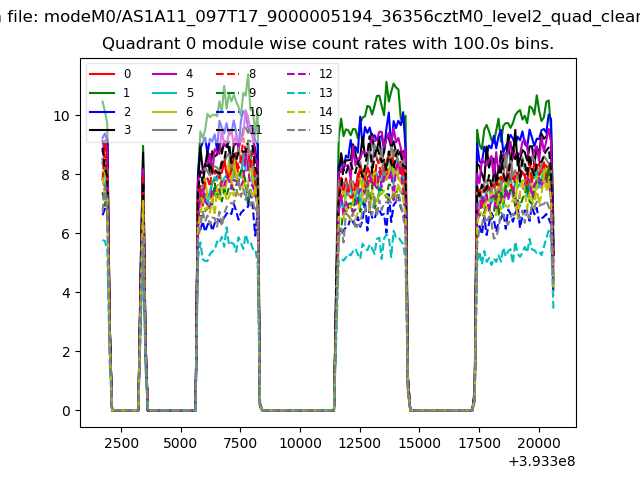
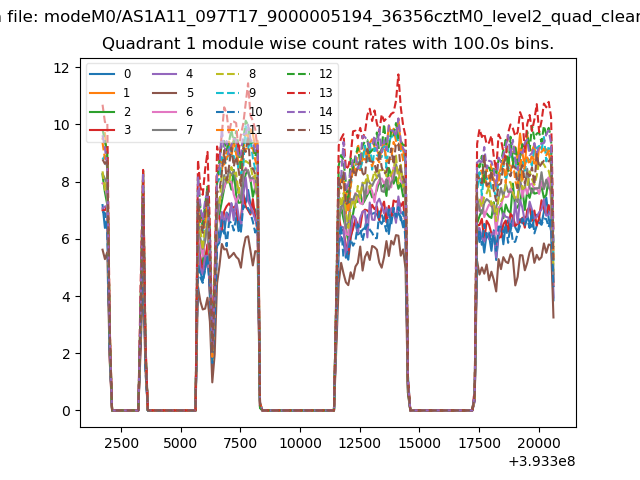
| Module-wise count rates for Quadrant A Data is divided into 100 sec bins |
 |
 |
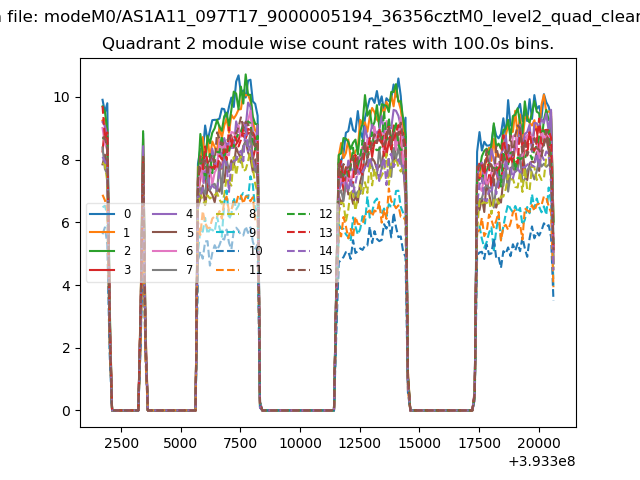
| Module-wise count rates for Quadrant B Data is divided into 100 sec bins |
 |
 |
| Module-wise count rates for Quadrant C Data is divided into 100 sec bins |
 |
 |
| Module-wise count rates for Quadrant D Data is divided into 100 sec bins |
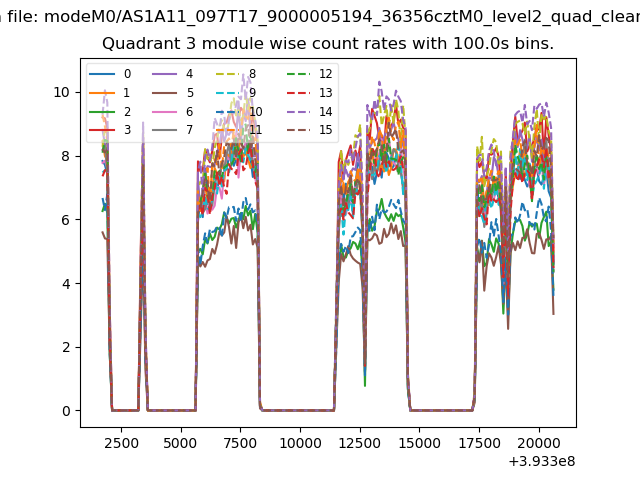 |
 |
| Parameter | Plot |
|---|---|
| CZT HV Monitor | 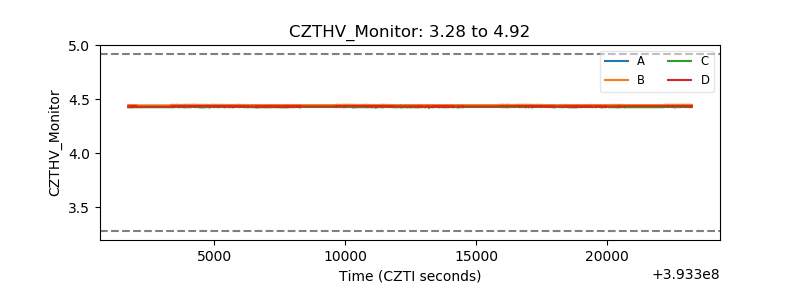 |
| D_VDD | 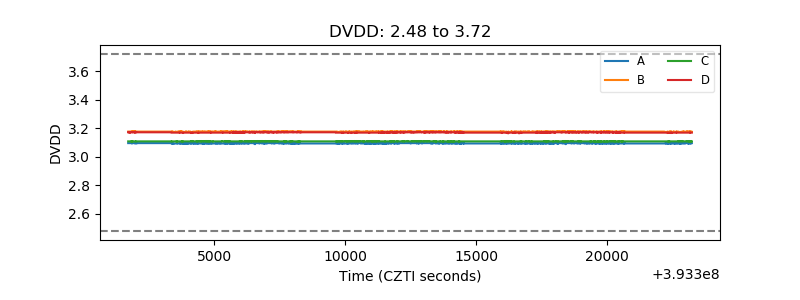 |
| Temperature 1 | 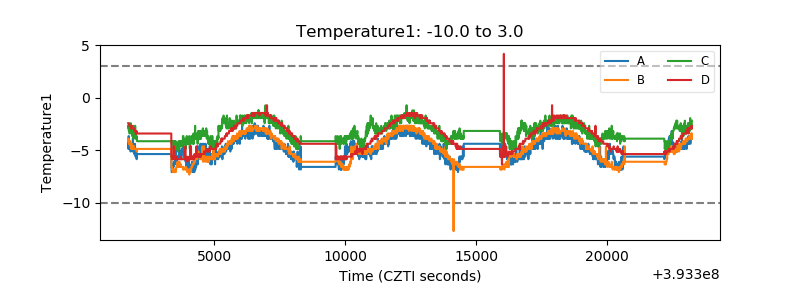 |
| Veto HV Monitor | 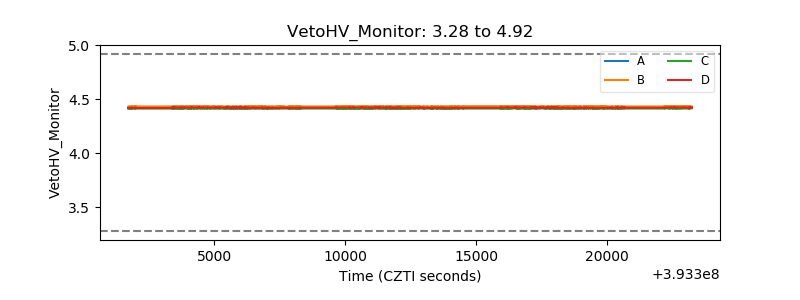 |
| Veto LLD | 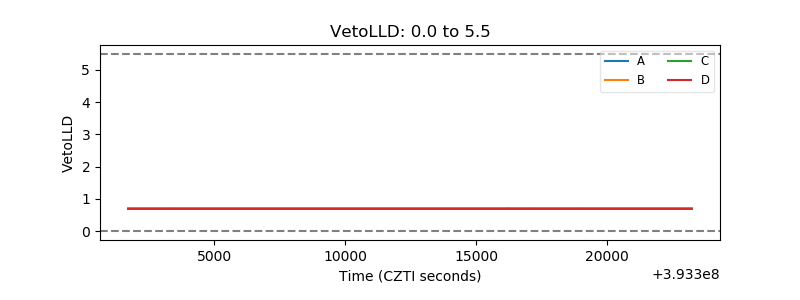 |
| Alpha Counter | 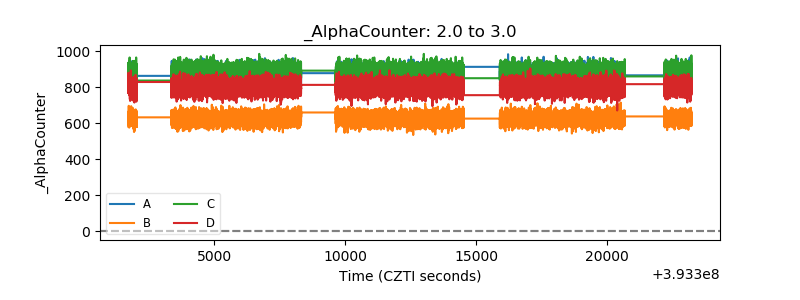 |
| _CPM_Rate | 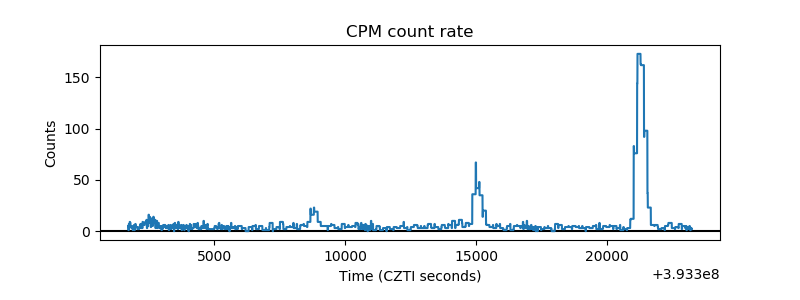 |
| CZT Counter | 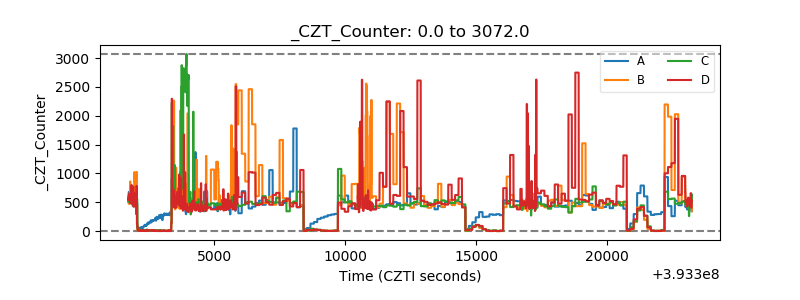 |
| +2.5 Volts monitor |  |
| +5 Volts monitor |  |
| _ROLL_ROT | 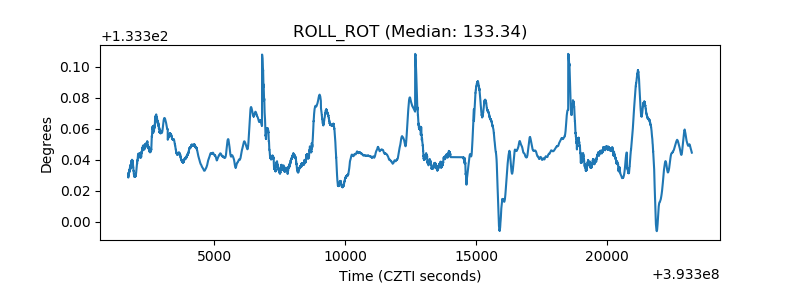 |
| _Roll_DEC | 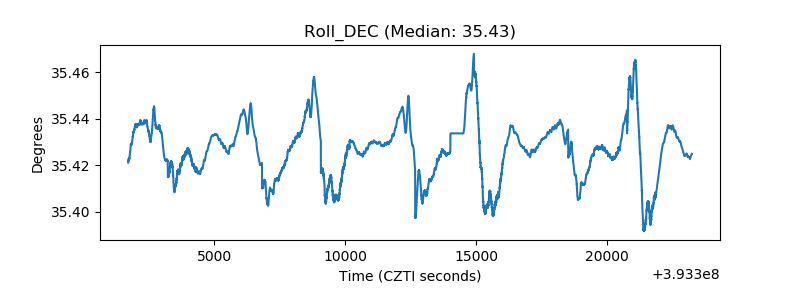 |
| _Roll_RA | 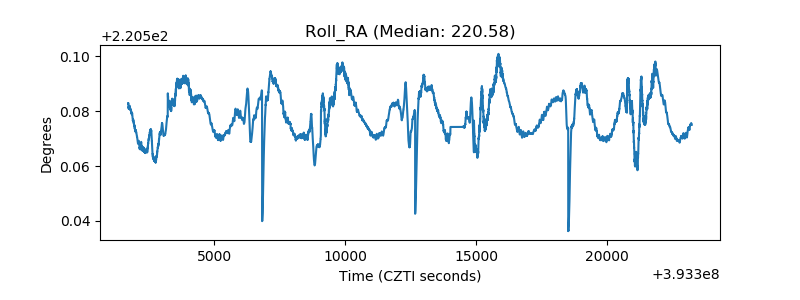 |
| Veto Counter | 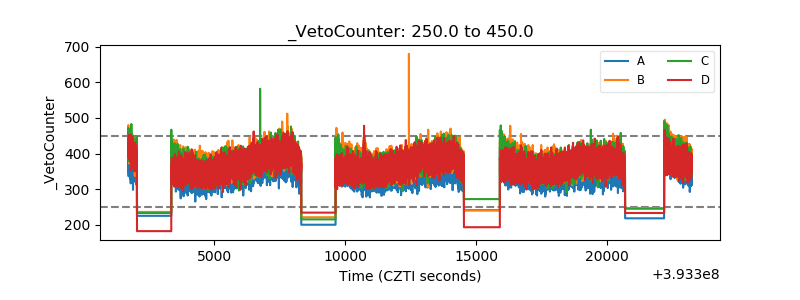 |