| Param | Original file | Final file |
|---|---|---|
| Filename | modeM0/AS1A10_103T02_9000005192_36343cztM0_level2.evt | modeM0/AS1A10_103T02_9000005192_36343cztM0_level2_quad_clean.evt |
| Size (bytes) | 436,861,440 | 69,082,560 |
| Size | 416.6 MB | 65.9 MB |
| Events in quadrant A | 2,668,266 | 435,392 |
| Events in quadrant B | 3,767,328 | 427,600 |
| Events in quadrant C | 2,816,149 | 434,012 |
| Events in quadrant D | 3,605,017 | 409,899 |
| Mode M9 | |||
|---|---|---|---|
| Quadrant | BADHDUFLAG | Total packets | Discarded packets |
| A | 0 | 25 | 0 |
| B | 0 | 25 | 0 |
| C | 0 | 25 | 0 |
| D | 0 | 25 | 0 |
| Mode SS | |||
|---|---|---|---|
| Quadrant | BADHDUFLAG | Total packets | Discarded packets |
| A | 0 | 112 | 0 |
| B | 0 | 112 | 0 |
| C | 0 | 112 | 0 |
| D | 0 | 112 | 0 |
| Mode M0 | |||
|---|---|---|---|
| Quadrant | BADHDUFLAG | Total packets | Discarded packets |
| A | 0 | 11570 | 3 |
| B | 0 | 14867 | 2 |
| C | 0 | 11845 | 2 |
| D | 0 | 14509 | 2 |
| Quadrant | Total seconds | Saturated seconds | Saturation percentage |
|---|---|---|---|
| A | 5498 | 21 | 0.381957% |
| B | 5498 | 207 | 3.765005% |
| C | 5498 | 60 | 1.091306% |
| D | 5498 | 238 | 4.328847% |
Noise dominated data is calculated using 1-second bins in cleaned event files. If a bin has >2000 counts, and if more than 50% of those come from <1% of pixels, then it is considered to be noise-dominated and hence unusable.
| Quadrant | # 1 sec bins | Bins with >0 counts | Bins with >2000 counts | High rate bins dominated by noise | Noise dominated (total time) | Noise dominated (detector-on time) | Marked lightcurve |
|---|---|---|---|---|---|---|---|
| A | 7141 | 5499 | 5 | 5 | 0.07% | 0.09% | 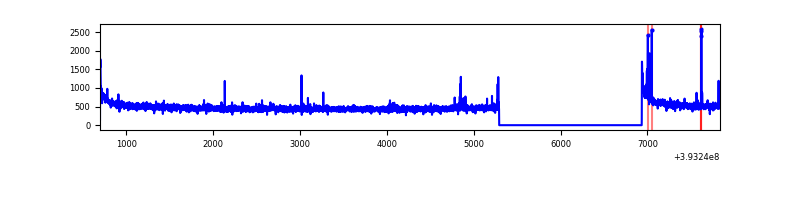 |
| B | 7141 | 5499 | 105 | 105 | 1.47% | 1.91% | 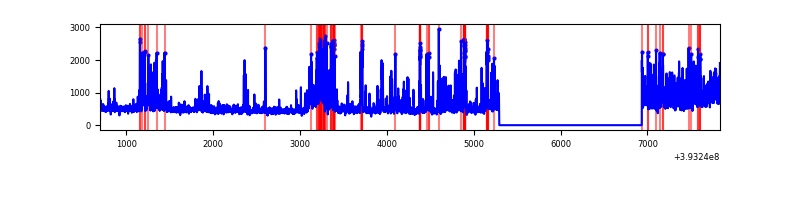 |
| C | 7141 | 5499 | 46 | 46 | 0.64% | 0.84% | 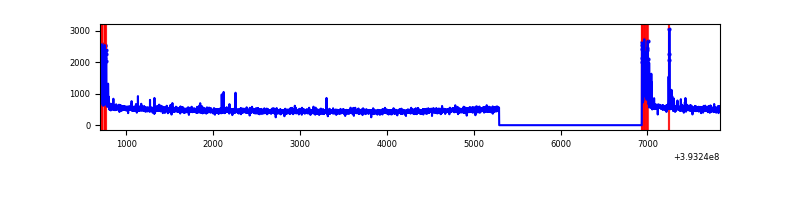 |
| D | 7141 | 5499 | 238 | 238 | 3.33% | 4.33% | 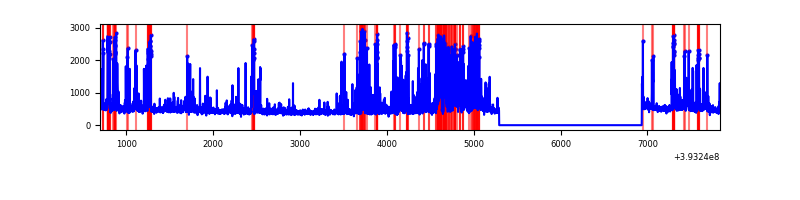 |
Top three noisy pixels from each quadrant. If the there are fewer than three noisy pixels in the level2.evt file, extra rows are filled as -1
| Pixel properties | Quadrant properties | ||||||
|---|---|---|---|---|---|---|---|
| Quadrant | DetID | PixID | Counts | Sigma | Mean | Median | Sigma |
| A | 10 | 83 | 196252 | 1553.26 | 622 | 610 | 126.0 |
| A | 9 | 143 | 46491 | 364.26 | 622 | 610 | 126.0 |
| A | 12 | 189 | 9910 | 73.84 | 622 | 610 | 126.0 |
| B | 4 | 171 | 427878 | 3641.17 | 609 | 591 | 117.3 |
| B | 0 | 190 | 336402 | 2861.64 | 609 | 591 | 117.3 |
| B | 5 | 236 | 213728 | 1816.27 | 609 | 591 | 117.3 |
| C | 15 | 214 | 236792 | 1687.3 | 601 | 604 | 140.0 |
| C | 0 | 10 | 205108 | 1460.95 | 601 | 604 | 140.0 |
| C | 15 | 159 | 21812 | 151.51 | 601 | 604 | 140.0 |
| D | 12 | 6 | 773880 | 5330.9 | 595 | 579 | 145.1 |
| D | 13 | 249 | 135164 | 927.79 | 595 | 579 | 145.1 |
| D | 13 | 171 | 107157 | 734.72 | 595 | 579 | 145.1 |
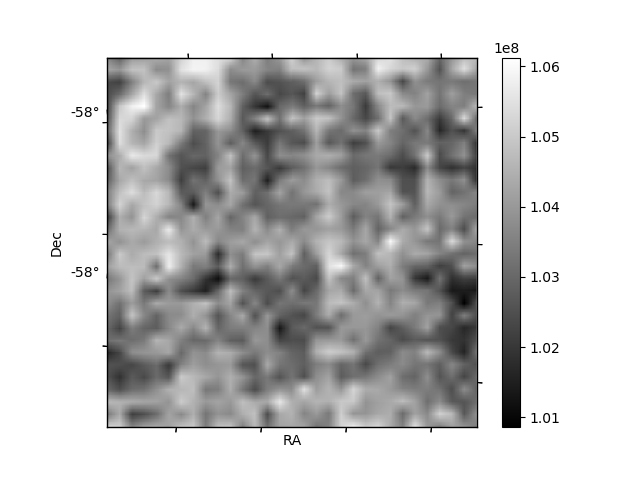
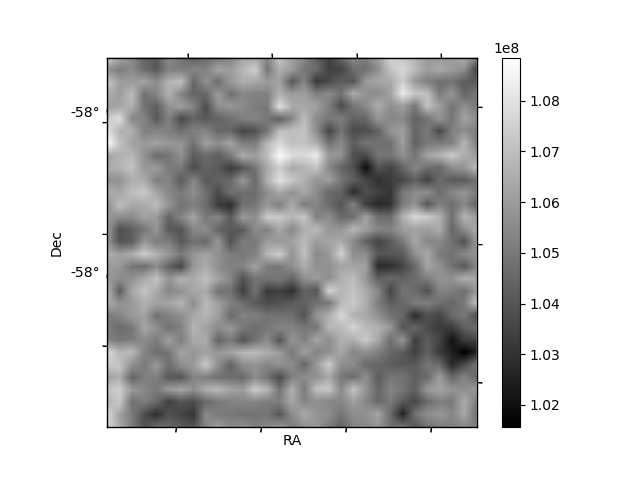
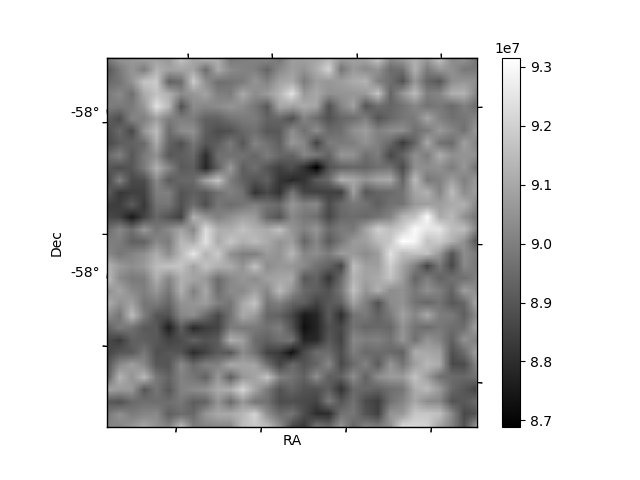
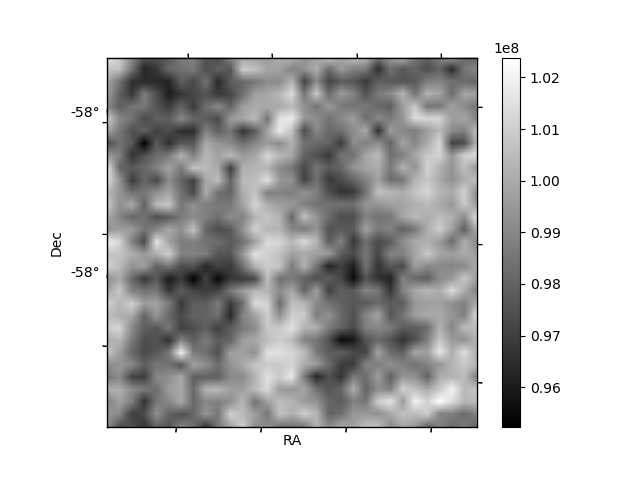
Histogram calculated using DETX and DETY for each event in the final _common_clean file
| Quadrant A | 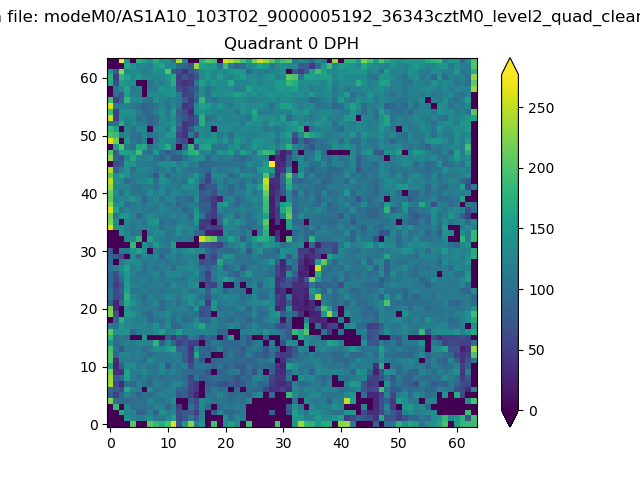 |
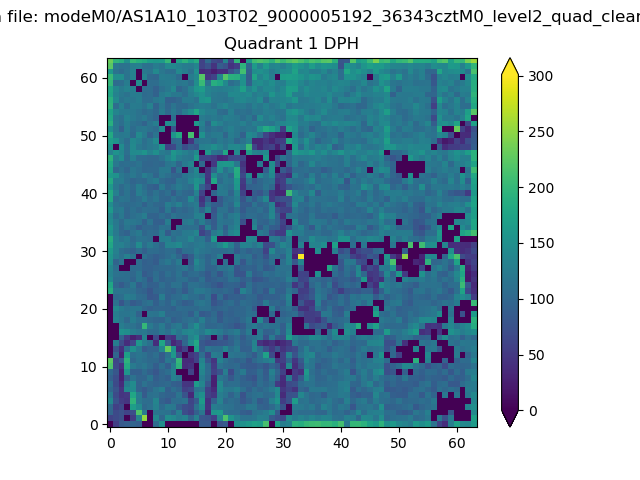 |
Quadrant B |
|---|---|---|---|
| Quadrant D | 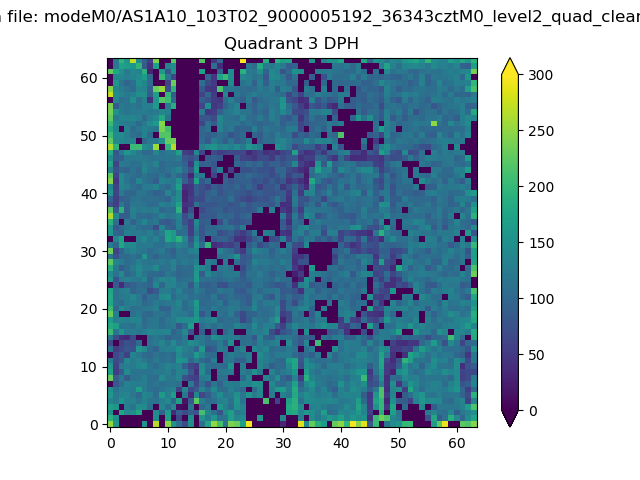 |
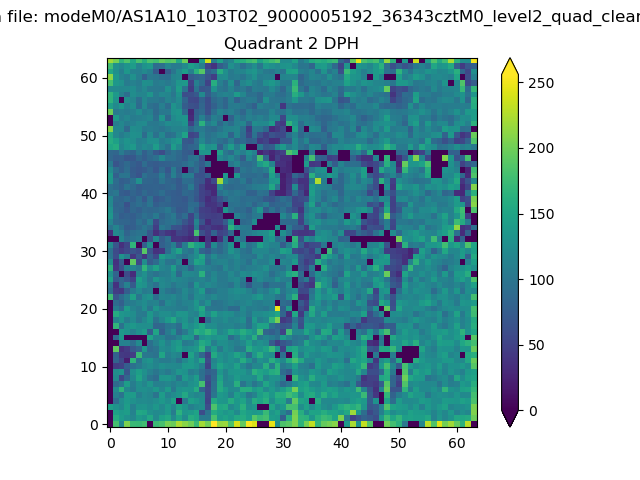 |
Quadrant C |
| Plot type | Count rate plots | Images |
|---|---|---|
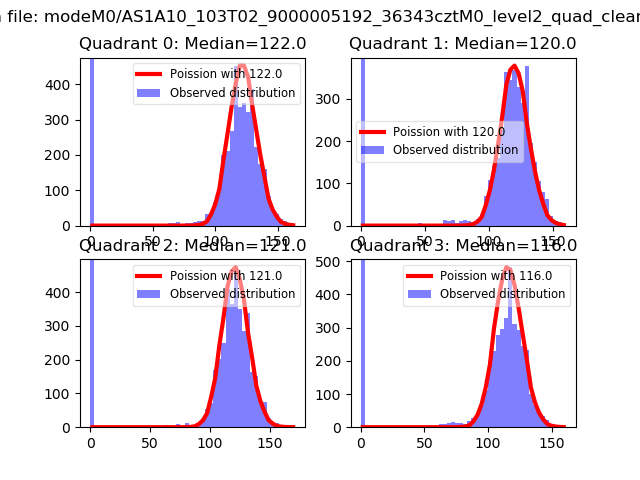
| Comparison with Poisson distribution Blue bars denote a histogram of data divided into 1 sec bins. Red curve is a Poisson curve with rate = median count rate of data. |
 |
 |
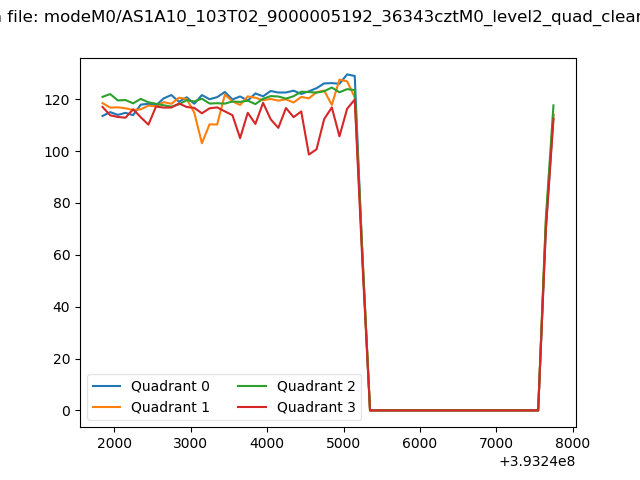
| Quadrant-wise count rates Data is divided into 100 sec bins |
 |
|
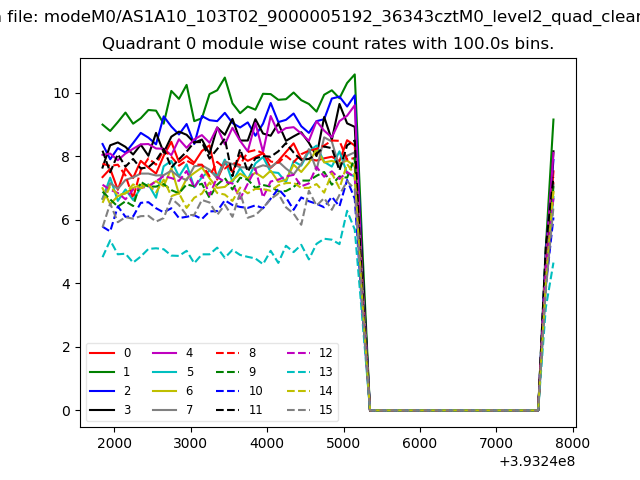
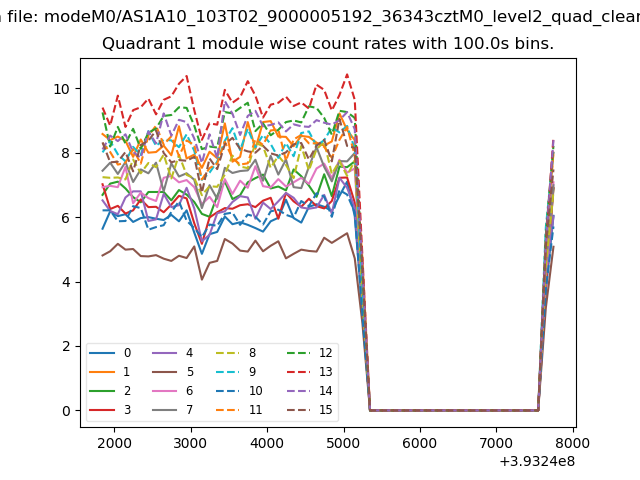
| Module-wise count rates for Quadrant A Data is divided into 100 sec bins |
 |
 |
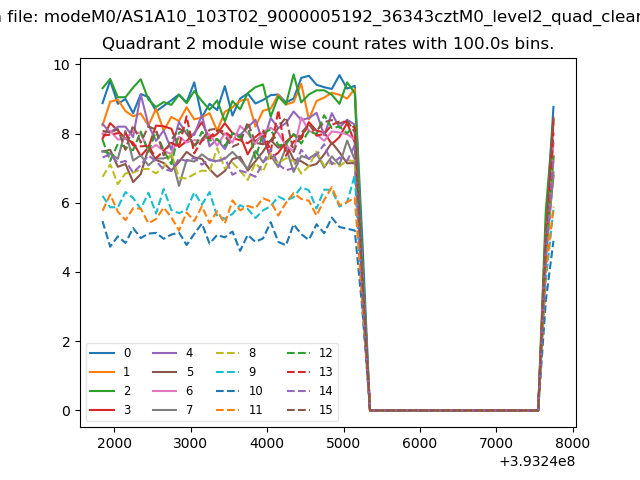
| Module-wise count rates for Quadrant B Data is divided into 100 sec bins |
 |
 |
| Module-wise count rates for Quadrant C Data is divided into 100 sec bins |
 |
 |
| Module-wise count rates for Quadrant D Data is divided into 100 sec bins |
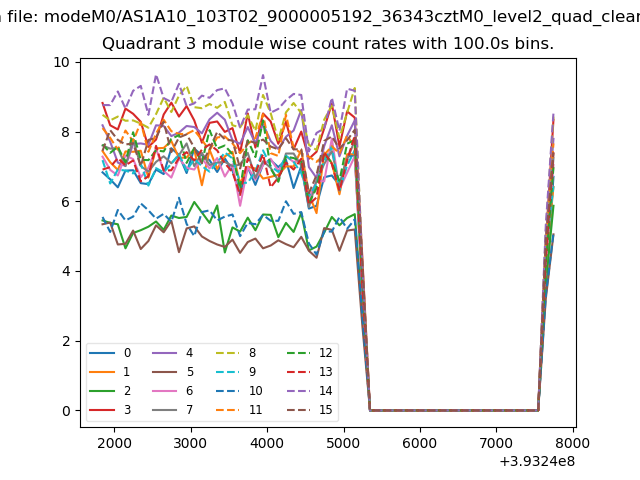 |
 |
| Parameter | Plot |
|---|---|
| CZT HV Monitor | 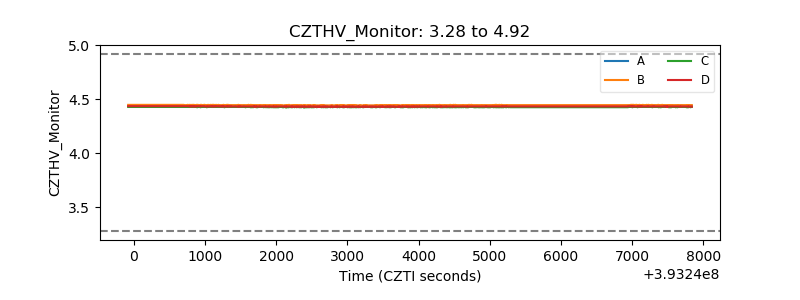 |
| D_VDD | 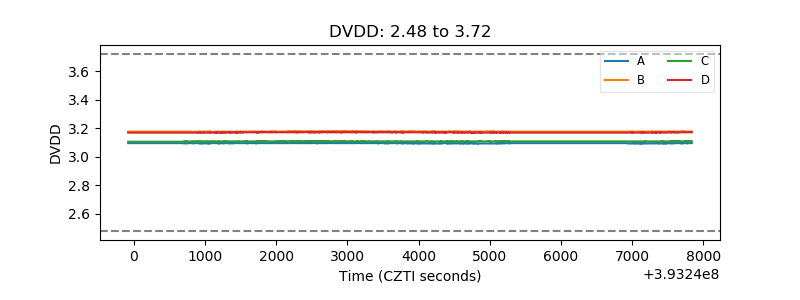 |
| Temperature 1 | 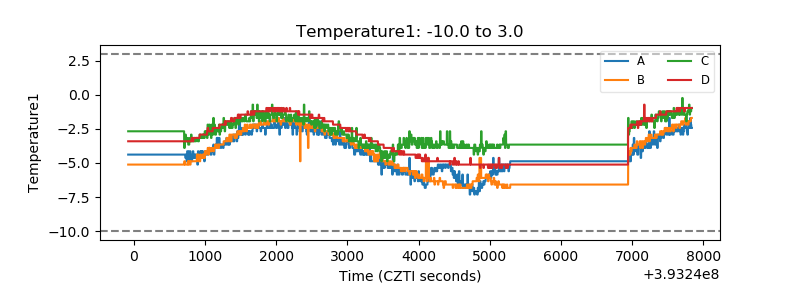 |
| Veto HV Monitor | 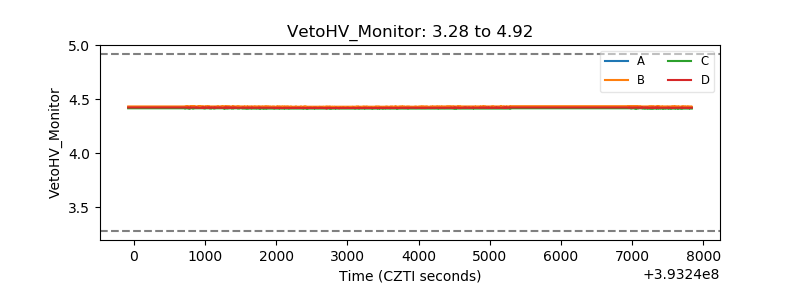 |
| Veto LLD | 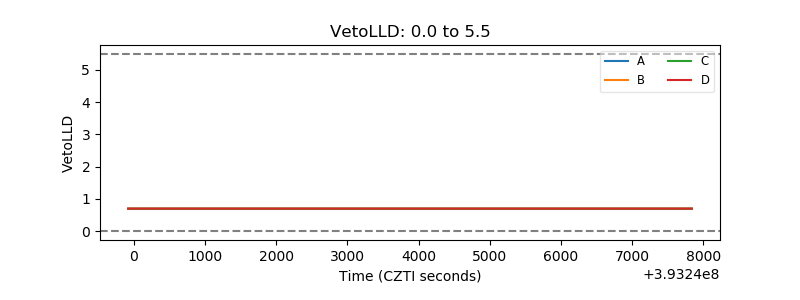 |
| Alpha Counter | 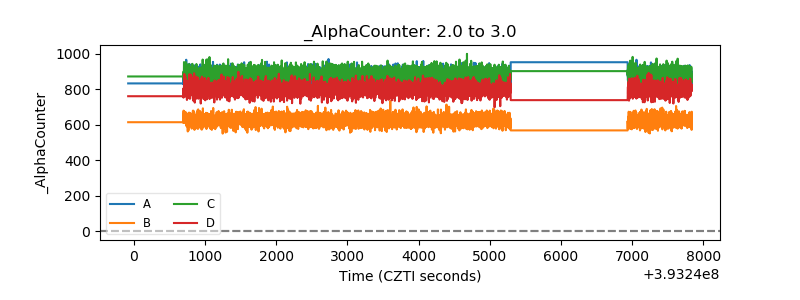 |
| _CPM_Rate | 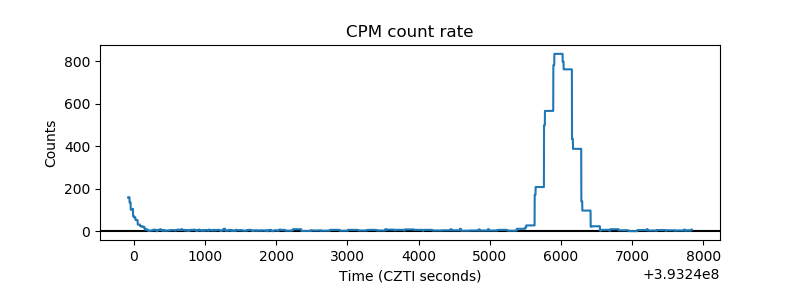 |
| CZT Counter | 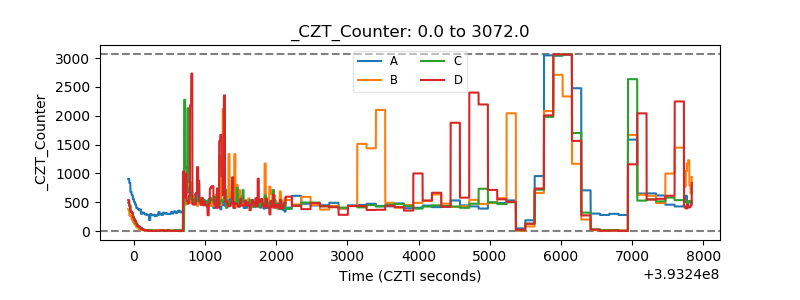 |
| +2.5 Volts monitor |  |
| +5 Volts monitor | 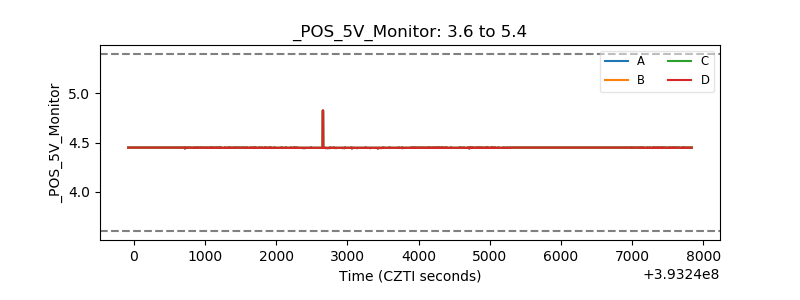 |
| _ROLL_ROT | 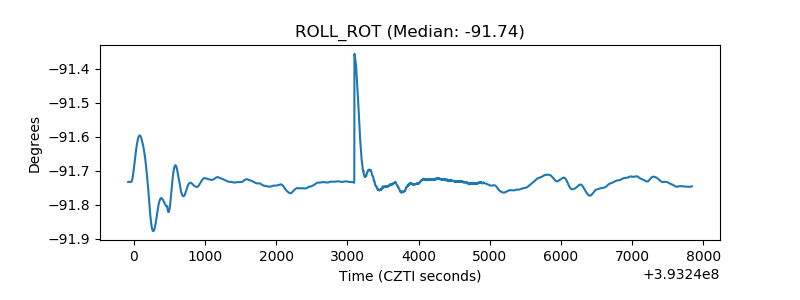 |
| _Roll_DEC | 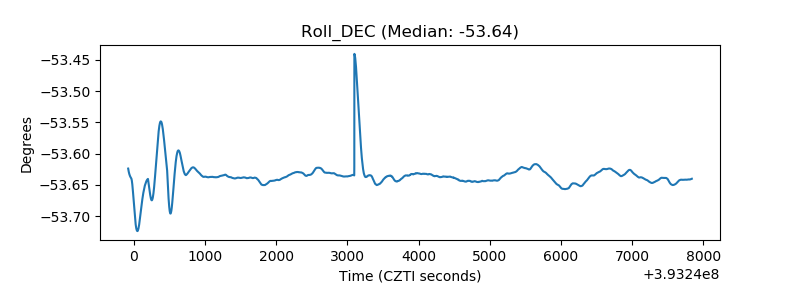 |
| _Roll_RA | 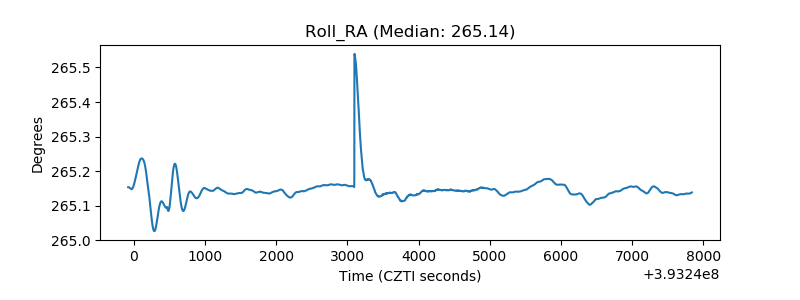 |
| Veto Counter | 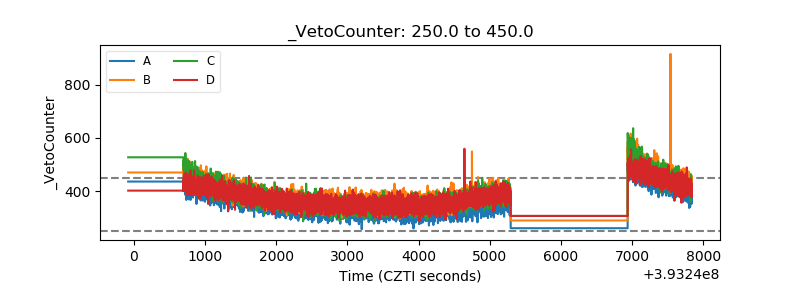 |