| Param | Original file | Final file |
|---|---|---|
| Filename | modeM0/AS1A11_089T02_9000005188_36312cztM0_level2.evt | modeM0/AS1A11_089T02_9000005188_36312cztM0_level2_quad_clean.evt |
| Size (bytes) | 1,126,175,040 | 133,522,560 |
| Size | 1.0 GB | 127.3 MB |
| Events in quadrant A | 5,203,660 | 888,660 |
| Events in quadrant B | 10,551,682 | 798,774 |
| Events in quadrant C | 5,631,623 | 869,378 |
| Events in quadrant D | 11,991,160 | 737,549 |
| Mode M9 | |||
|---|---|---|---|
| Quadrant | BADHDUFLAG | Total packets | Discarded packets |
| A | 0 | 34 | 0 |
| B | 0 | 34 | 0 |
| C | 0 | 34 | 0 |
| D | 0 | 35 | 0 |
| Mode M0 | |||
|---|---|---|---|
| Quadrant | BADHDUFLAG | Total packets | Discarded packets |
| A | 0 | 22339 | 4 |
| B | 0 | 38573 | 3 |
| C | 0 | 23338 | 3 |
| D | 0 | 42983 | 3 |
| Mode SS | |||
|---|---|---|---|
| Quadrant | BADHDUFLAG | Total packets | Discarded packets |
| A | 0 | 220 | 0 |
| B | 0 | 220 | 0 |
| C | 0 | 220 | 0 |
| D | 0 | 220 | 0 |
| Quadrant | Total seconds | Saturated seconds | Saturation percentage |
|---|---|---|---|
| A | 10805 | 45 | 0.416474% |
| B | 10805 | 1770 | 16.381305% |
| C | 10805 | 124 | 1.147617% |
| D | 10805 | 1829 | 16.927348% |
Noise dominated data is calculated using 1-second bins in cleaned event files. If a bin has >2000 counts, and if more than 50% of those come from <1% of pixels, then it is considered to be noise-dominated and hence unusable.
| Quadrant | # 1 sec bins | Bins with >0 counts | Bins with >2000 counts | High rate bins dominated by noise | Noise dominated (total time) | Noise dominated (detector-on time) | Marked lightcurve |
|---|---|---|---|---|---|---|---|
| A | 13580 | 10807 | 32 | 32 | 0.24% | 0.30% | 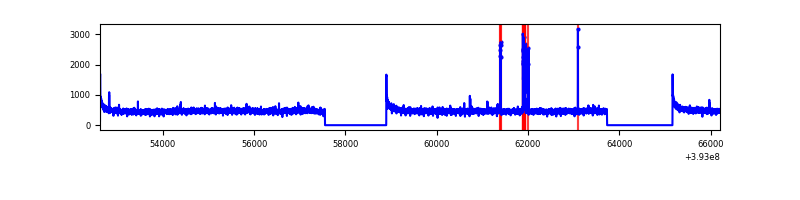 |
| B | 13580 | 10807 | 1518 | 1518 | 11.18% | 14.05% | 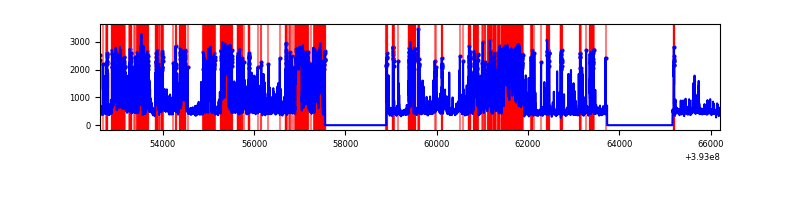 |
| C | 13580 | 10807 | 108 | 108 | 0.80% | 1.00% | 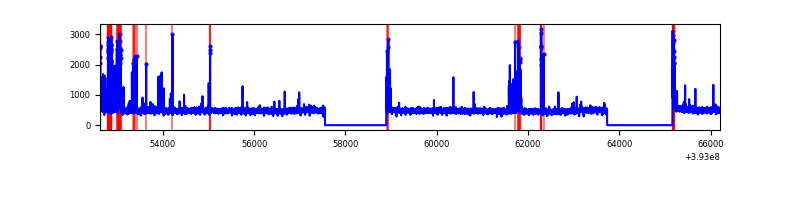 |
| D | 13580 | 10807 | 1882 | 1882 | 13.86% | 17.41% | 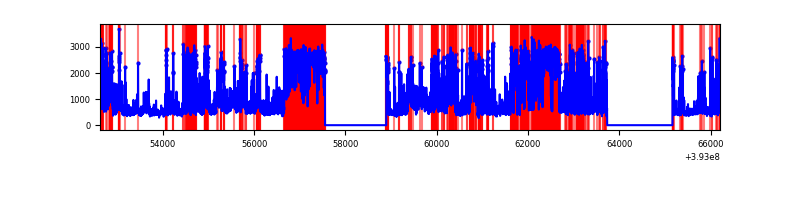 |
Top three noisy pixels from each quadrant. If the there are fewer than three noisy pixels in the level2.evt file, extra rows are filled as -1
| Pixel properties | Quadrant properties | ||||||
|---|---|---|---|---|---|---|---|
| Quadrant | DetID | PixID | Counts | Sigma | Mean | Median | Sigma |
| A | 10 | 83 | 318644 | 1284.99 | 1225 | 1202 | 247.0 |
| A | 9 | 143 | 110308 | 441.66 | 1225 | 1202 | 247.0 |
| A | 13 | 6 | 20725 | 79.03 | 1225 | 1202 | 247.0 |
| B | 4 | 171 | 3406893 | 15650.58 | 1129 | 1098 | 217.6 |
| B | 5 | 172 | 2003908 | 9203.47 | 1129 | 1098 | 217.6 |
| B | 5 | 236 | 516268 | 2367.35 | 1129 | 1098 | 217.6 |
| C | 0 | 10 | 462172 | 1674.54 | 1179 | 1185 | 275.3 |
| C | 15 | 214 | 455235 | 1649.34 | 1179 | 1185 | 275.3 |
| C | 0 | 207 | 110528 | 397.19 | 1179 | 1185 | 275.3 |
| D | 12 | 227 | 2699353 | 9986.8 | 1109 | 1079 | 270.2 |
| D | 12 | 235 | 2534549 | 9376.83 | 1109 | 1079 | 270.2 |
| D | 12 | 6 | 1696458 | 6274.9 | 1109 | 1079 | 270.2 |
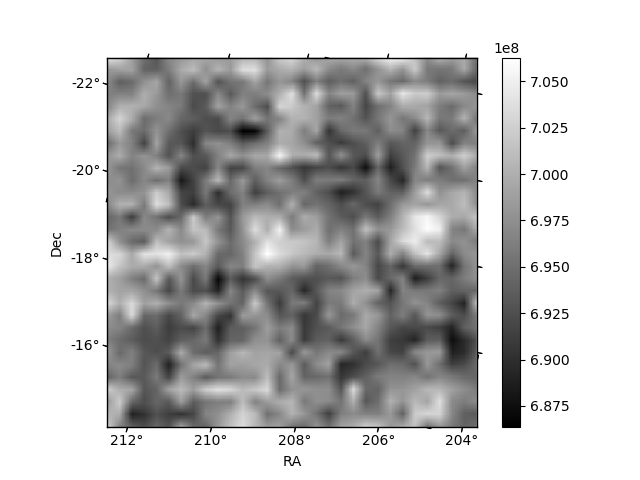
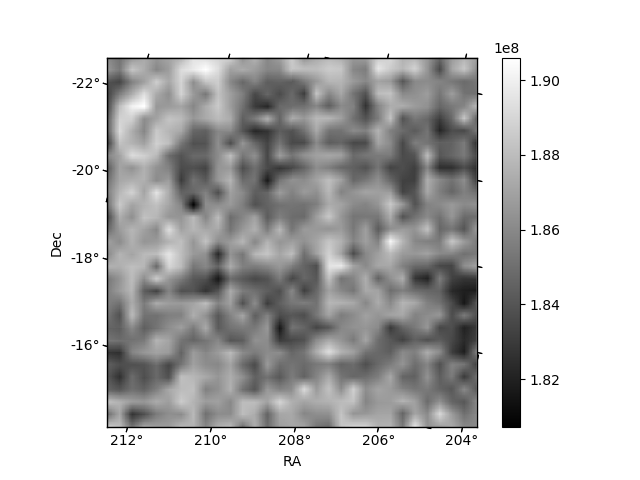
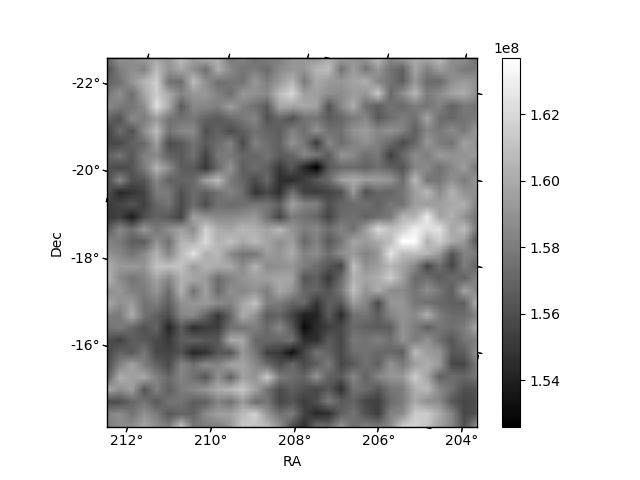
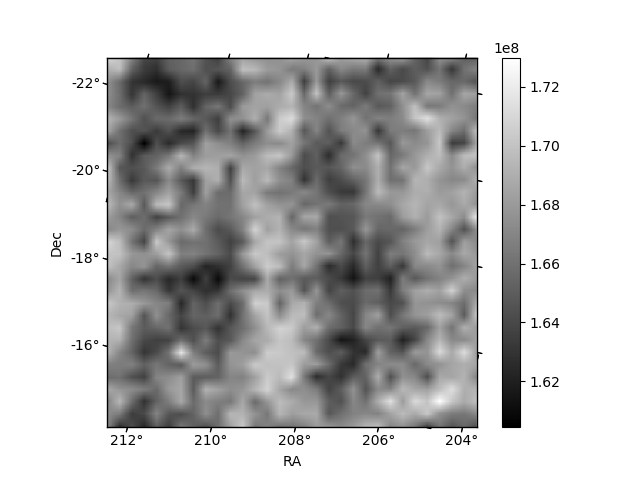
Histogram calculated using DETX and DETY for each event in the final _common_clean file
| Quadrant A | 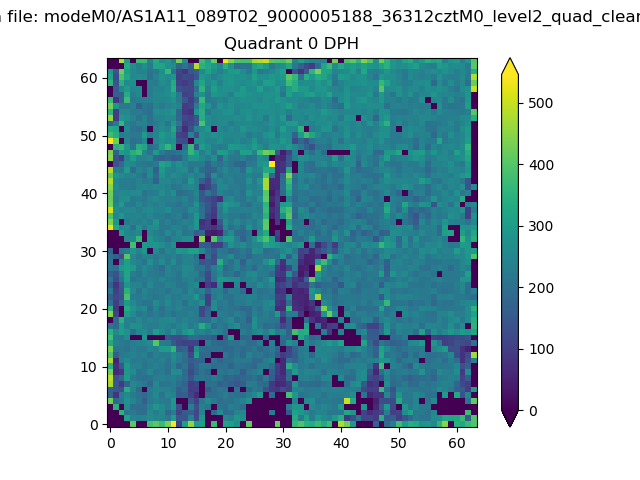 |
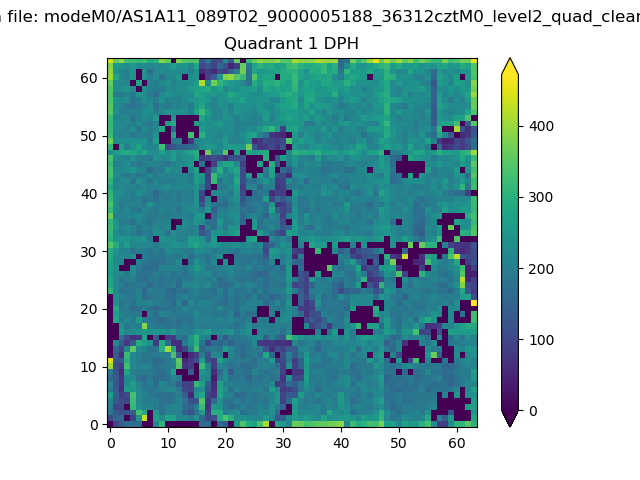 |
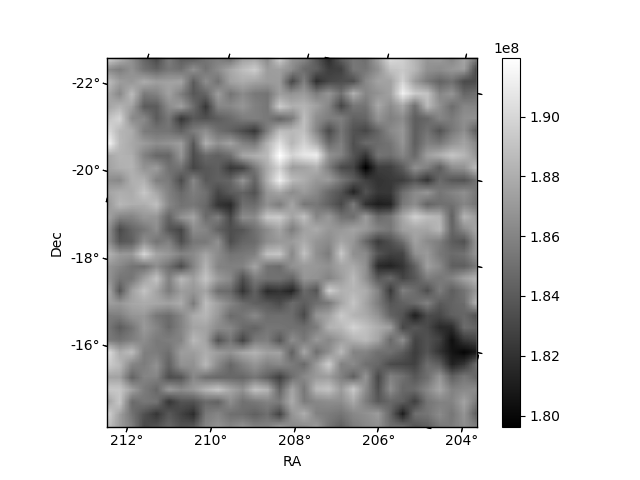
Quadrant B |
|---|---|---|---|
| Quadrant D | 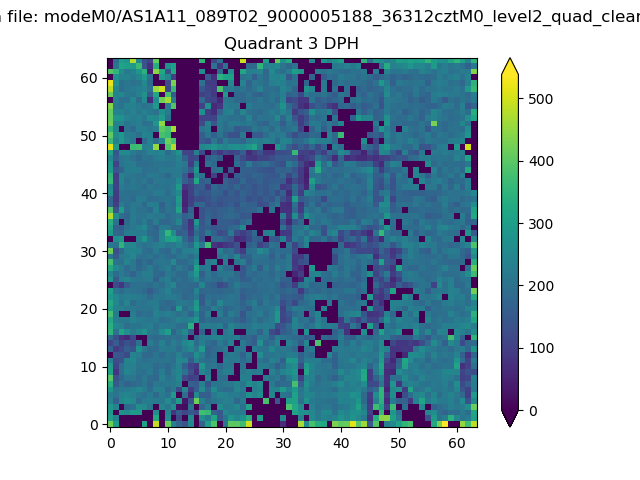 |
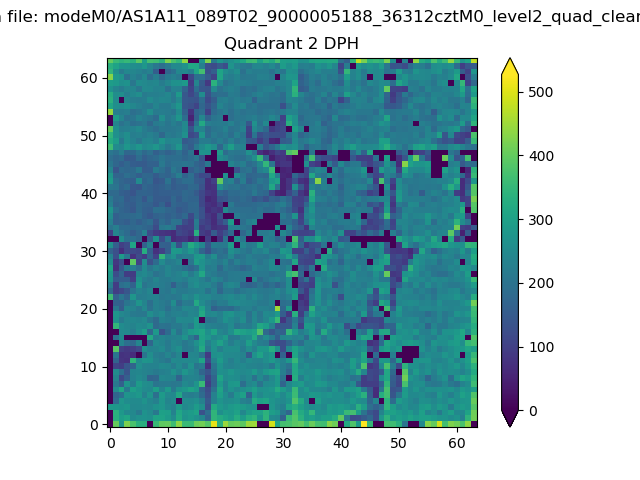 |
Quadrant C |
| Plot type | Count rate plots | Images |
|---|---|---|
| Comparison with Poisson distribution Blue bars denote a histogram of data divided into 1 sec bins. Red curve is a Poisson curve with rate = median count rate of data. |
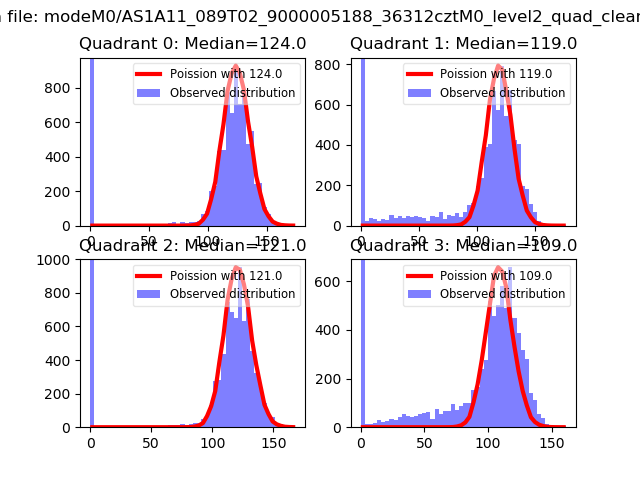 |
 |
| Quadrant-wise count rates Data is divided into 100 sec bins |
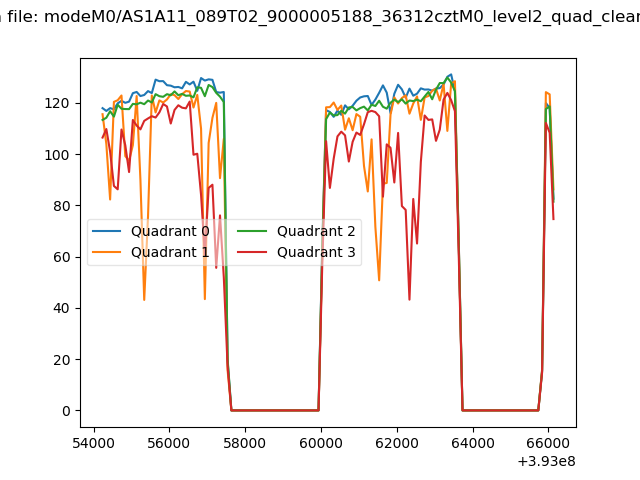 |
|
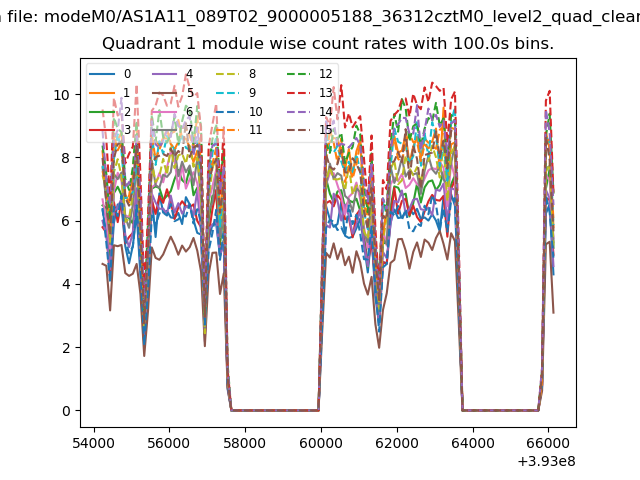
| Module-wise count rates for Quadrant A Data is divided into 100 sec bins |
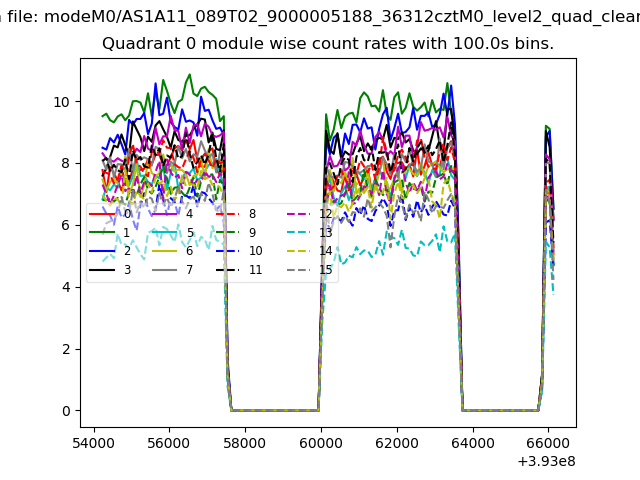 |
 |
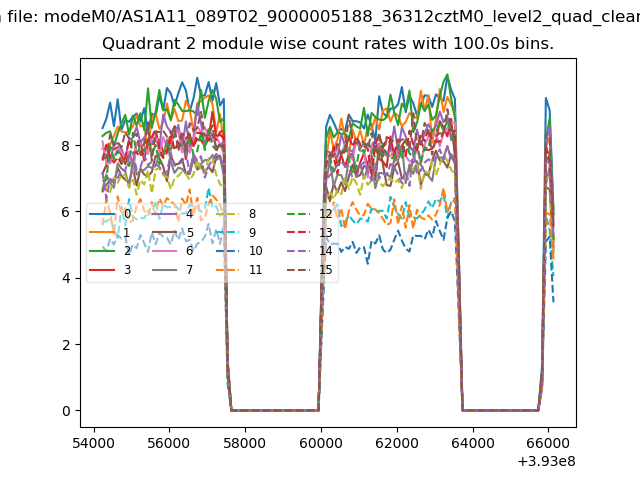
| Module-wise count rates for Quadrant B Data is divided into 100 sec bins |
 |
 |
| Module-wise count rates for Quadrant C Data is divided into 100 sec bins |
 |
 |
| Module-wise count rates for Quadrant D Data is divided into 100 sec bins |
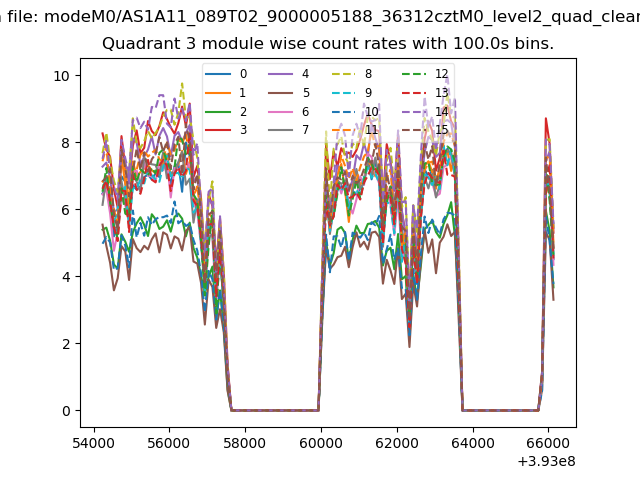 |
 |
| Parameter | Plot |
|---|---|
| CZT HV Monitor | 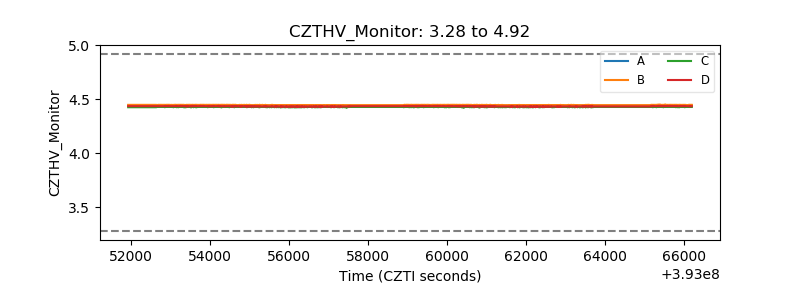 |
| D_VDD | 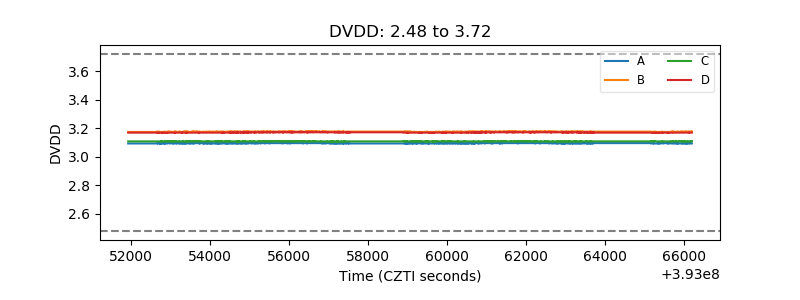 |
| Temperature 1 | 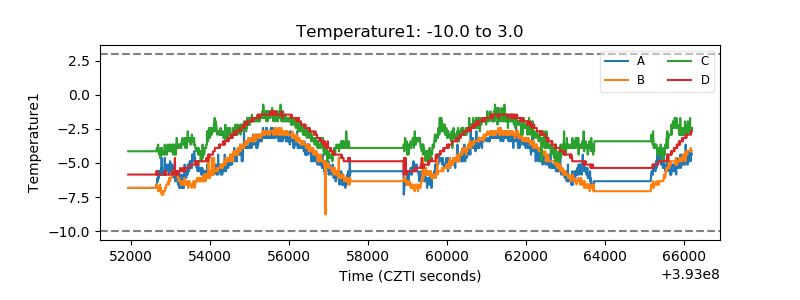 |
| Veto HV Monitor | 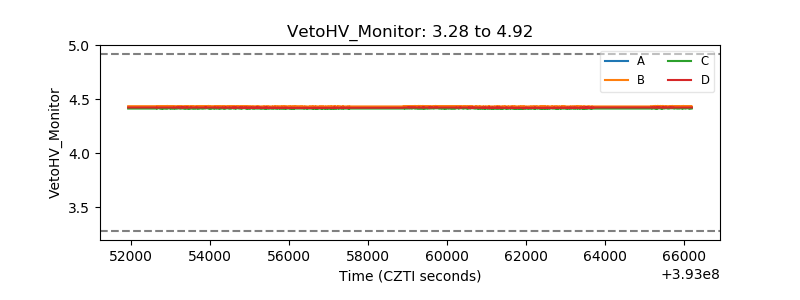 |
| Veto LLD | 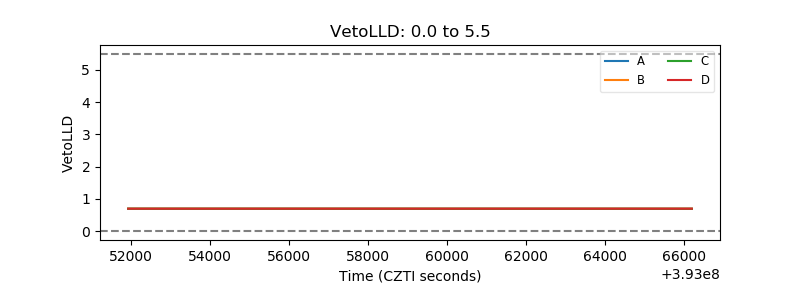 |
| Alpha Counter | 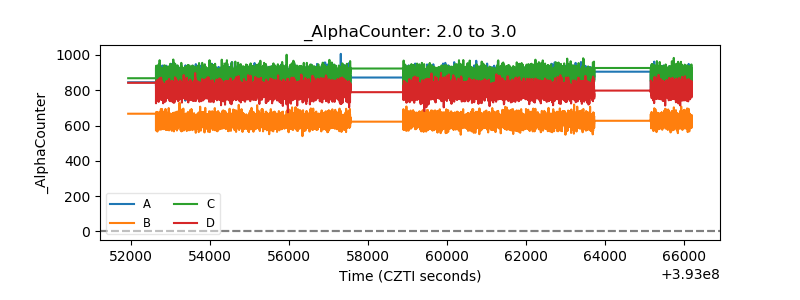 |
| _CPM_Rate | 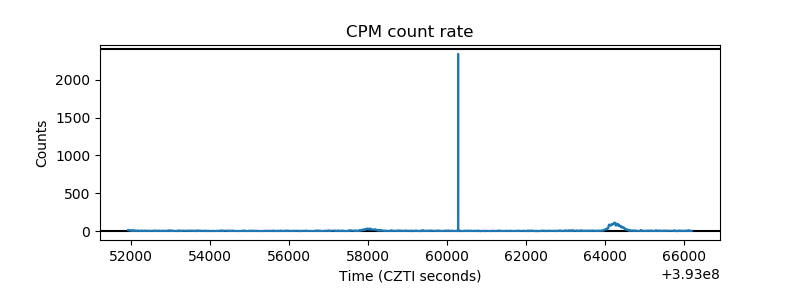 |
| CZT Counter | 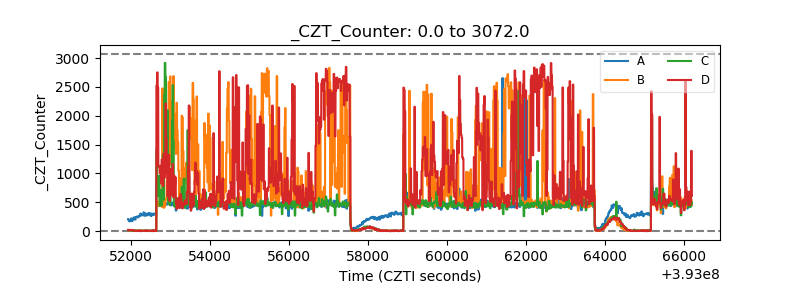 |
| +2.5 Volts monitor | 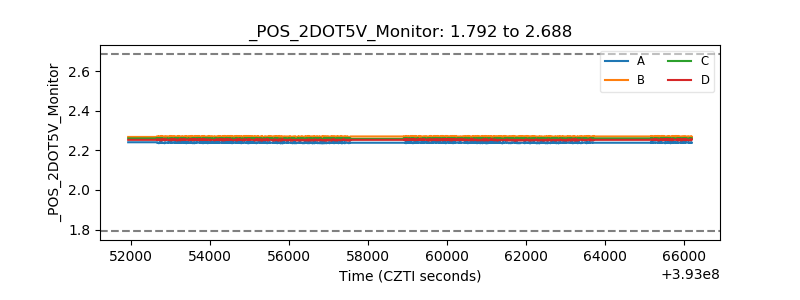 |
| +5 Volts monitor | 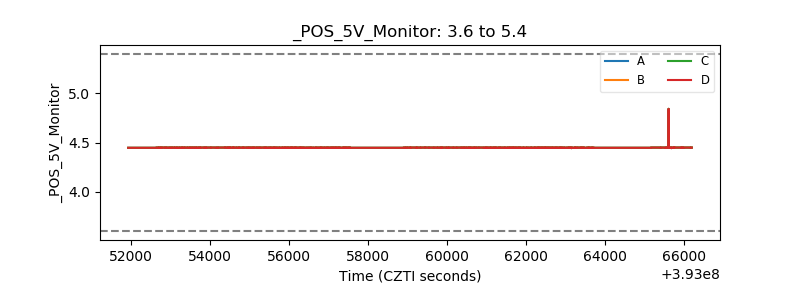 |
| _ROLL_ROT | 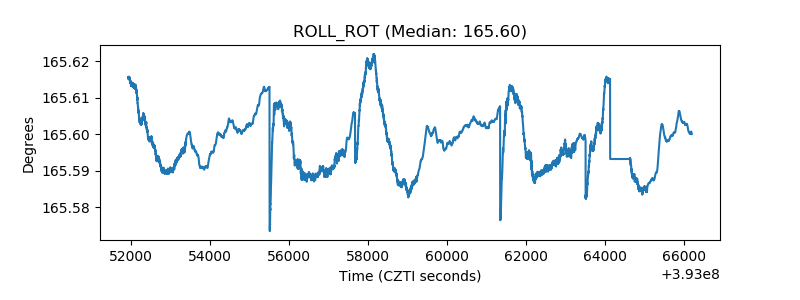 |
| _Roll_DEC | 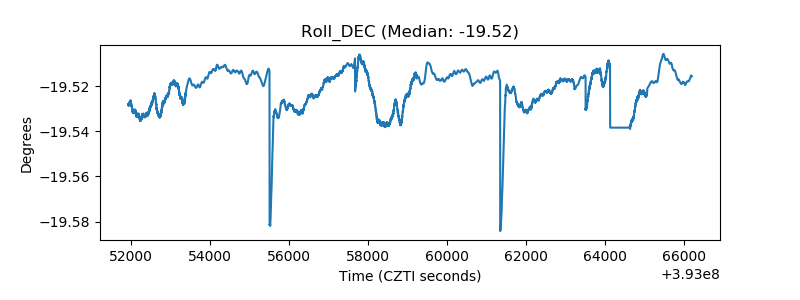 |
| _Roll_RA | 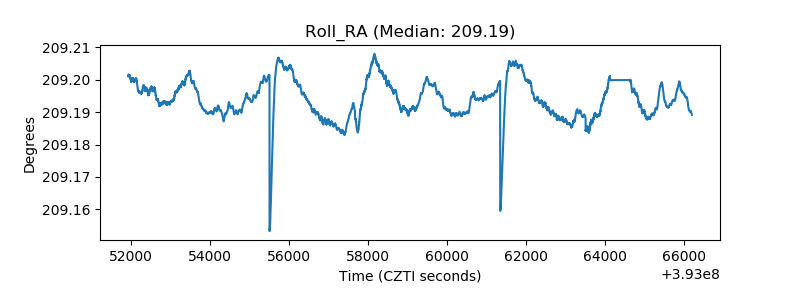 |
| Veto Counter | 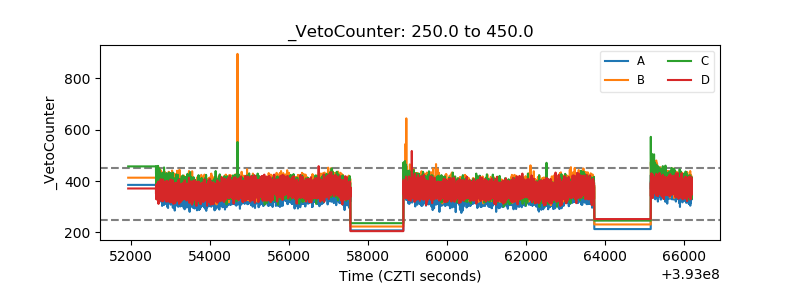 |