| Param | Original file | Final file |
|---|---|---|
| Filename | modeM0/AS1A11_089T02_9000005188_36310cztM0_level2.evt | modeM0/AS1A11_089T02_9000005188_36310cztM0_level2_quad_clean.evt |
| Size (bytes) | 787,763,520 | 59,728,320 |
| Size | 751.3 MB | 57.0 MB |
| Events in quadrant A | 2,934,692 | 404,579 |
| Events in quadrant B | 7,405,228 | 273,467 |
| Events in quadrant C | 4,018,288 | 380,007 |
| Events in quadrant D | 9,083,183 | 318,137 |
| Mode M9 | |||
|---|---|---|---|
| Quadrant | BADHDUFLAG | Total packets | Discarded packets |
| A | 0 | 27 | 0 |
| B | 0 | 27 | 0 |
| C | 0 | 27 | 0 |
| D | 0 | 27 | 0 |
| Mode M0 | |||
|---|---|---|---|
| Quadrant | BADHDUFLAG | Total packets | Discarded packets |
| A | 0 | 12645 | 3 |
| B | 0 | 26140 | 2 |
| C | 0 | 15765 | 2 |
| D | 0 | 31278 | 2 |
| Mode SS | |||
|---|---|---|---|
| Quadrant | BADHDUFLAG | Total packets | Discarded packets |
| A | 0 | 126 | 0 |
| B | 0 | 126 | 0 |
| C | 0 | 126 | 0 |
| D | 0 | 126 | 0 |
| Quadrant | Total seconds | Saturated seconds | Saturation percentage |
|---|---|---|---|
| A | 6173 | 8 | 0.129597% |
| B | 6173 | 1927 | 31.216588% |
| C | 6173 | 295 | 4.778876% |
| D | 6173 | 1818 | 29.450834% |
Noise dominated data is calculated using 1-second bins in cleaned event files. If a bin has >2000 counts, and if more than 50% of those come from <1% of pixels, then it is considered to be noise-dominated and hence unusable.
| Quadrant | # 1 sec bins | Bins with >0 counts | Bins with >2000 counts | High rate bins dominated by noise | Noise dominated (total time) | Noise dominated (detector-on time) | Marked lightcurve |
|---|---|---|---|---|---|---|---|
| A | 8799 | 6175 | 0 | 0 | 0.00% | 0.00% | 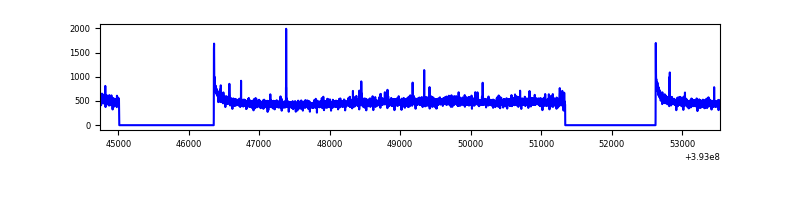 |
| B | 8799 | 6175 | 1753 | 1753 | 19.92% | 28.39% | 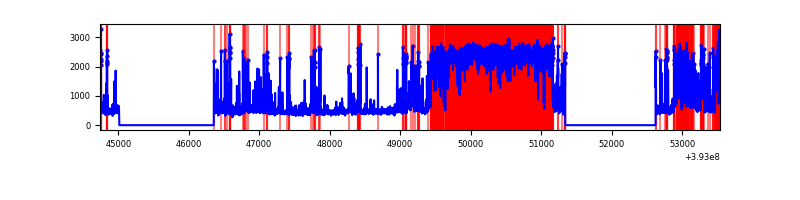 |
| C | 8799 | 6175 | 284 | 284 | 3.23% | 4.60% | 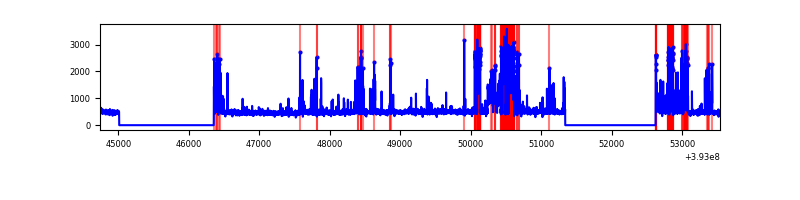 |
| D | 8799 | 6174 | 1865 | 1865 | 21.20% | 30.21% | 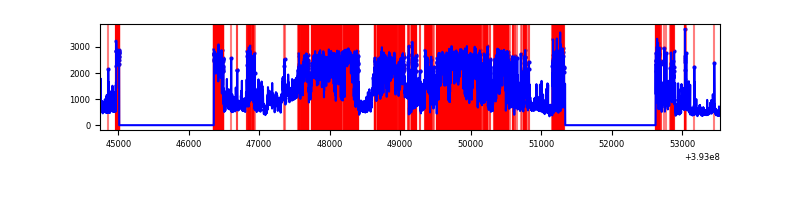 |
Top three noisy pixels from each quadrant. If the there are fewer than three noisy pixels in the level2.evt file, extra rows are filled as -1
| Pixel properties | Quadrant properties | ||||||
|---|---|---|---|---|---|---|---|
| Quadrant | DetID | PixID | Counts | Sigma | Mean | Median | Sigma |
| A | 10 | 83 | 193580 | 1368.72 | 696 | 681 | 140.9 |
| A | 9 | 143 | 20565 | 141.09 | 696 | 681 | 140.9 |
| A | 13 | 6 | 11991 | 80.25 | 696 | 681 | 140.9 |
| B | 5 | 172 | 3579594 | 31644.98 | 578 | 563 | 113.1 |
| B | 4 | 171 | 1082241 | 9563.95 | 578 | 563 | 113.1 |
| B | 5 | 236 | 329677 | 2909.95 | 578 | 563 | 113.1 |
| C | 0 | 207 | 810621 | 5271.68 | 658 | 662 | 153.6 |
| C | 0 | 10 | 375522 | 2439.8 | 658 | 662 | 153.6 |
| C | 15 | 214 | 257026 | 1668.56 | 658 | 662 | 153.6 |
| D | 12 | 227 | 5032088 | 33853.42 | 603 | 585 | 148.6 |
| D | 12 | 6 | 842822 | 5666.82 | 603 | 585 | 148.6 |
| D | 12 | 235 | 512551 | 3444.66 | 603 | 585 | 148.6 |
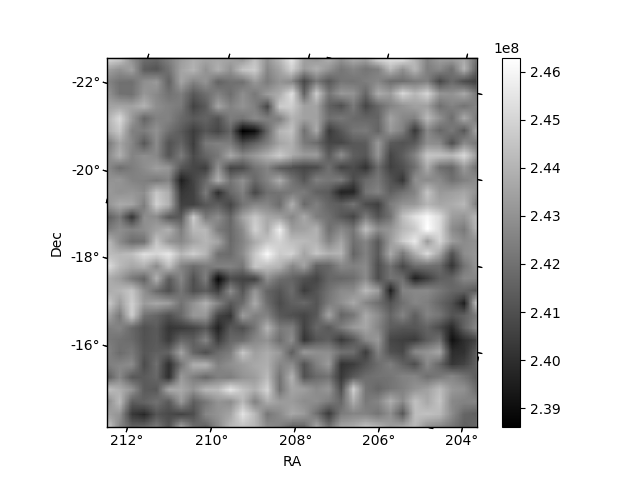
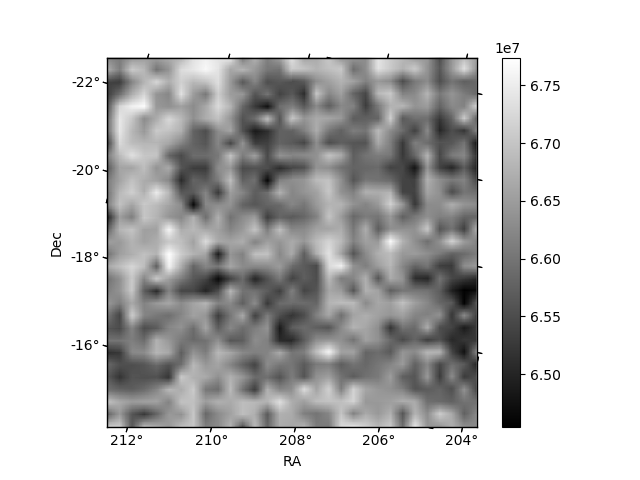
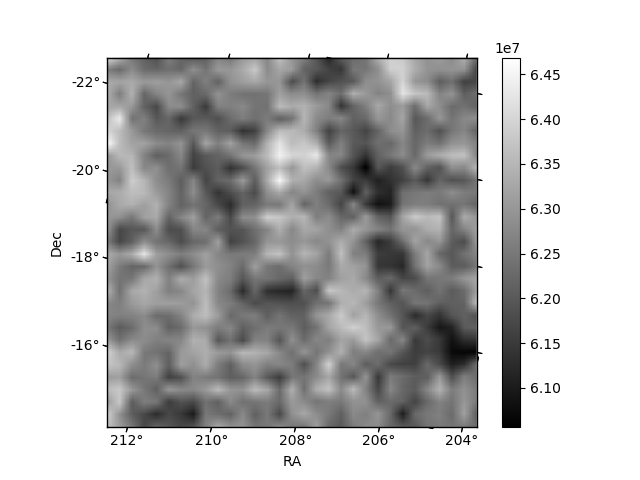
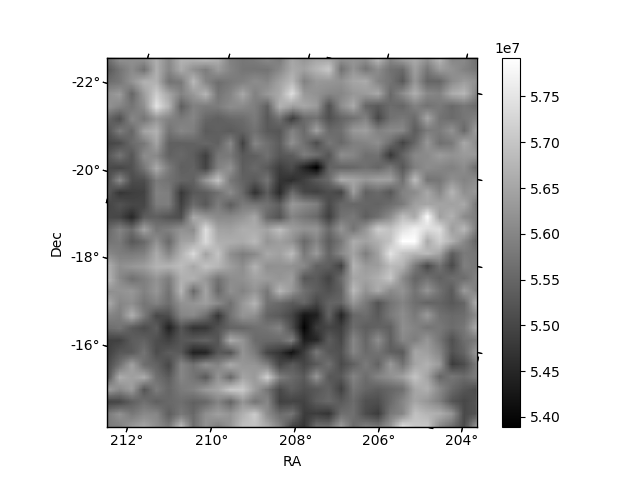
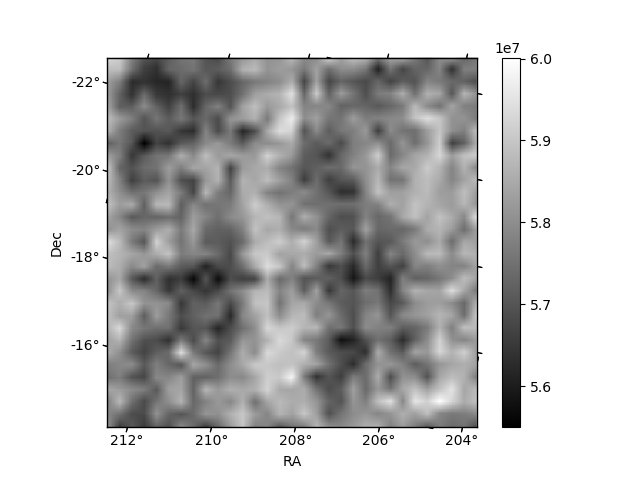
Histogram calculated using DETX and DETY for each event in the final _common_clean file
| Quadrant A | 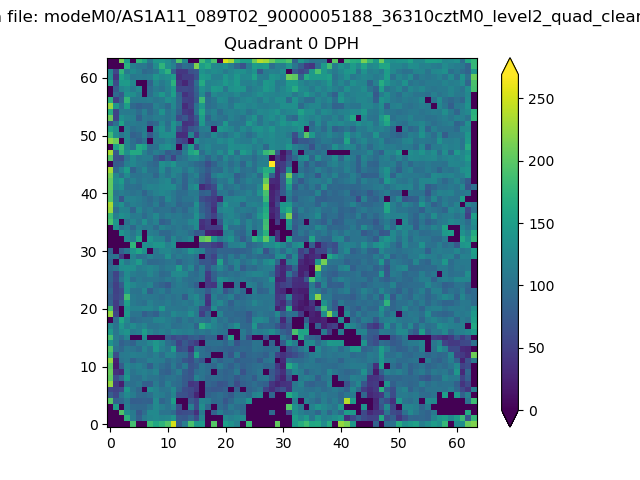 |
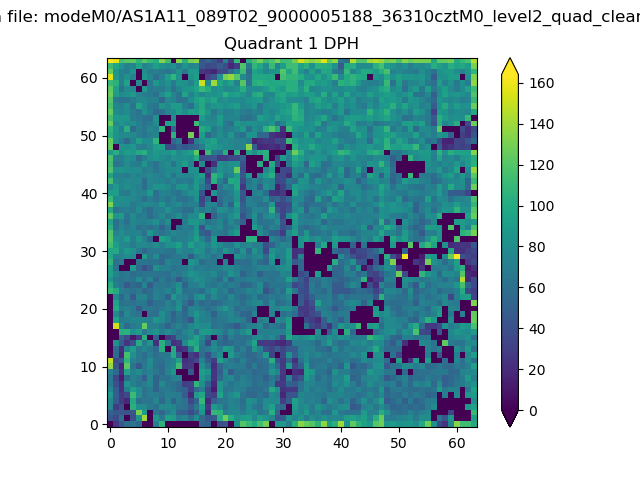 |
Quadrant B |
|---|---|---|---|
| Quadrant D | 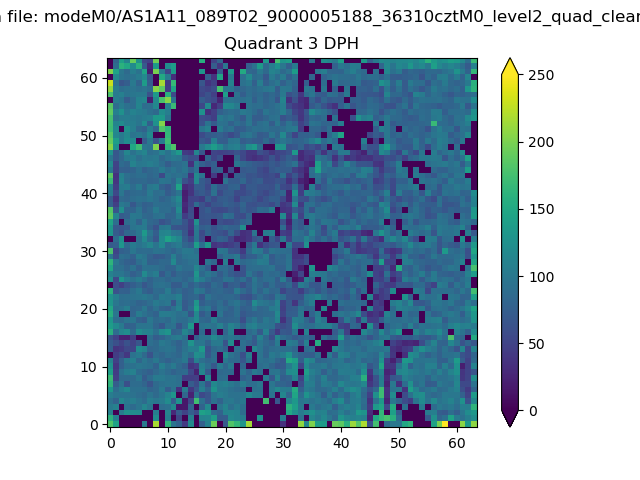 |
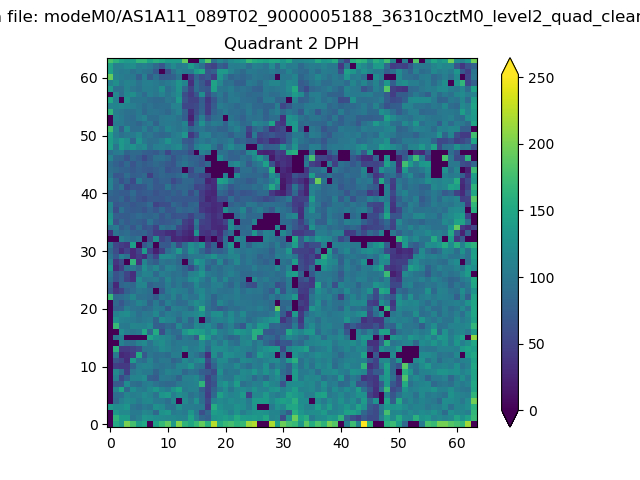 |
Quadrant C |
| Plot type | Count rate plots | Images |
|---|---|---|
| Comparison with Poisson distribution Blue bars denote a histogram of data divided into 1 sec bins. Red curve is a Poisson curve with rate = median count rate of data. |
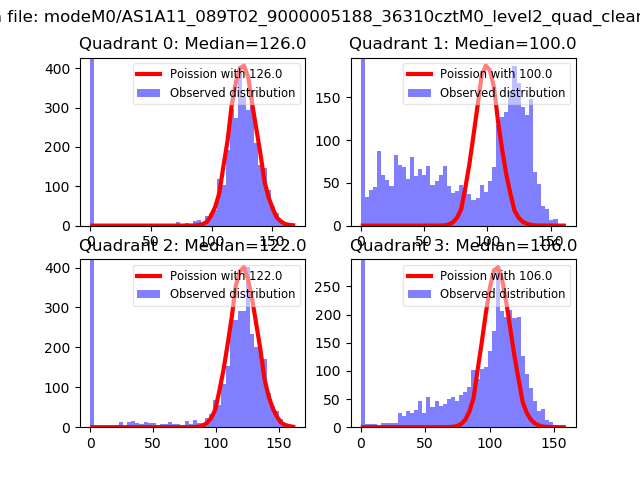 |
 |
| Quadrant-wise count rates Data is divided into 100 sec bins |
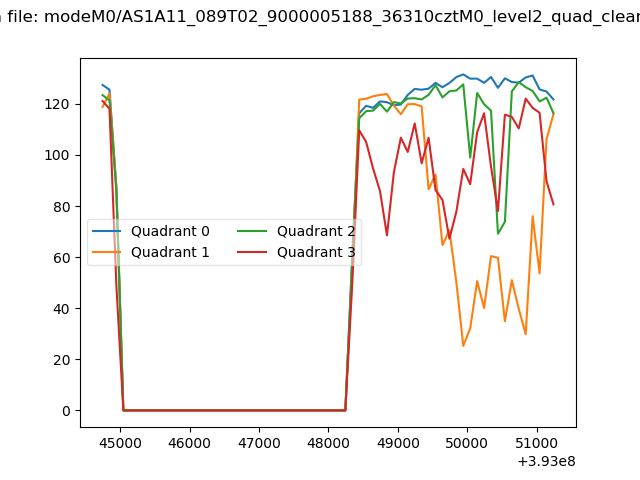 |
|
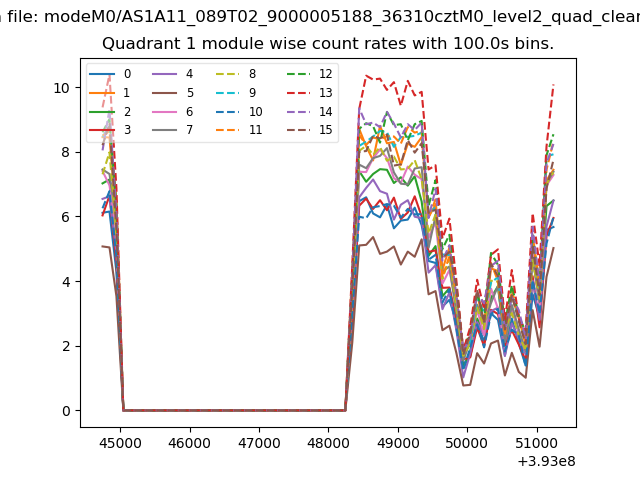
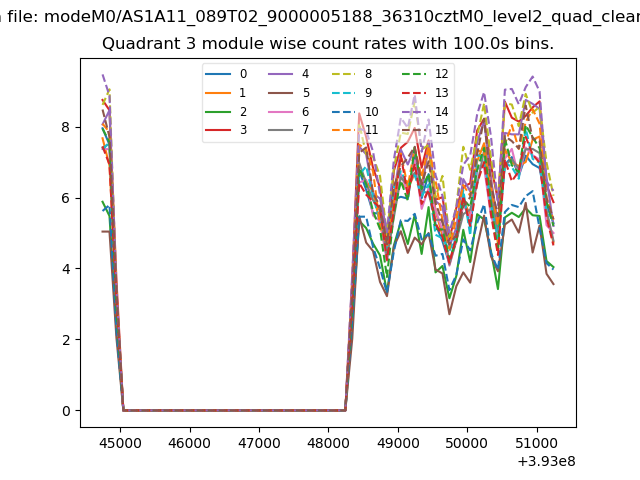
| Module-wise count rates for Quadrant A Data is divided into 100 sec bins |
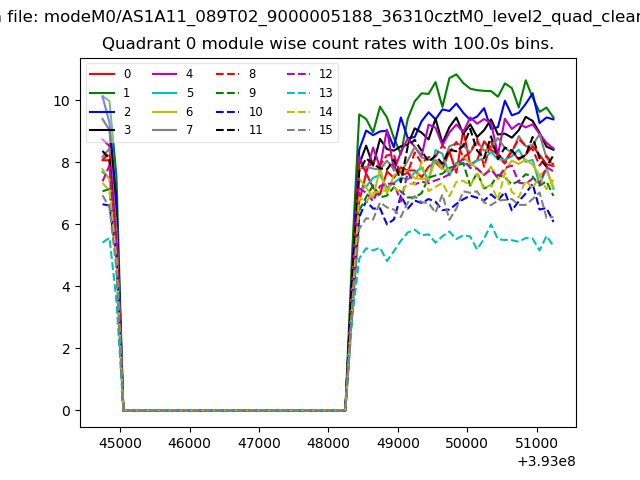 |
 |
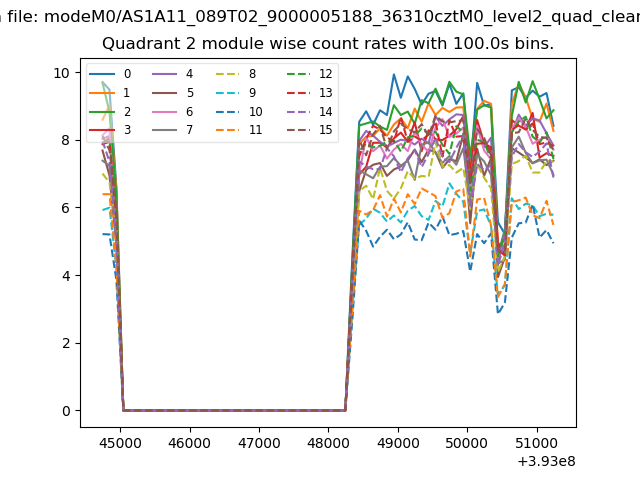
| Module-wise count rates for Quadrant B Data is divided into 100 sec bins |
 |
 |
| Module-wise count rates for Quadrant C Data is divided into 100 sec bins |
 |
 |
| Module-wise count rates for Quadrant D Data is divided into 100 sec bins |
 |
 |
| Parameter | Plot |
|---|---|
| CZT HV Monitor | 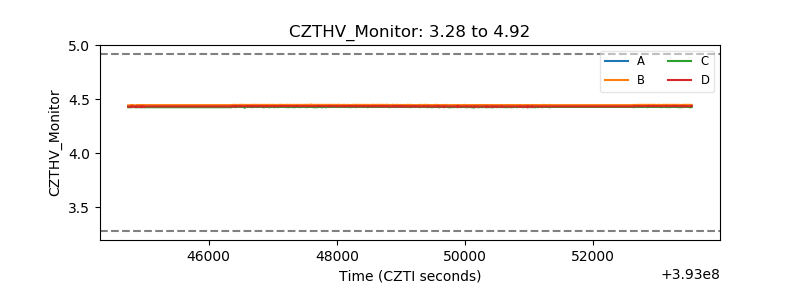 |
| D_VDD | 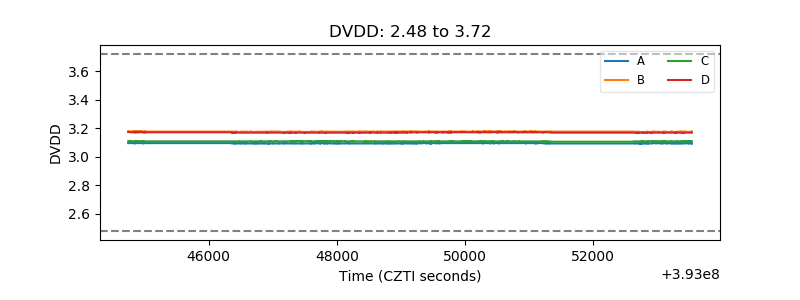 |
| Temperature 1 | 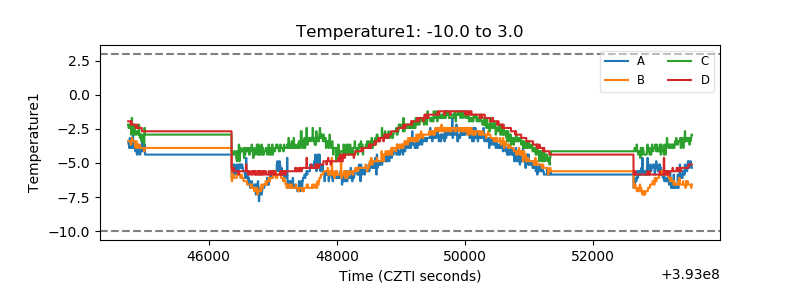 |
| Veto HV Monitor | 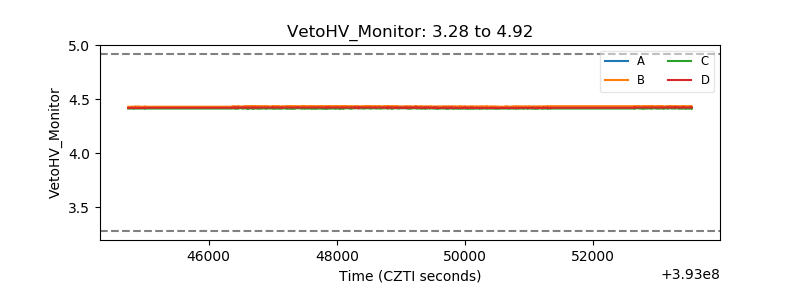 |
| Veto LLD | 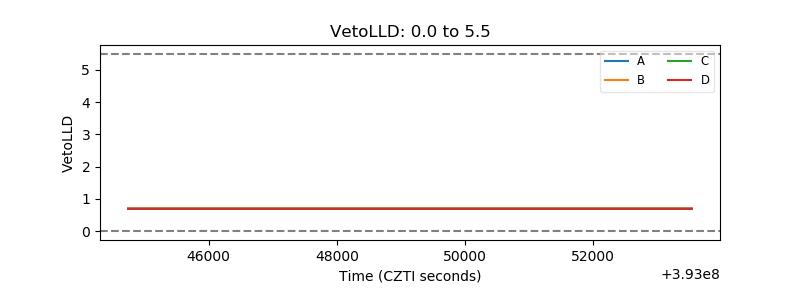 |
| Alpha Counter | 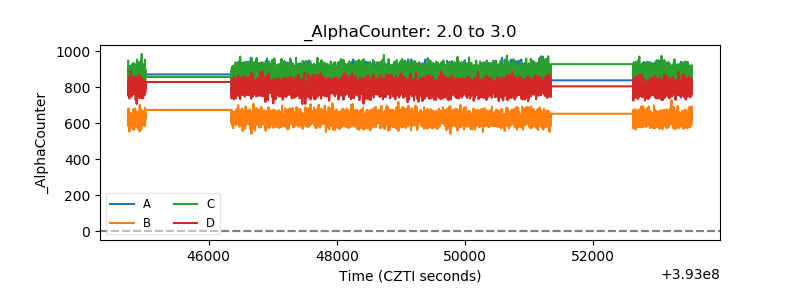 |
| _CPM_Rate | 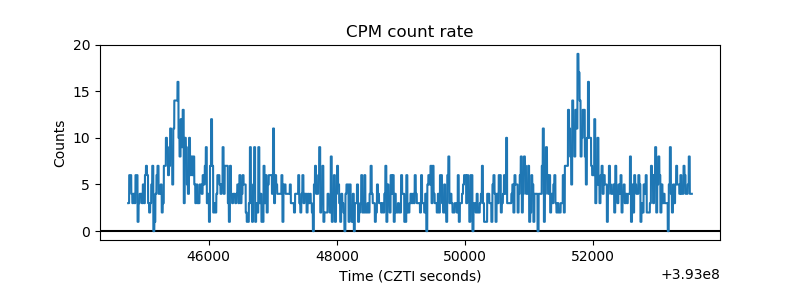 |
| CZT Counter | 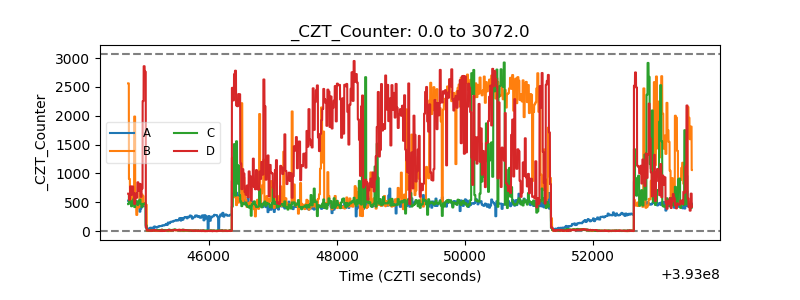 |
| +2.5 Volts monitor | 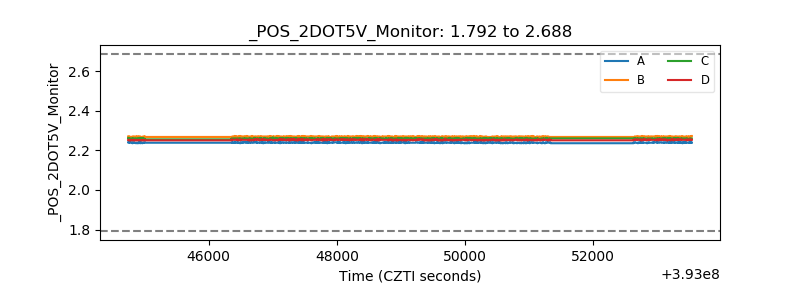 |
| +5 Volts monitor | 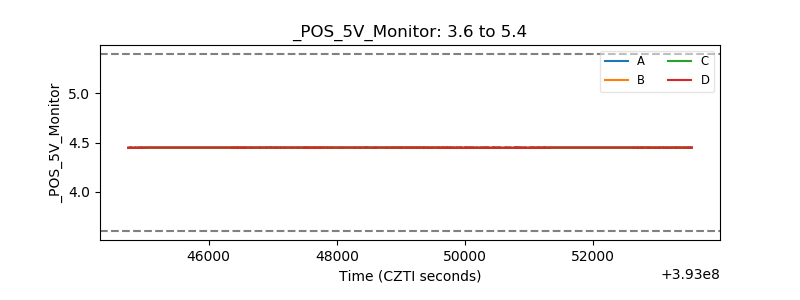 |
| _ROLL_ROT | 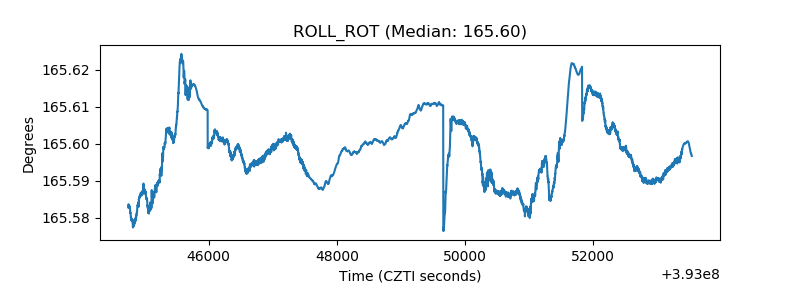 |
| _Roll_DEC | 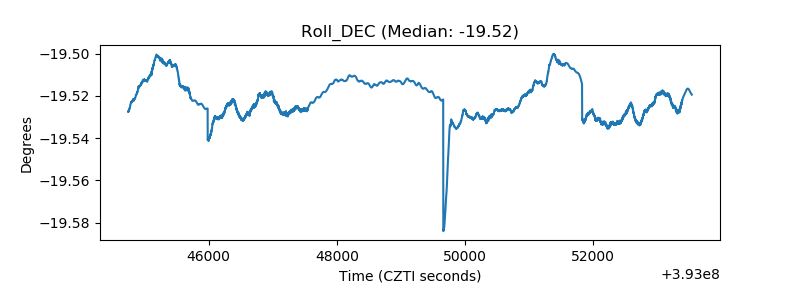 |
| _Roll_RA | 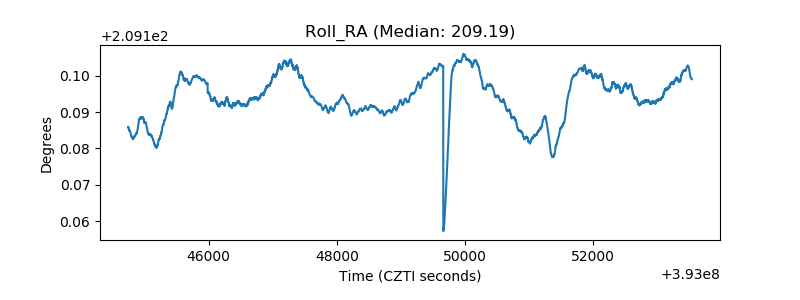 |
| Veto Counter | 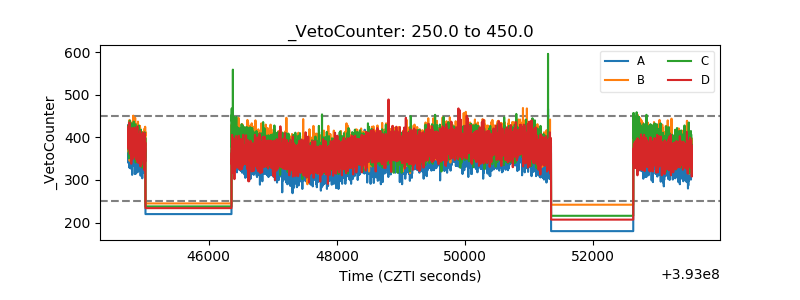 |