| Param | Original file | Final file |
|---|---|---|
| Filename | modeM0/AS1A11_089T02_9000005188_36301cztM0_level2.evt | modeM0/AS1A11_089T02_9000005188_36301cztM0_level2_quad_clean.evt |
| Size (bytes) | 487,486,080 | 89,677,440 |
| Size | 464.9 MB | 85.5 MB |
| Events in quadrant A | 2,884,190 | 607,777 |
| Events in quadrant B | 4,966,458 | 565,879 |
| Events in quadrant C | 3,106,849 | 586,990 |
| Events in quadrant D | 3,426,629 | 563,802 |
| Mode M9 | |||
|---|---|---|---|
| Quadrant | BADHDUFLAG | Total packets | Discarded packets |
| A | 0 | 17 | 0 |
| B | 0 | 17 | 0 |
| C | 0 | 17 | 0 |
| D | 0 | 17 | 0 |
| Mode M0 | |||
|---|---|---|---|
| Quadrant | BADHDUFLAG | Total packets | Discarded packets |
| A | 0 | 12125 | 3 |
| B | 0 | 18355 | 2 |
| C | 0 | 12656 | 2 |
| D | 0 | 13954 | 2 |
| Mode SS | |||
|---|---|---|---|
| Quadrant | BADHDUFLAG | Total packets | Discarded packets |
| A | 0 | 114 | 0 |
| B | 0 | 114 | 0 |
| C | 0 | 114 | 0 |
| D | 0 | 114 | 0 |
| Quadrant | Total seconds | Saturated seconds | Saturation percentage |
|---|---|---|---|
| A | 5587 | 26 | 0.465366% |
| B | 5587 | 702 | 12.564883% |
| C | 5587 | 69 | 1.235010% |
| D | 5588 | 141 | 2.523264% |
Noise dominated data is calculated using 1-second bins in cleaned event files. If a bin has >2000 counts, and if more than 50% of those come from <1% of pixels, then it is considered to be noise-dominated and hence unusable.
| Quadrant | # 1 sec bins | Bins with >0 counts | Bins with >2000 counts | High rate bins dominated by noise | Noise dominated (total time) | Noise dominated (detector-on time) | Marked lightcurve |
|---|---|---|---|---|---|---|---|
| A | 7290 | 5588 | 6 | 6 | 0.08% | 0.11% | 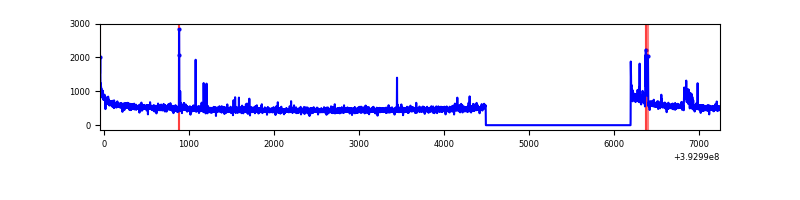 |
| B | 7290 | 5588 | 582 | 582 | 7.98% | 10.42% | 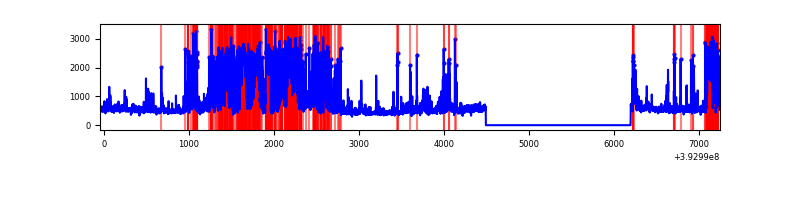 |
| C | 7290 | 5588 | 47 | 47 | 0.64% | 0.84% | 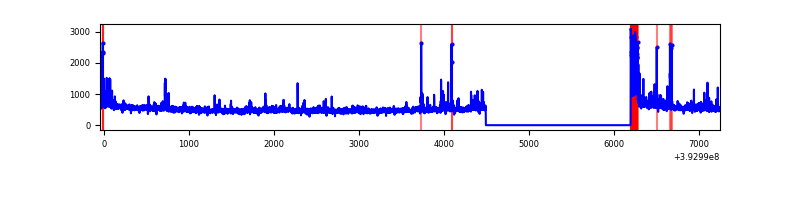 |
| D | 7291 | 5589 | 132 | 132 | 1.81% | 2.36% | 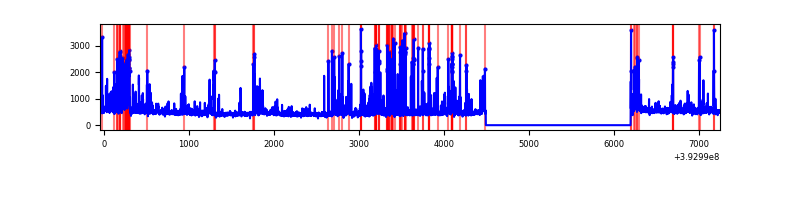 |
Top three noisy pixels from each quadrant. If the there are fewer than three noisy pixels in the level2.evt file, extra rows are filled as -1
| Pixel properties | Quadrant properties | ||||||
|---|---|---|---|---|---|---|---|
| Quadrant | DetID | PixID | Counts | Sigma | Mean | Median | Sigma |
| A | 10 | 83 | 194617 | 1443.73 | 664 | 652 | 134.4 |
| A | 15 | 223 | 74266 | 547.92 | 664 | 652 | 134.4 |
| A | 9 | 143 | 20695 | 149.18 | 664 | 652 | 134.4 |
| B | 5 | 172 | 1326538 | 11087.84 | 622 | 606 | 119.6 |
| B | 4 | 171 | 415070 | 3465.87 | 622 | 606 | 119.6 |
| B | 5 | 236 | 346074 | 2888.9 | 622 | 606 | 119.6 |
| C | 15 | 214 | 236740 | 1606.95 | 632 | 636 | 146.9 |
| C | 0 | 10 | 189126 | 1282.88 | 632 | 636 | 146.9 |
| C | 0 | 207 | 158732 | 1076.02 | 632 | 636 | 146.9 |
| D | 12 | 6 | 498298 | 3151.53 | 638 | 618 | 157.9 |
| D | 7 | 223 | 108359 | 682.26 | 638 | 618 | 157.9 |
| D | 2 | 250 | 90954 | 572.05 | 638 | 618 | 157.9 |
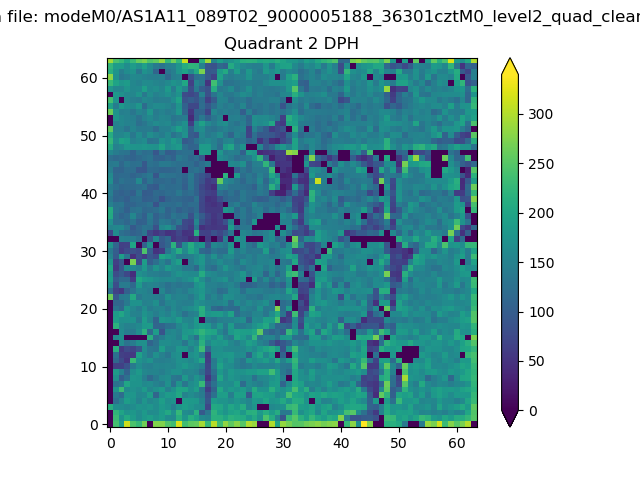
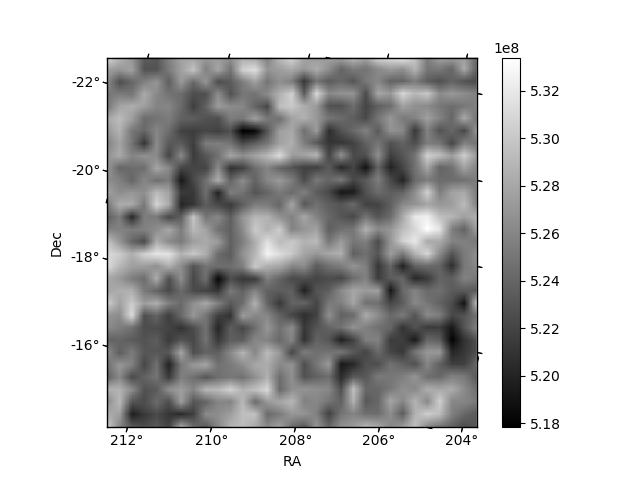
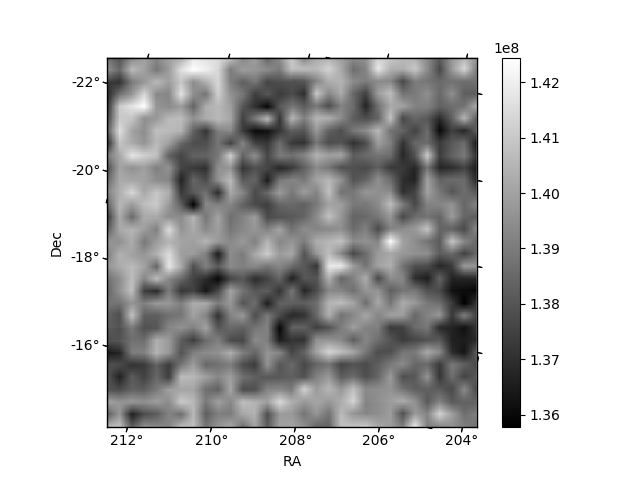
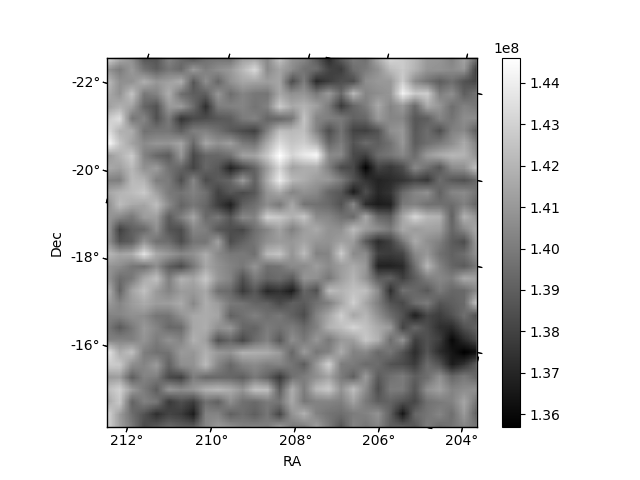
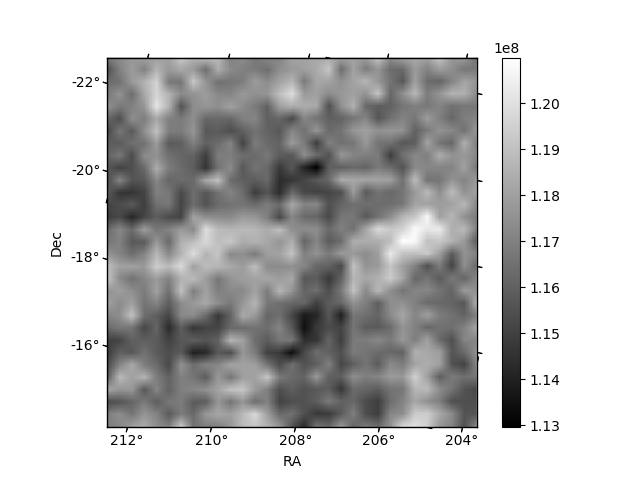
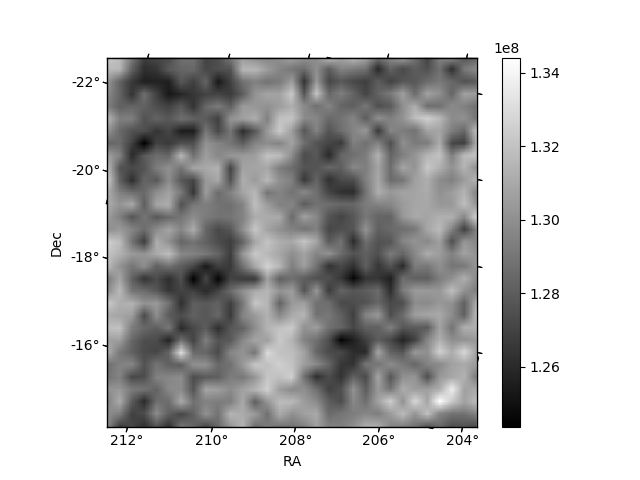
Histogram calculated using DETX and DETY for each event in the final _common_clean file
| Quadrant A | 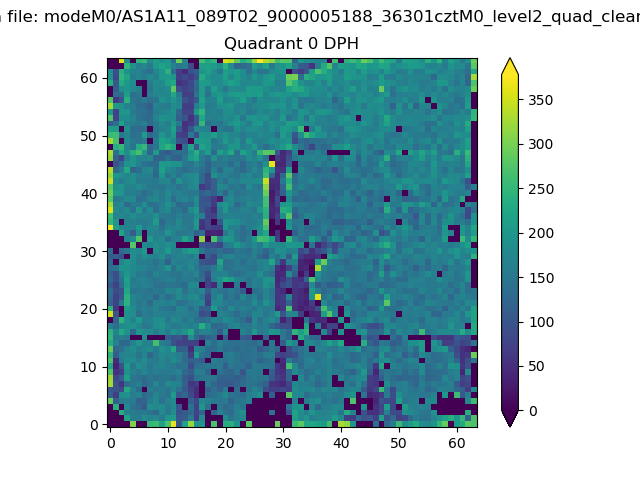 |
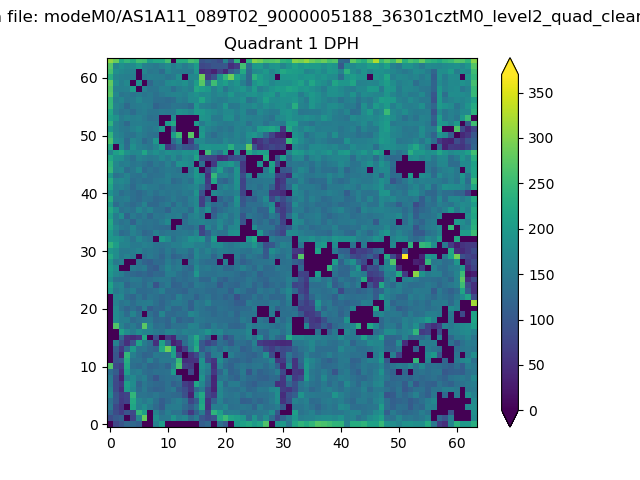 |
Quadrant B |
|---|---|---|---|
| Quadrant D | 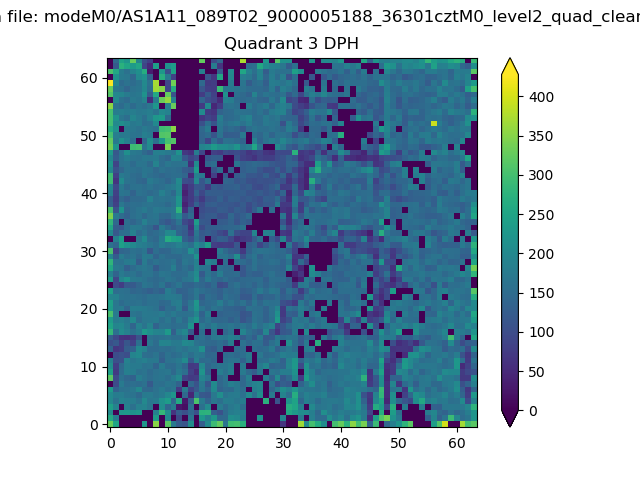 |
 |
Quadrant C |
| Plot type | Count rate plots | Images |
|---|---|---|
| Comparison with Poisson distribution Blue bars denote a histogram of data divided into 1 sec bins. Red curve is a Poisson curve with rate = median count rate of data. |
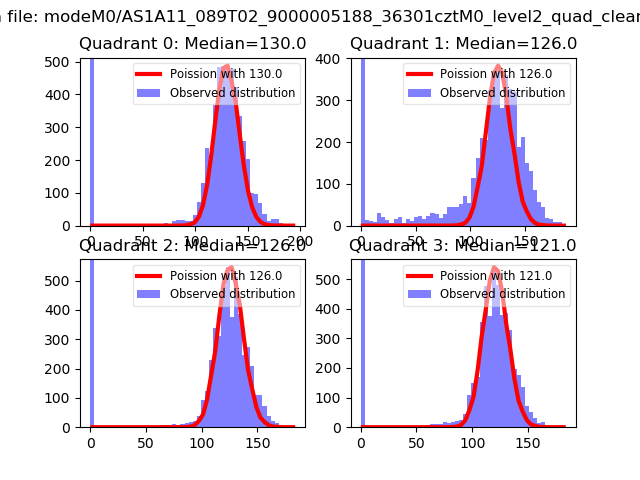 |
 |
| Quadrant-wise count rates Data is divided into 100 sec bins |
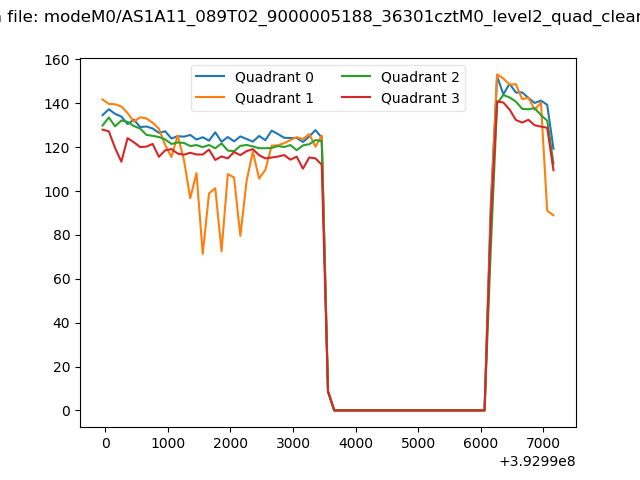 |
|
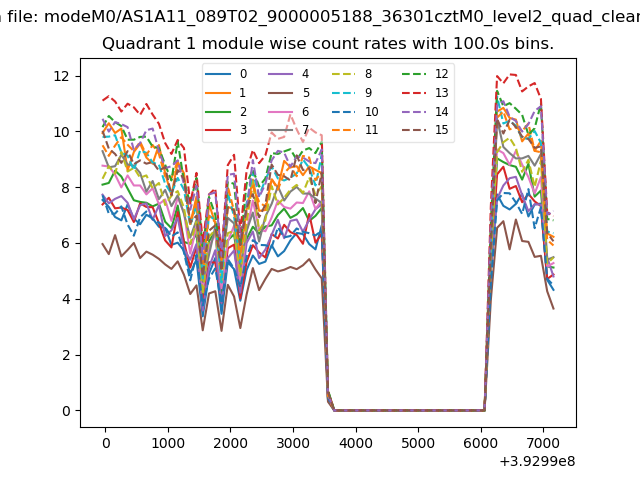
| Module-wise count rates for Quadrant A Data is divided into 100 sec bins |
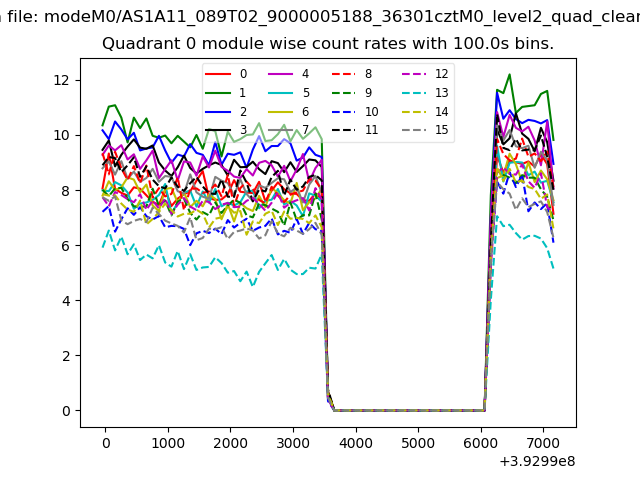 |
 |
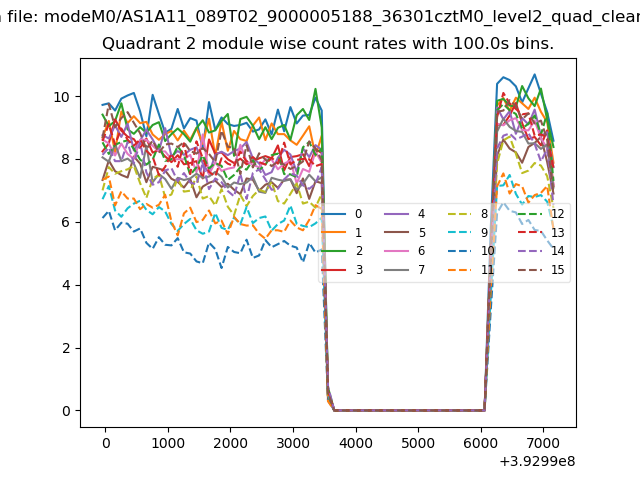
| Module-wise count rates for Quadrant B Data is divided into 100 sec bins |
 |
 |
| Module-wise count rates for Quadrant C Data is divided into 100 sec bins |
 |
 |
| Module-wise count rates for Quadrant D Data is divided into 100 sec bins |
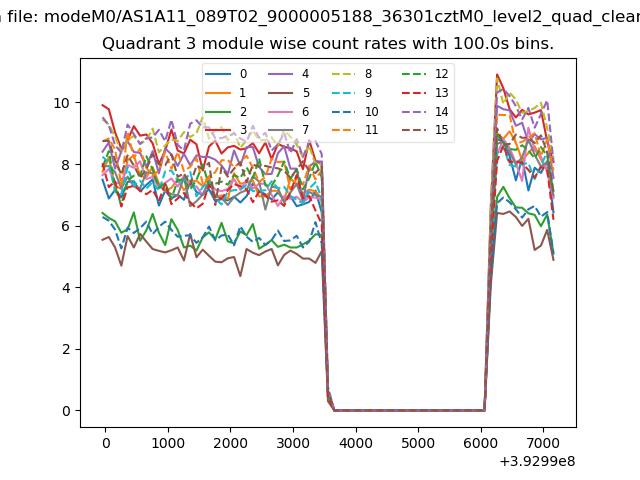 |
 |
| Parameter | Plot |
|---|---|
| CZT HV Monitor | 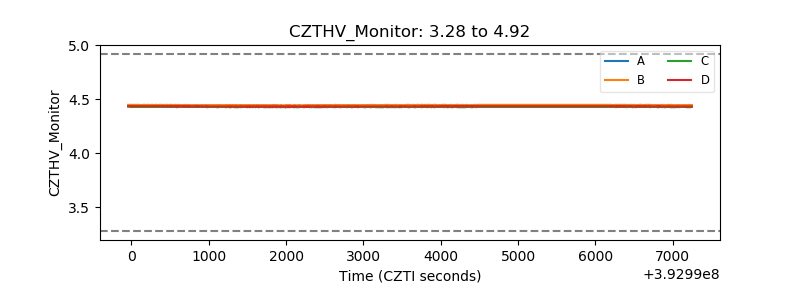 |
| D_VDD | 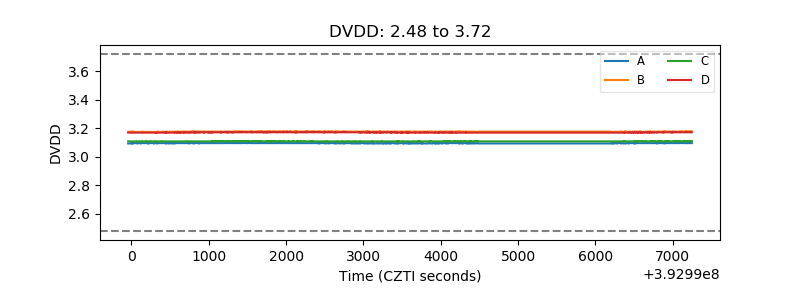 |
| Temperature 1 | 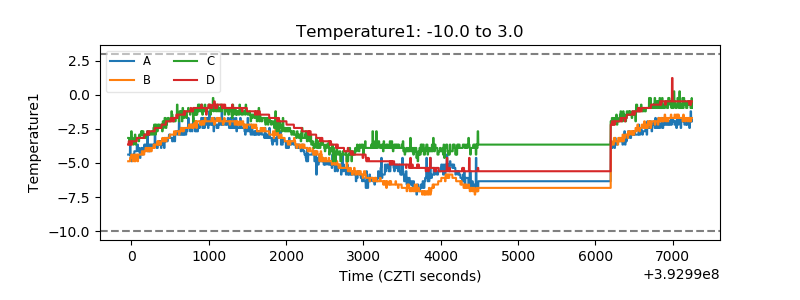 |
| Veto HV Monitor | 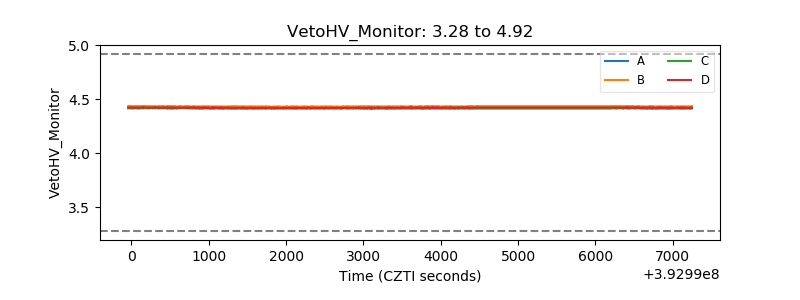 |
| Veto LLD | 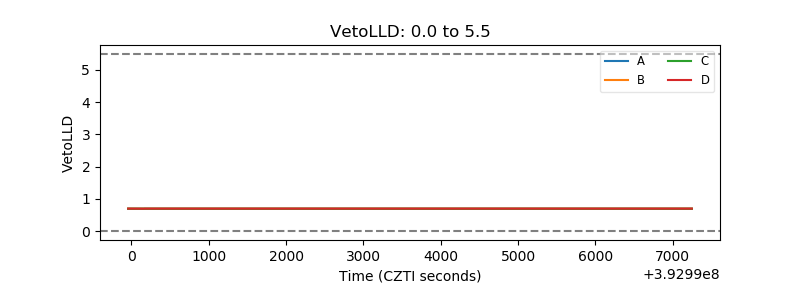 |
| Alpha Counter | 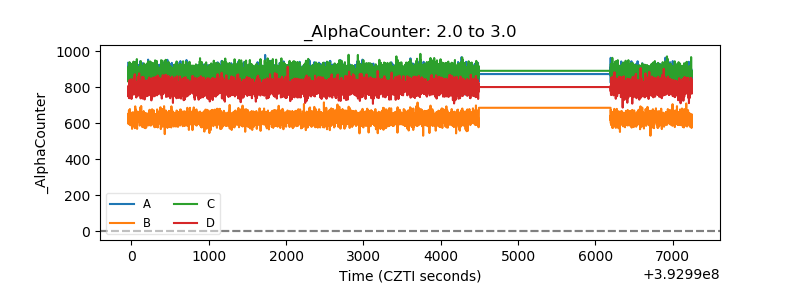 |
| _CPM_Rate | 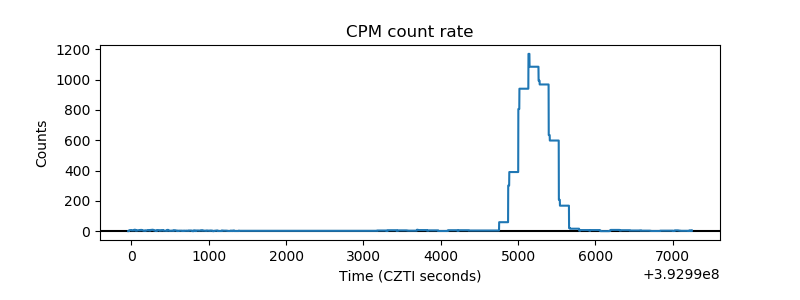 |
| CZT Counter | 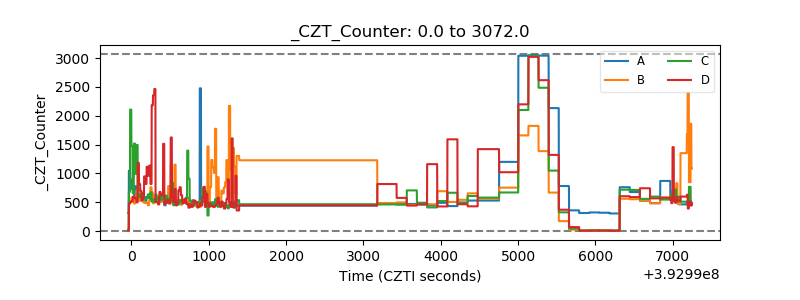 |
| +2.5 Volts monitor | 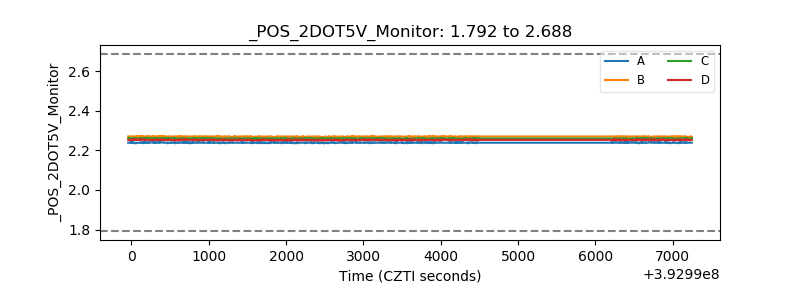 |
| +5 Volts monitor | 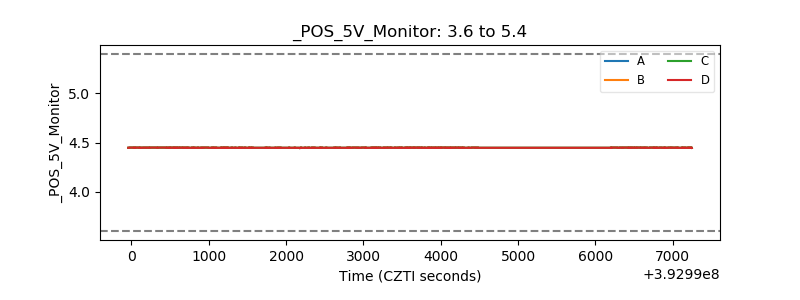 |
| _ROLL_ROT | 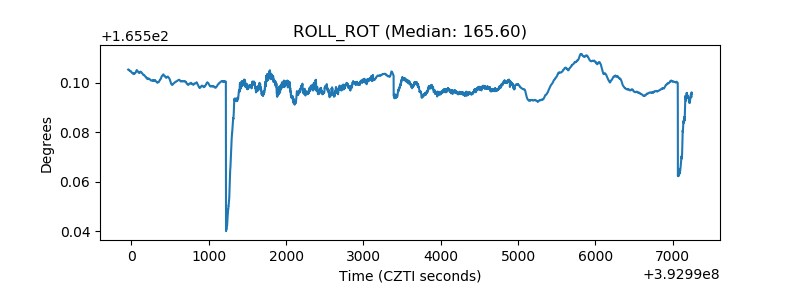 |
| _Roll_DEC | 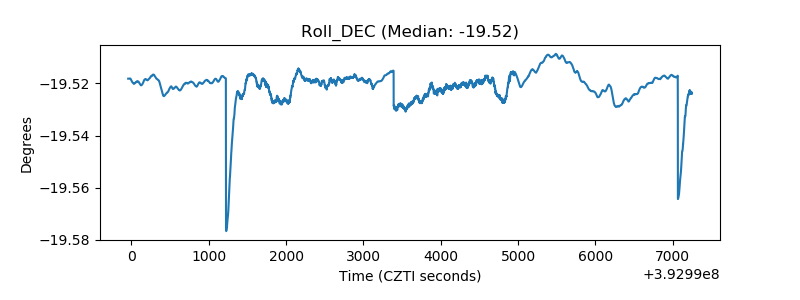 |
| _Roll_RA | 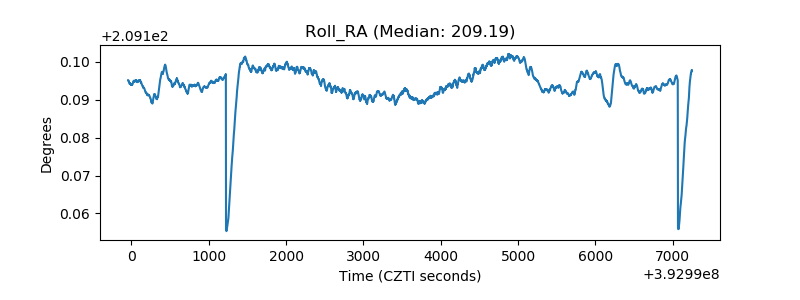 |
| Veto Counter | 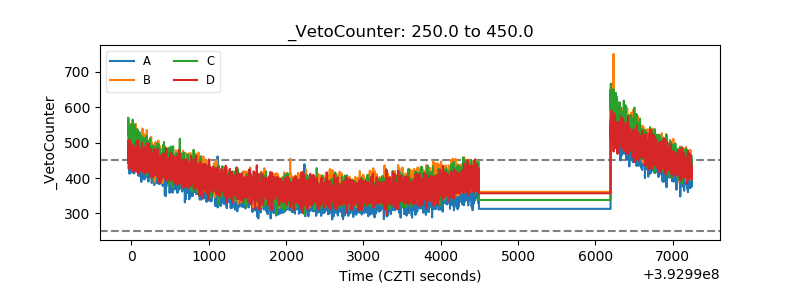 |