| Param | Original file | Final file |
|---|---|---|
| Filename | modeM0/AS1A11_089T02_9000005188_36298cztM0_level2.evt | modeM0/AS1A11_089T02_9000005188_36298cztM0_level2_quad_clean.evt |
| Size (bytes) | 193,757,760 | 22,034,880 |
| Size | 184.8 MB | 21.0 MB |
| Events in quadrant A | 970,367 | 142,941 |
| Events in quadrant B | 955,209 | 145,770 |
| Events in quadrant C | 1,069,536 | 141,003 |
| Events in quadrant D | 2,742,206 | 98,967 |
| Mode M9 | |||
|---|---|---|---|
| Quadrant | BADHDUFLAG | Total packets | Discarded packets |
| A | 0 | 15 | 0 |
| B | 0 | 15 | 0 |
| C | 0 | 15 | 0 |
| D | 0 | 15 | 0 |
| Mode M0 | |||
|---|---|---|---|
| Quadrant | BADHDUFLAG | Total packets | Discarded packets |
| A | 0 | 4003 | 2 |
| B | 0 | 3953 | 1 |
| C | 0 | 4220 | 1 |
| D | 0 | 9381 | 1 |
| Mode SS | |||
|---|---|---|---|
| Quadrant | BADHDUFLAG | Total packets | Discarded packets |
| A | 0 | 40 | 0 |
| B | 0 | 40 | 0 |
| C | 0 | 40 | 0 |
| D | 0 | 40 | 0 |
| Quadrant | Total seconds | Saturated seconds | Saturation percentage |
|---|---|---|---|
| A | 1888 | 7 | 0.370763% |
| B | 1888 | 4 | 0.211864% |
| C | 1888 | 33 | 1.747881% |
| D | 1888 | 637 | 33.739407% |
Noise dominated data is calculated using 1-second bins in cleaned event files. If a bin has >2000 counts, and if more than 50% of those come from <1% of pixels, then it is considered to be noise-dominated and hence unusable.
| Quadrant | # 1 sec bins | Bins with >0 counts | Bins with >2000 counts | High rate bins dominated by noise | Noise dominated (total time) | Noise dominated (detector-on time) | Marked lightcurve |
|---|---|---|---|---|---|---|---|
| A | 3381 | 1889 | 0 | 0 | 0.00% | 0.00% | 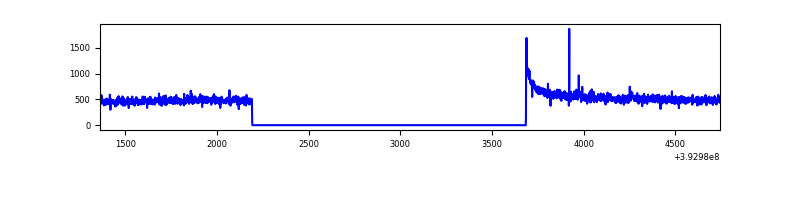 |
| B | 3381 | 1889 | 1 | 1 | 0.03% | 0.05% | 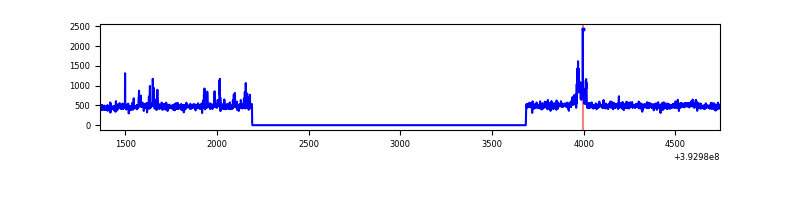 |
| C | 3381 | 1889 | 26 | 26 | 0.77% | 1.38% | 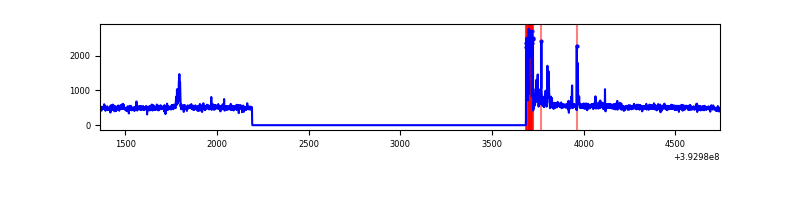 |
| D | 3381 | 1889 | 621 | 621 | 18.37% | 32.87% | 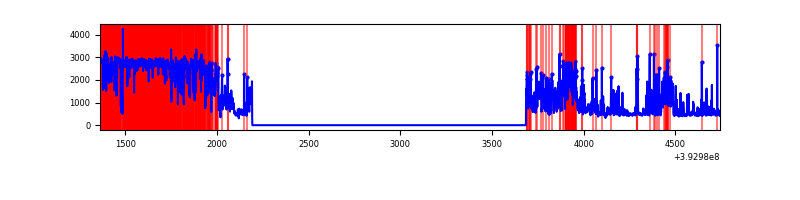 |
Top three noisy pixels from each quadrant. If the there are fewer than three noisy pixels in the level2.evt file, extra rows are filled as -1
| Pixel properties | Quadrant properties | ||||||
|---|---|---|---|---|---|---|---|
| Quadrant | DetID | PixID | Counts | Sigma | Mean | Median | Sigma |
| A | 10 | 83 | 76399 | 1588.37 | 228 | 224 | 48.0 |
| A | 9 | 143 | 4813 | 95.69 | 228 | 224 | 48.0 |
| A | 12 | 189 | 4304 | 85.07 | 228 | 224 | 48.0 |
| B | 8 | 128 | 39504 | 858.21 | 226 | 220 | 45.8 |
| B | 5 | 172 | 11890 | 254.95 | 226 | 220 | 45.8 |
| B | 12 | 111 | 5747 | 120.75 | 226 | 220 | 45.8 |
| C | 0 | 10 | 100721 | 1873.33 | 220 | 222 | 53.6 |
| C | 15 | 214 | 82938 | 1541.85 | 220 | 222 | 53.6 |
| C | 0 | 207 | 19099 | 351.87 | 220 | 222 | 53.6 |
| D | 12 | 227 | 1659918 | 34552.93 | 188 | 182 | 48.0 |
| D | 12 | 6 | 208409 | 4334.94 | 188 | 182 | 48.0 |
| D | 2 | 250 | 64315 | 1335.14 | 188 | 182 | 48.0 |
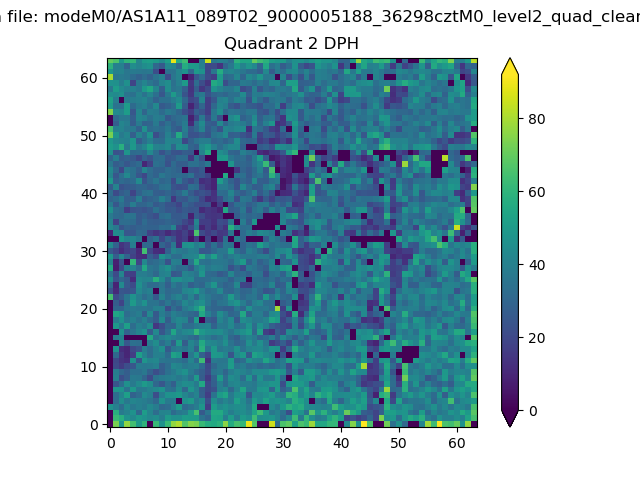
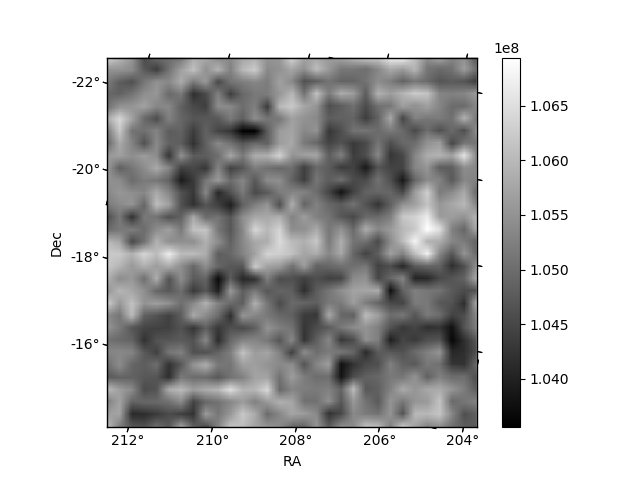
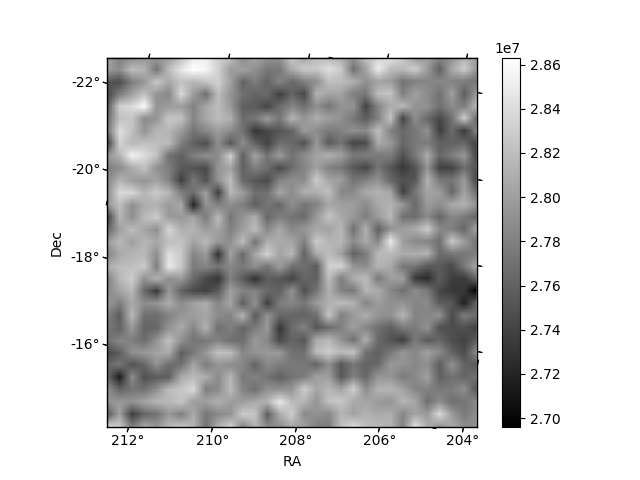
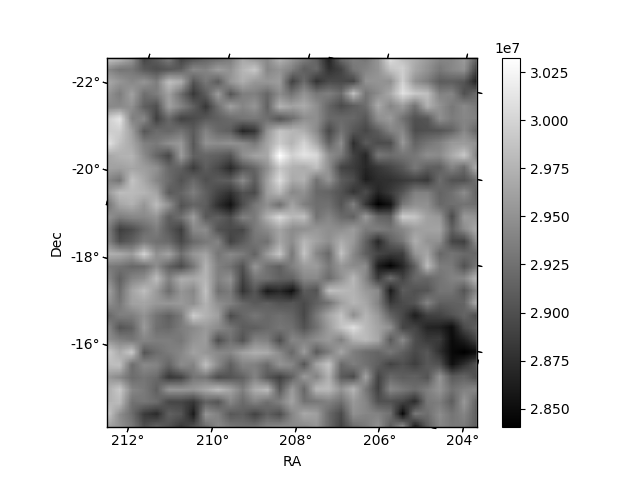
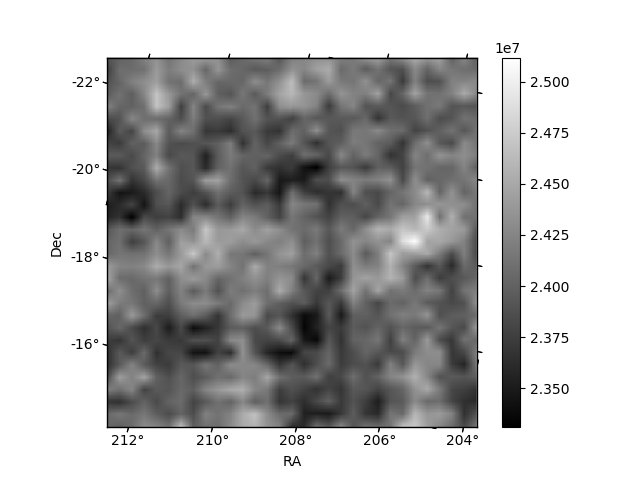
Histogram calculated using DETX and DETY for each event in the final _common_clean file
| Quadrant A | 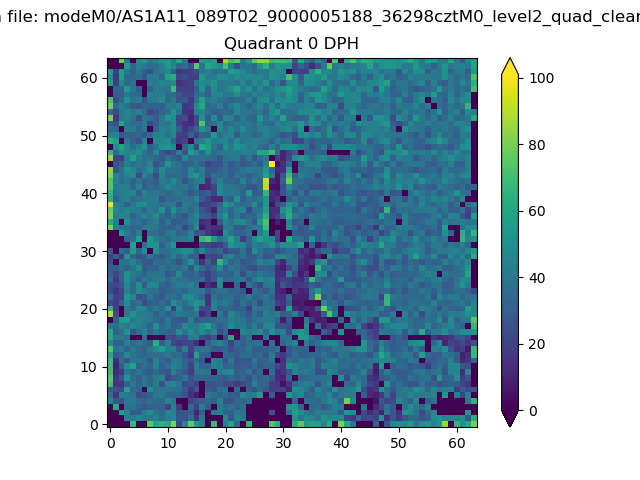 |
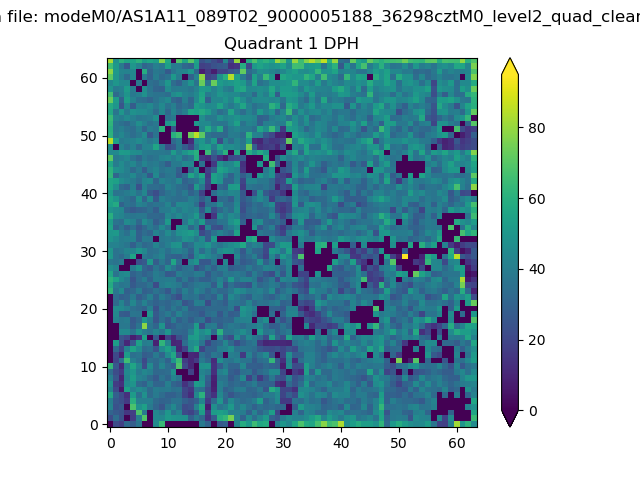 |
Quadrant B |
|---|---|---|---|
| Quadrant D | 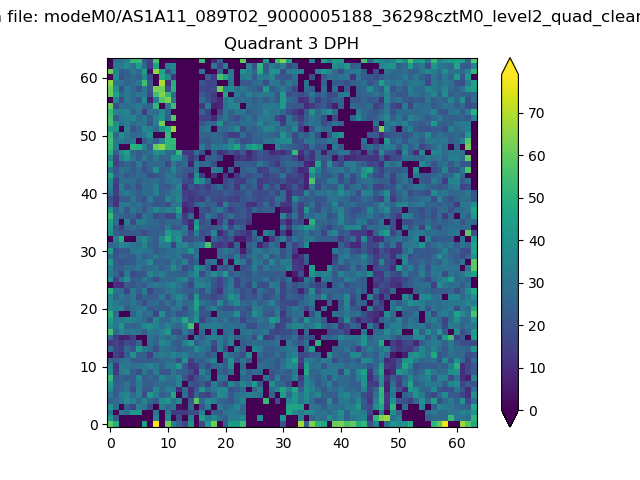 |
 |
Quadrant C |
| Plot type | Count rate plots | Images |
|---|---|---|
| Comparison with Poisson distribution Blue bars denote a histogram of data divided into 1 sec bins. Red curve is a Poisson curve with rate = median count rate of data. |
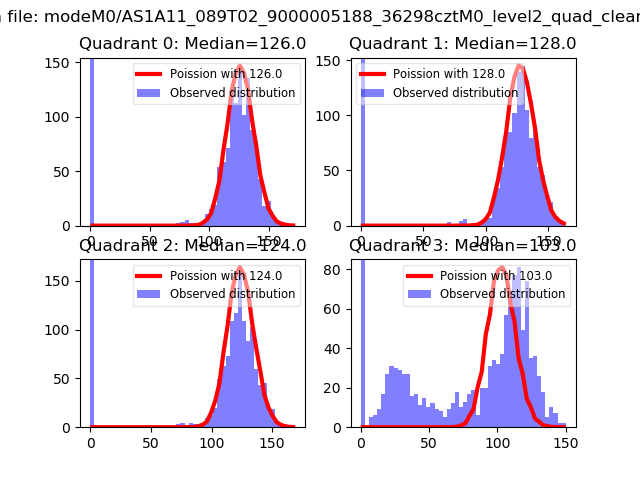 |
 |
| Quadrant-wise count rates Data is divided into 100 sec bins |
 |
|
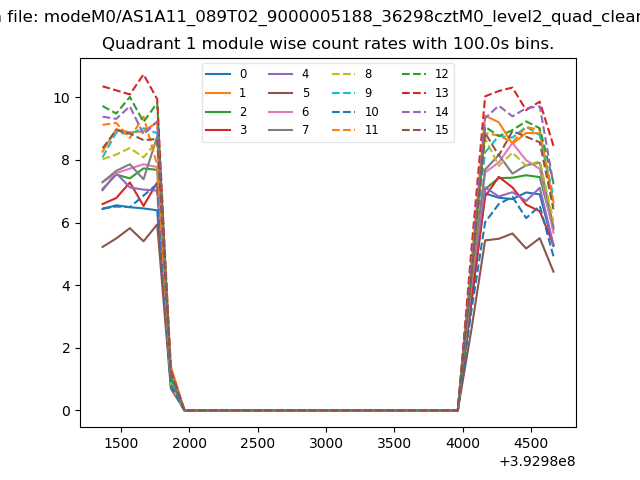
| Module-wise count rates for Quadrant A Data is divided into 100 sec bins |
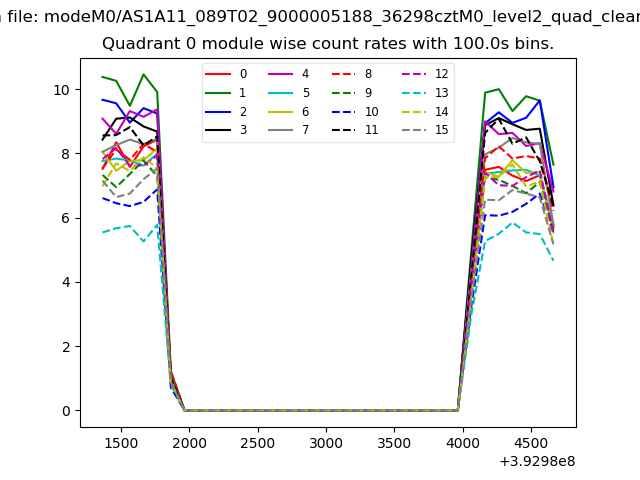 |
 |
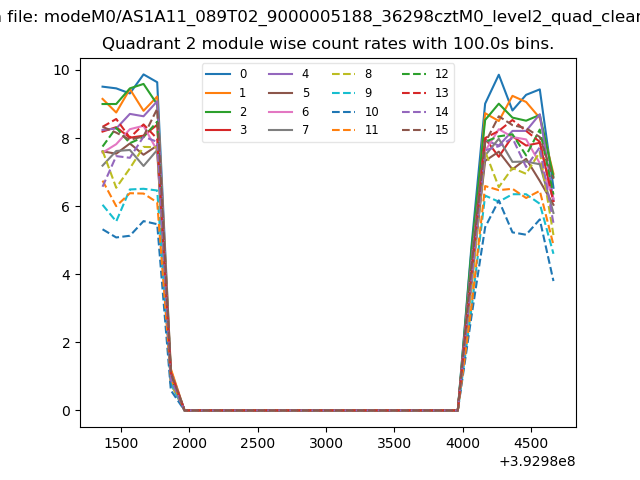
| Module-wise count rates for Quadrant B Data is divided into 100 sec bins |
 |
 |
| Module-wise count rates for Quadrant C Data is divided into 100 sec bins |
 |
 |
| Module-wise count rates for Quadrant D Data is divided into 100 sec bins |
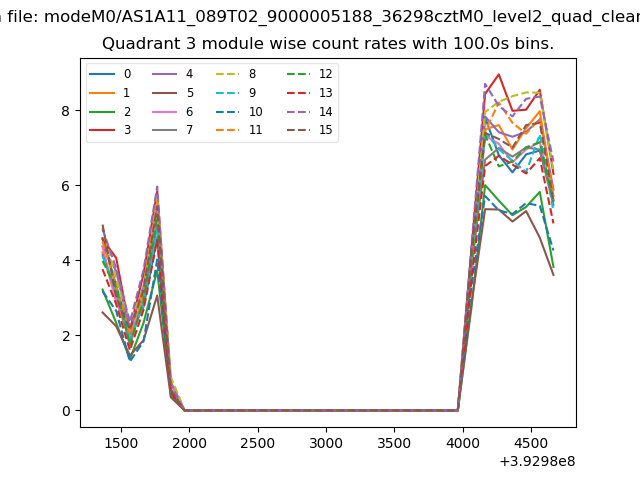 |
 |
| Parameter | Plot |
|---|---|
| CZT HV Monitor | 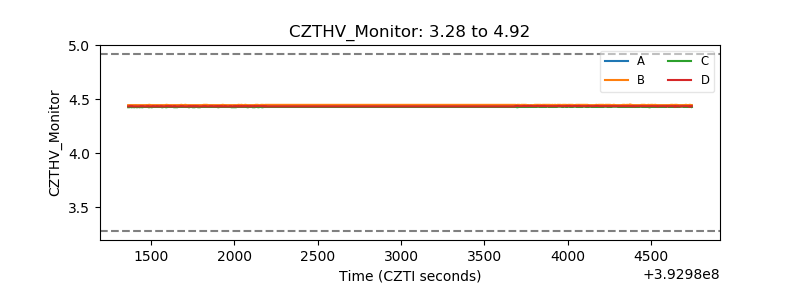 |
| D_VDD | 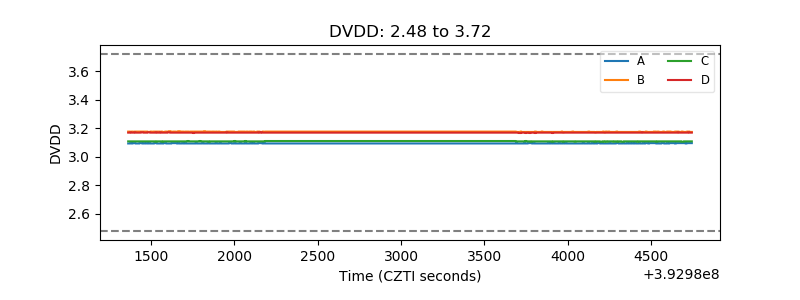 |
| Temperature 1 | 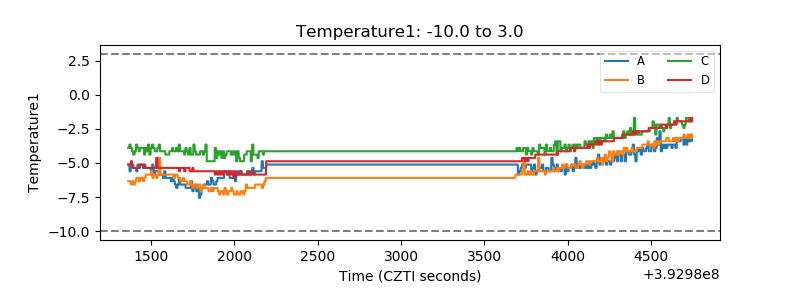 |
| Veto HV Monitor | 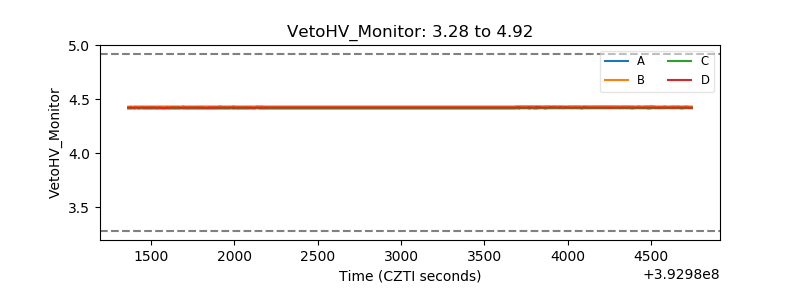 |
| Veto LLD | 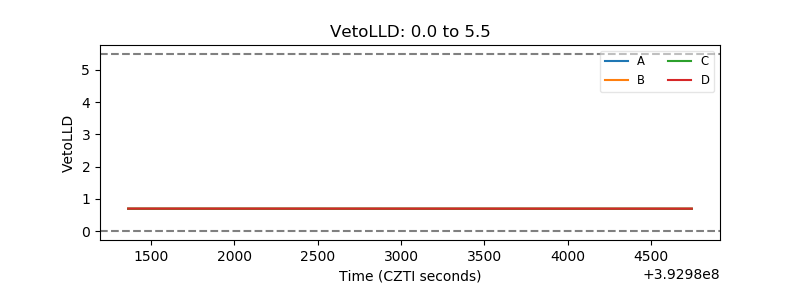 |
| Alpha Counter | 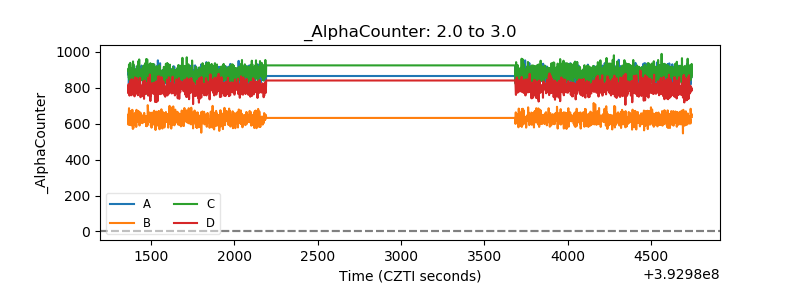 |
| _CPM_Rate | 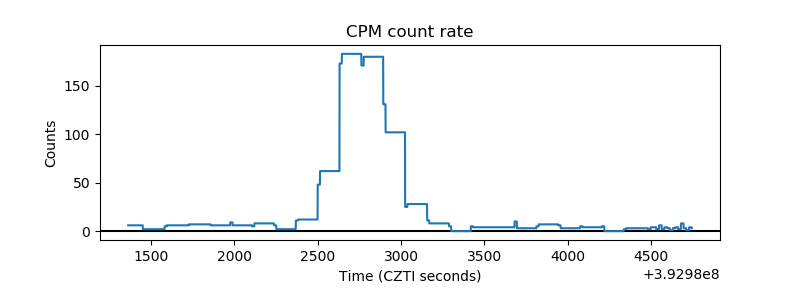 |
| CZT Counter | 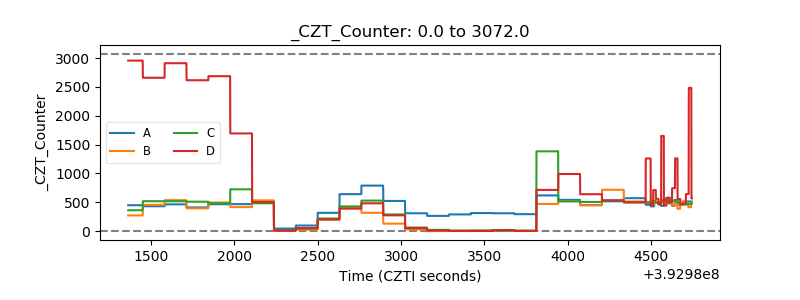 |
| +2.5 Volts monitor | 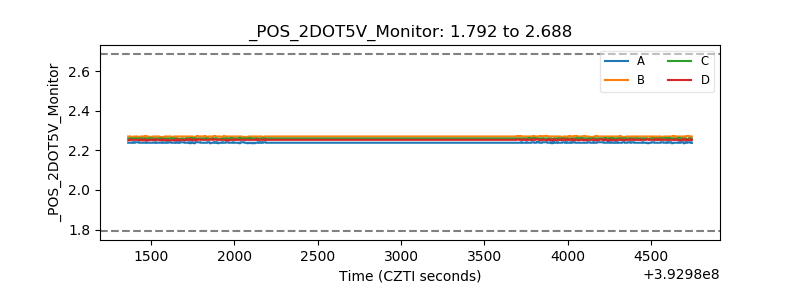 |
| +5 Volts monitor | 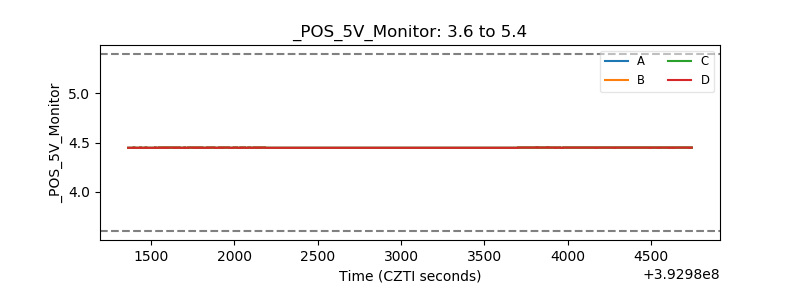 |
| _ROLL_ROT | 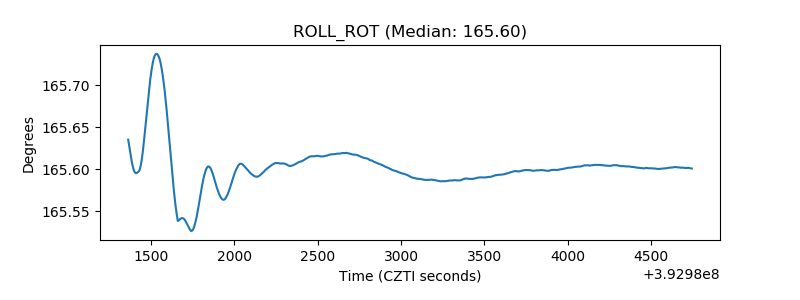 |
| _Roll_DEC | 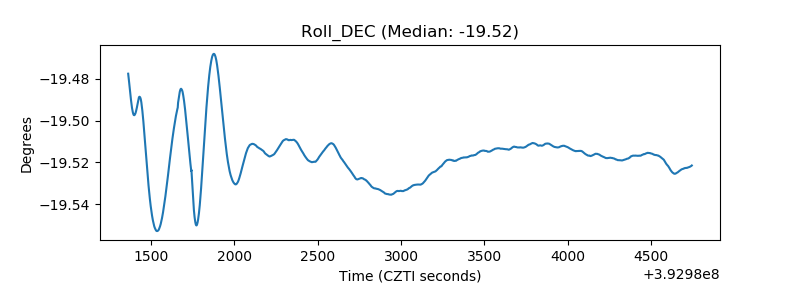 |
| _Roll_RA | 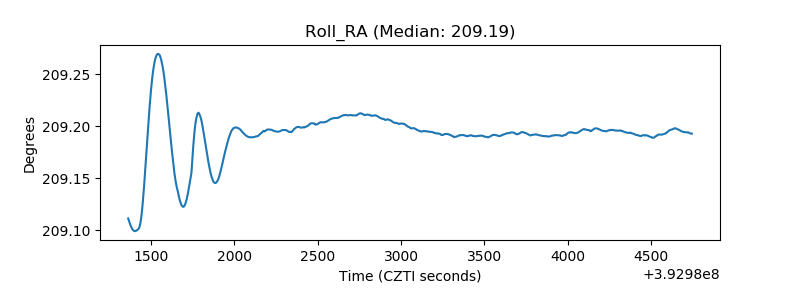 |
| Veto Counter | 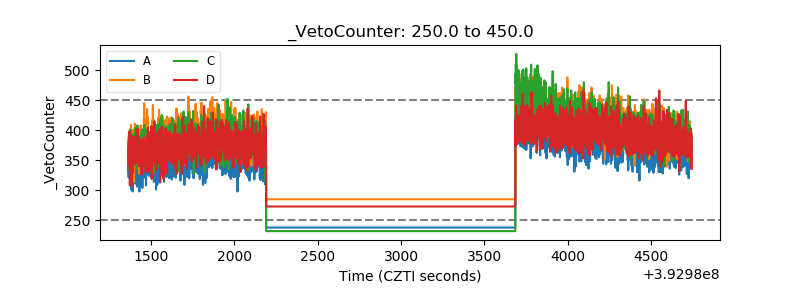 |