| Param | Original file | Final file |
|---|---|---|
| Filename | modeM0/AS1A11_089T02_9000005188cztM0_level2_bc.evt | modeM0/AS1A11_089T02_9000005188cztM0_level2_quad_clean.evt |
| Size (bytes) | 5,692,800,960 | 1,225,843,200 |
| Size | 5.3 GB | 1.1 GB |
| Events in quadrant A | 23,568,573 | 8,179,256 |
| Events in quadrant B | 56,812,937 | 7,177,420 |
| Events in quadrant C | 28,034,133 | 7,852,555 |
| Events in quadrant D | 57,254,686 | 7,115,750 |
| Mode M9 | |||
|---|---|---|---|
| Quadrant | BADHDUFLAG | Total packets | Discarded packets |
| A | 0 | 392 | 0 |
| B | 0 | 392 | 0 |
| C | 0 | 392 | 0 |
| D | 0 | 392 | 0 |
| Mode M0 | |||
|---|---|---|---|
| Quadrant | BADHDUFLAG | Total packets | Discarded packets |
| A | 0 | 207001 | 0 |
| B | 0 | 360820 | 0 |
| C | 0 | 218245 | 0 |
| D | 0 | 329846 | 0 |
| Mode SS | |||
|---|---|---|---|
| Quadrant | BADHDUFLAG | Total packets | Discarded packets |
| A | 0 | 2026 | 0 |
| B | 0 | 2026 | 0 |
| C | 0 | 2026 | 0 |
| D | 0 | 2026 | 0 |
| Quadrant | Total seconds | Saturated seconds | Saturation percentage |
|---|---|---|---|
| A | 99165 | 220 | 0.221852% |
| B | 99163 | 17784 | 17.934108% |
| C | 99165 | 1230 | 1.240357% |
| D | 99165 | 10510 | 10.598497% |
Noise dominated data is calculated using 1-second bins in cleaned event files. If a bin has >2000 counts, and if more than 50% of those come from <1% of pixels, then it is considered to be noise-dominated and hence unusable.
| Quadrant | # 1 sec bins | Bins with >0 counts | Bins with >2000 counts | High rate bins dominated by noise | Noise dominated (total time) | Noise dominated (detector-on time) | Marked lightcurve |
|---|---|---|---|---|---|---|---|
| A | 138337 | 99187 | 21 | 21 | 0.02% | 0.02% |  |
| B | 138337 | 99118 | 967 | 967 | 0.70% | 0.98% | 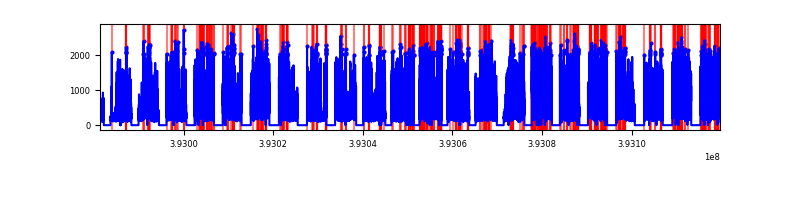 |
| C | 138337 | 99167 | 315 | 315 | 0.23% | 0.32% |  |
| D | 138337 | 99148 | 4480 | 4480 | 3.24% | 4.52% |  |
Top three noisy pixels from each quadrant. If the there are fewer than three noisy pixels in the level2.evt file, extra rows are filled as -1
| Pixel properties | Quadrant properties | ||||||
|---|---|---|---|---|---|---|---|
| Quadrant | DetID | PixID | Counts | Sigma | Mean | Median | Sigma |
| A | 10 | 83 | 2628193 | 2314.78 | 5152 | 5075 | 1133.2 |
| A | 9 | 143 | 366262 | 318.73 | 5152 | 5075 | 1133.2 |
| A | 15 | 223 | 195975 | 168.46 | 5152 | 5075 | 1133.2 |
| B | 5 | 172 | 17831471 | 19181.89 | 4675 | 4576 | 929.4 |
| B | 4 | 171 | 12451075 | 13392.54 | 4675 | 4576 | 929.4 |
| B | 5 | 236 | 4730242 | 5084.86 | 4675 | 4576 | 929.4 |
| C | 15 | 214 | 3932067 | 3520.31 | 4908 | 4869 | 1115.6 |
| C | 0 | 207 | 2422160 | 2166.84 | 4908 | 4869 | 1115.6 |
| C | 0 | 10 | 2222078 | 1987.49 | 4908 | 4869 | 1115.6 |
| D | 12 | 227 | 14331048 | 12560.81 | 4767 | 4627 | 1140.6 |
| D | 12 | 6 | 8349718 | 7316.63 | 4767 | 4627 | 1140.6 |
| D | 12 | 235 | 5259741 | 4607.47 | 4767 | 4627 | 1140.6 |
Histogram calculated using DETX and DETY for each event in the final _common_clean file
| Quadrant A |  |
 |
Quadrant B |
|---|---|---|---|
| Quadrant D | 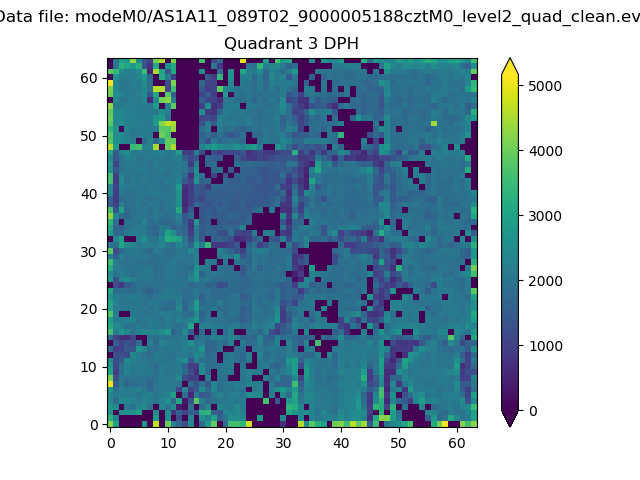 |
 |
Quadrant C |
| Plot type | Count rate plots | Images |
|---|---|---|
| Comparison with Poisson distribution Blue bars denote a histogram of data divided into 1 sec bins. Red curve is a Poisson curve with rate = median count rate of data. |
 |
 |
| Quadrant-wise count rates Data is divided into 100 sec bins |
 |
|
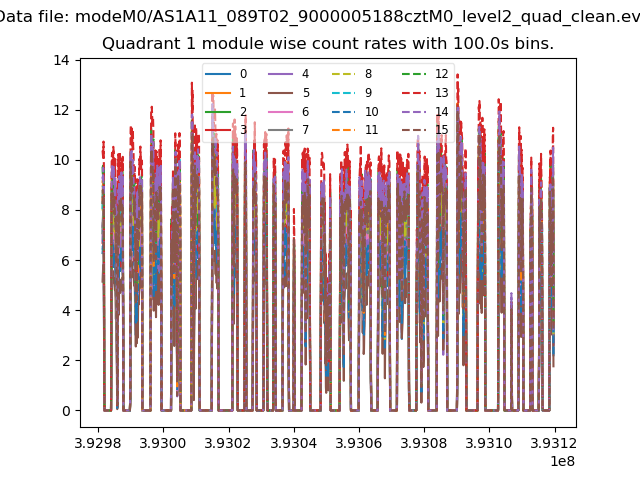
| Module-wise count rates for Quadrant A Data is divided into 100 sec bins |
 |
 |
| Module-wise count rates for Quadrant B Data is divided into 100 sec bins |
 |
 |
| Module-wise count rates for Quadrant C Data is divided into 100 sec bins |
 |
 |
| Module-wise count rates for Quadrant D Data is divided into 100 sec bins |
 |
 |
| Parameter | Plot |
|---|---|
| CZT HV Monitor |  |
| D_VDD |  |
| Temperature 1 |  |
| Veto HV Monitor | 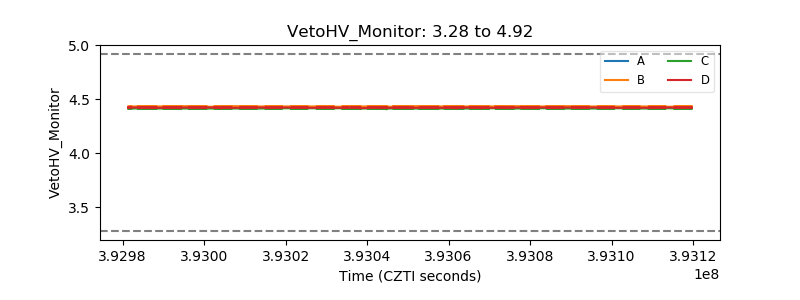 |
| Veto LLD |  |
| Alpha Counter |  |
| _CPM_Rate |  |
| CZT Counter | 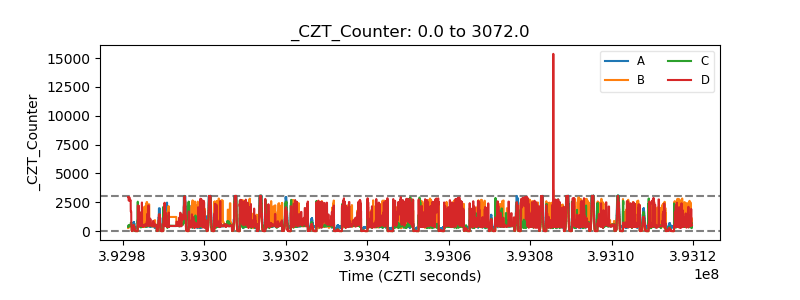 |
| +2.5 Volts monitor |  |
| +5 Volts monitor |  |
| _ROLL_ROT |  |
| _Roll_DEC |  |
| _Roll_RA |  |
| Veto Counter |  |