| Param | Original file | Final file |
|---|---|---|
| Filename | modeM0/AS1A10_071T33_9000005186_36295cztM0_level2.evt | modeM0/AS1A10_071T33_9000005186_36295cztM0_level2_quad_clean.evt |
| Size (bytes) | 491,814,720 | 67,383,360 |
| Size | 469.0 MB | 64.3 MB |
| Events in quadrant A | 2,908,089 | 418,940 |
| Events in quadrant B | 4,409,750 | 399,063 |
| Events in quadrant C | 3,165,625 | 414,638 |
| Events in quadrant D | 4,003,278 | 387,463 |
| Mode M0 | |||
|---|---|---|---|
| Quadrant | BADHDUFLAG | Total packets | Discarded packets |
| A | 0 | 12370 | 3 |
| B | 0 | 17041 | 2 |
| C | 0 | 12868 | 2 |
| D | 0 | 15880 | 2 |
| Mode SS | |||
|---|---|---|---|
| Quadrant | BADHDUFLAG | Total packets | Discarded packets |
| A | 0 | 126 | 0 |
| B | 0 | 126 | 0 |
| C | 0 | 126 | 0 |
| D | 0 | 126 | 0 |
| Mode M9 | |||
|---|---|---|---|
| Quadrant | BADHDUFLAG | Total packets | Discarded packets |
| A | 0 | 27 | 0 |
| B | 0 | 27 | 0 |
| C | 0 | 27 | 0 |
| D | 0 | 27 | 0 |
| Quadrant | Total seconds | Saturated seconds | Saturation percentage |
|---|---|---|---|
| A | 6004 | 7 | 0.116589% |
| B | 6004 | 520 | 8.660893% |
| C | 6004 | 50 | 0.832778% |
| D | 6004 | 248 | 4.130580% |
Noise dominated data is calculated using 1-second bins in cleaned event files. If a bin has >2000 counts, and if more than 50% of those come from <1% of pixels, then it is considered to be noise-dominated and hence unusable.
| Quadrant | # 1 sec bins | Bins with >0 counts | Bins with >2000 counts | High rate bins dominated by noise | Noise dominated (total time) | Noise dominated (detector-on time) | Marked lightcurve |
|---|---|---|---|---|---|---|---|
| A | 8780 | 6006 | 0 | 0 | 0.00% | 0.00% | 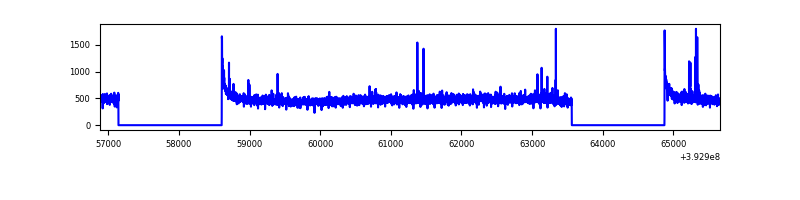 |
| B | 8780 | 6006 | 425 | 425 | 4.84% | 7.08% | 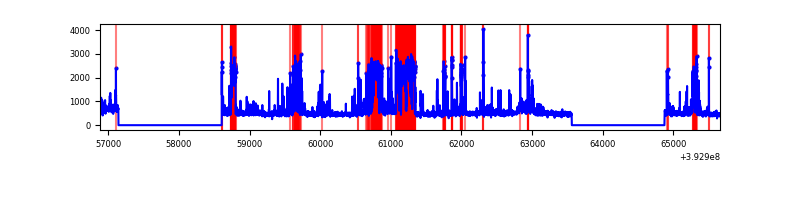 |
| C | 8780 | 6006 | 38 | 38 | 0.43% | 0.63% | 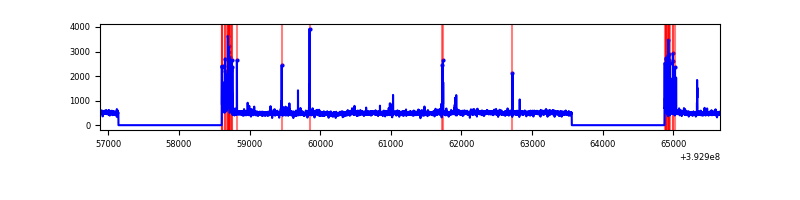 |
| D | 8780 | 6006 | 255 | 255 | 2.90% | 4.25% | 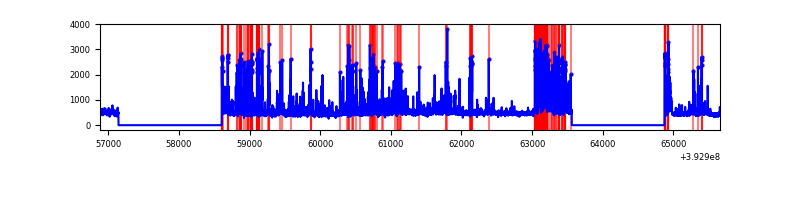 |
Top three noisy pixels from each quadrant. If the there are fewer than three noisy pixels in the level2.evt file, extra rows are filled as -1
| Pixel properties | Quadrant properties | ||||||
|---|---|---|---|---|---|---|---|
| Quadrant | DetID | PixID | Counts | Sigma | Mean | Median | Sigma |
| A | 10 | 83 | 187913 | 1325.0 | 692 | 679 | 141.3 |
| A | 9 | 143 | 28568 | 197.36 | 692 | 679 | 141.3 |
| A | 13 | 6 | 9290 | 60.94 | 692 | 679 | 141.3 |
| B | 5 | 236 | 943576 | 7293.56 | 665 | 646 | 129.3 |
| B | 5 | 172 | 447106 | 3453.37 | 665 | 646 | 129.3 |
| B | 0 | 155 | 108623 | 835.2 | 665 | 646 | 129.3 |
| C | 15 | 214 | 254719 | 1605.3 | 673 | 677 | 158.3 |
| C | 0 | 10 | 237394 | 1495.82 | 673 | 677 | 158.3 |
| C | 0 | 207 | 31240 | 193.13 | 673 | 677 | 158.3 |
| D | 12 | 6 | 740647 | 4522.07 | 663 | 644 | 163.6 |
| D | 7 | 223 | 388203 | 2368.33 | 663 | 644 | 163.6 |
| D | 12 | 227 | 130062 | 790.86 | 663 | 644 | 163.6 |
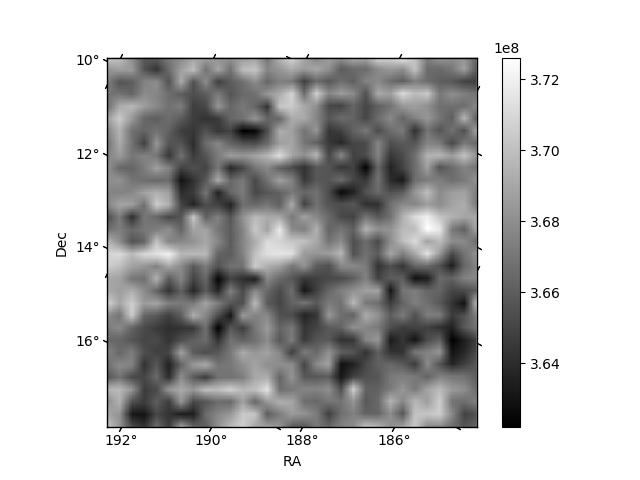
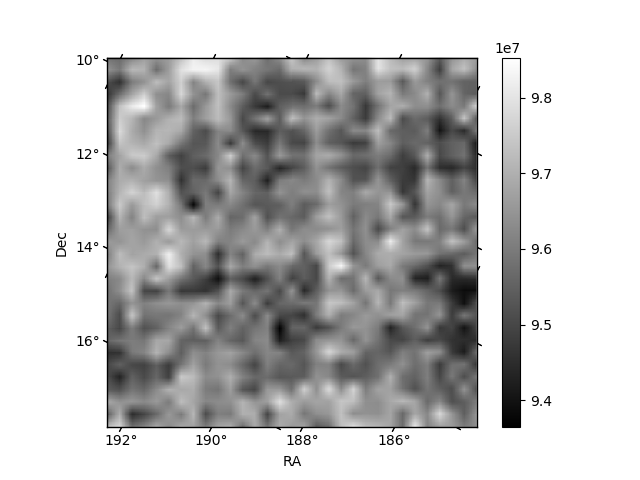
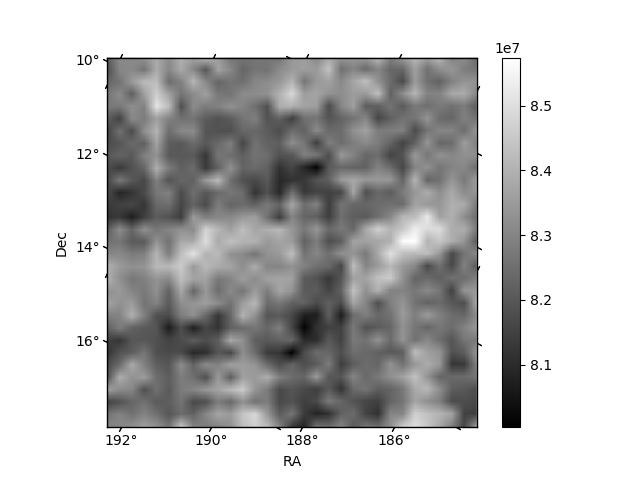
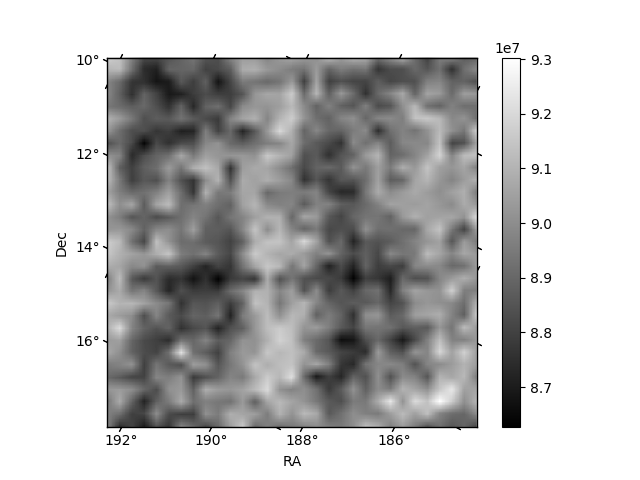
Histogram calculated using DETX and DETY for each event in the final _common_clean file
| Quadrant A | 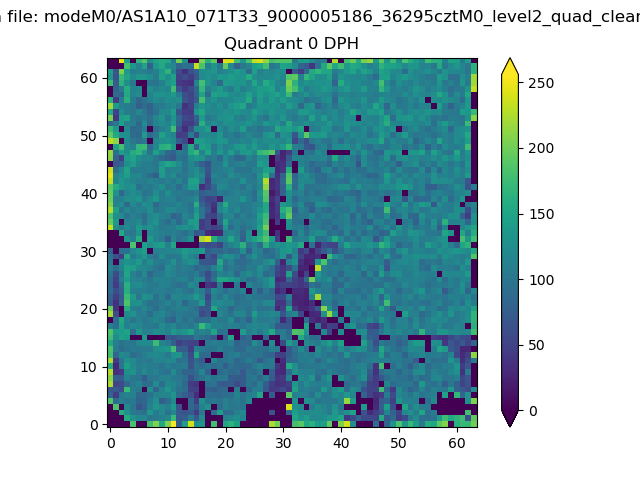 |
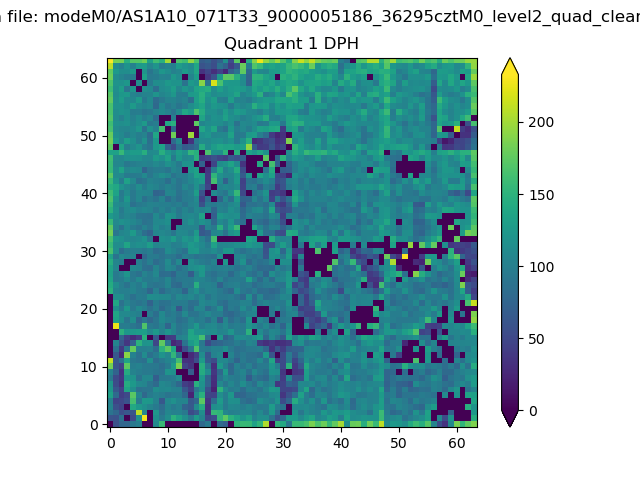 |
Quadrant B |
|---|---|---|---|
| Quadrant D | 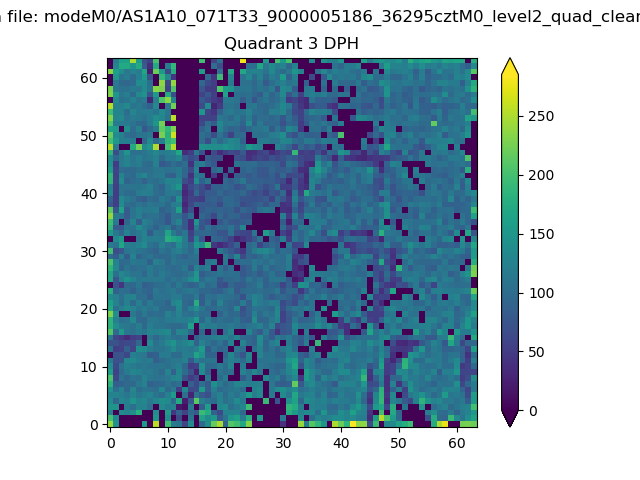 |
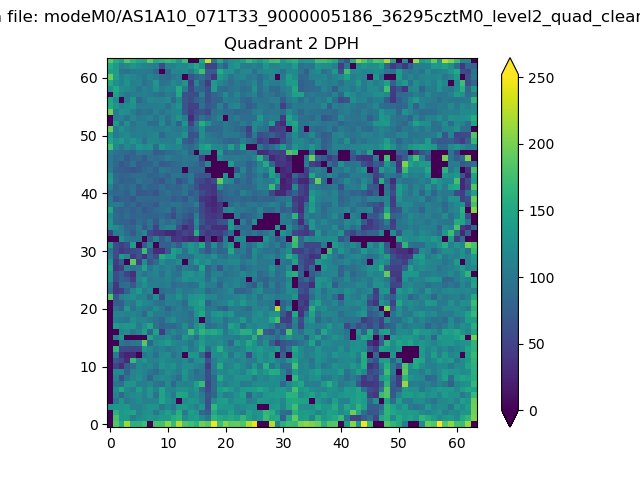 |
Quadrant C |
| Plot type | Count rate plots | Images |
|---|---|---|
| Comparison with Poisson distribution Blue bars denote a histogram of data divided into 1 sec bins. Red curve is a Poisson curve with rate = median count rate of data. |
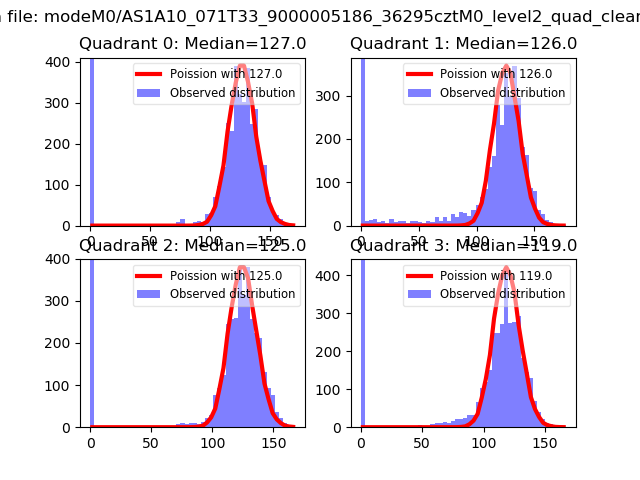 |
 |
| Quadrant-wise count rates Data is divided into 100 sec bins |
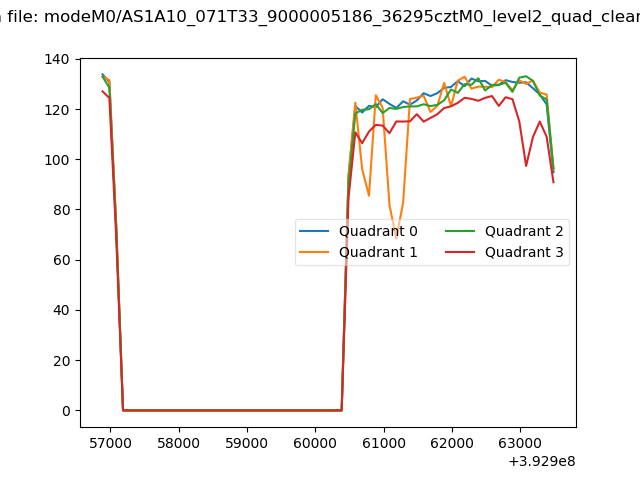 |
|
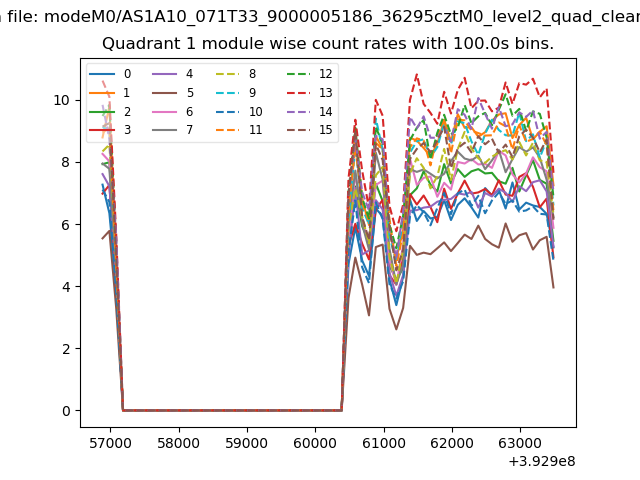
| Module-wise count rates for Quadrant A Data is divided into 100 sec bins |
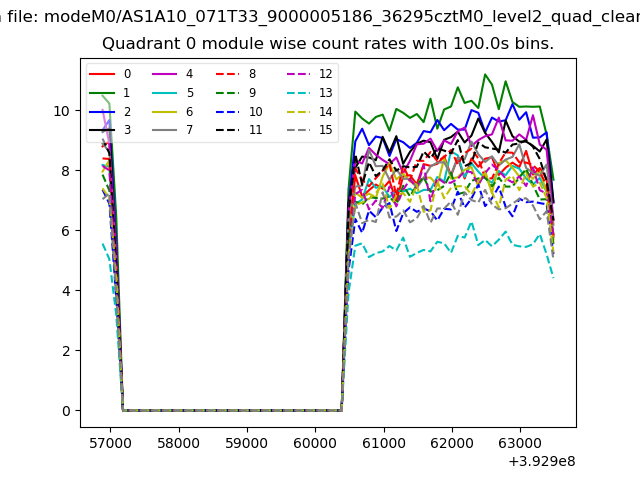 |
 |
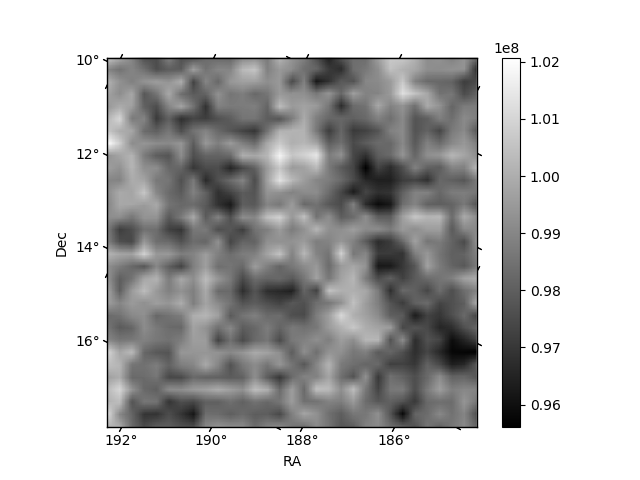
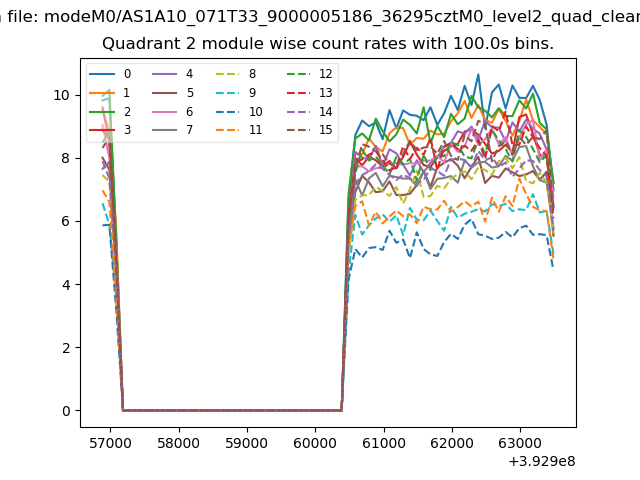
| Module-wise count rates for Quadrant B Data is divided into 100 sec bins |
 |
 |
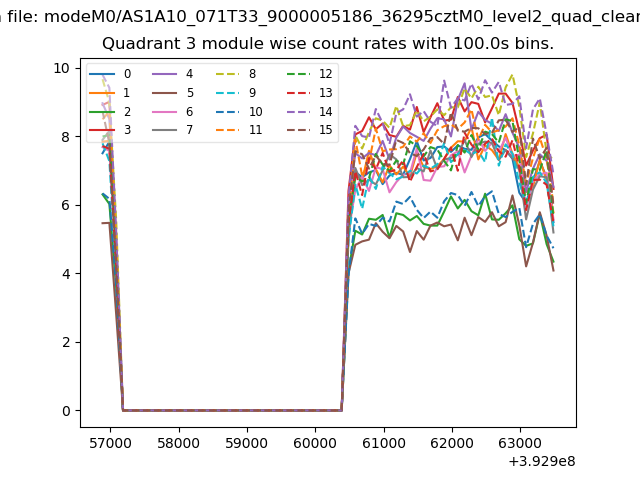
| Module-wise count rates for Quadrant C Data is divided into 100 sec bins |
 |
 |
| Module-wise count rates for Quadrant D Data is divided into 100 sec bins |
 |
 |
| Parameter | Plot |
|---|---|
| CZT HV Monitor | 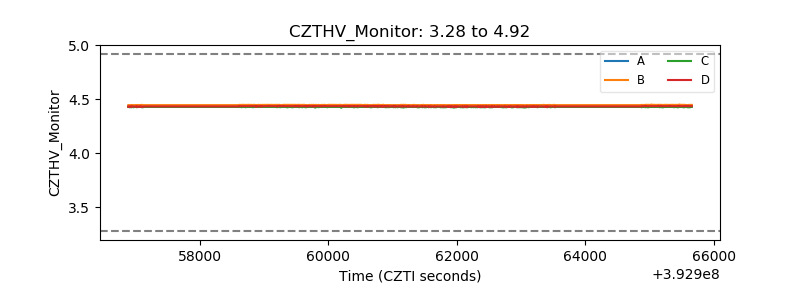 |
| D_VDD | 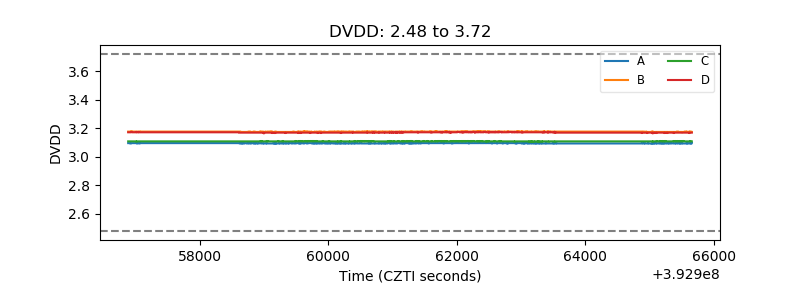 |
| Temperature 1 | 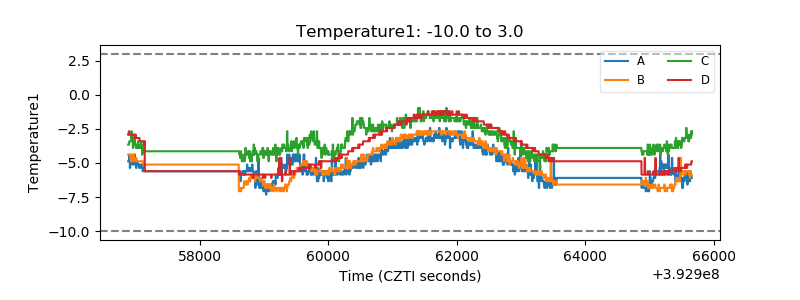 |
| Veto HV Monitor | 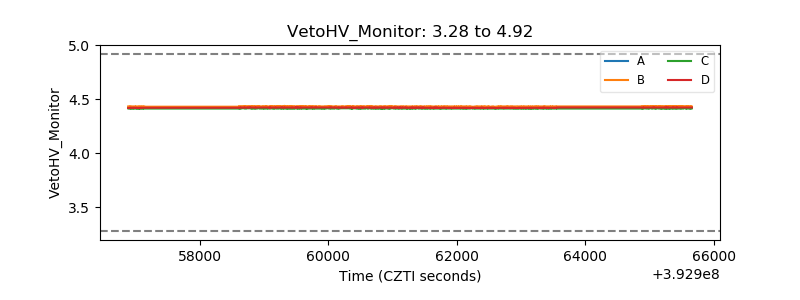 |
| Veto LLD | 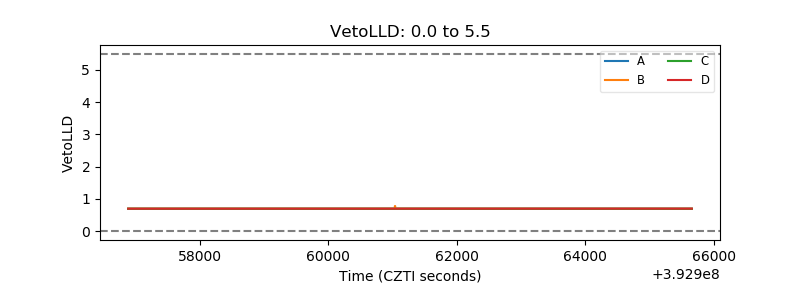 |
| Alpha Counter | 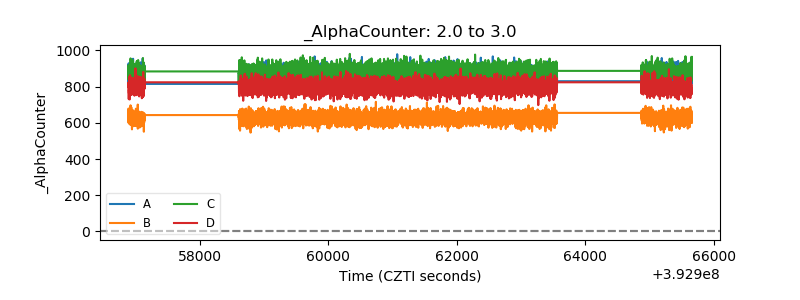 |
| _CPM_Rate | 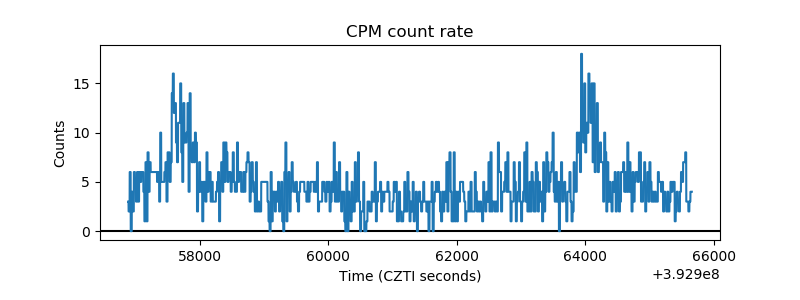 |
| CZT Counter | 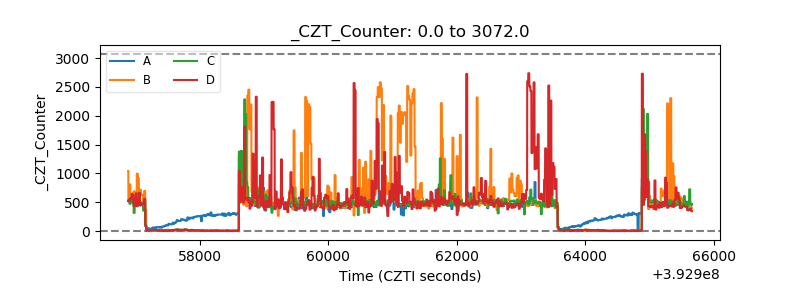 |
| +2.5 Volts monitor | 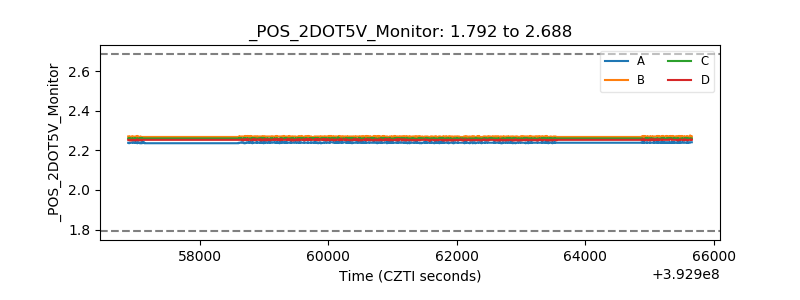 |
| +5 Volts monitor | 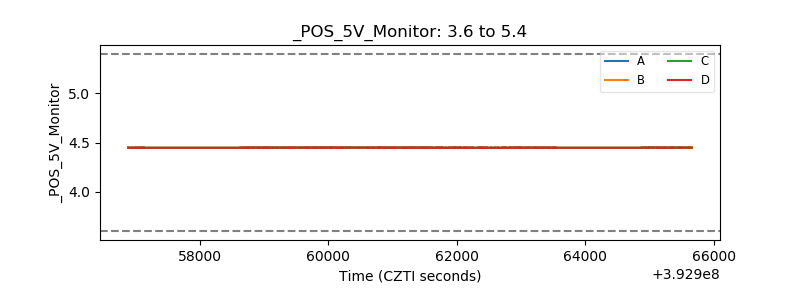 |
| _ROLL_ROT | 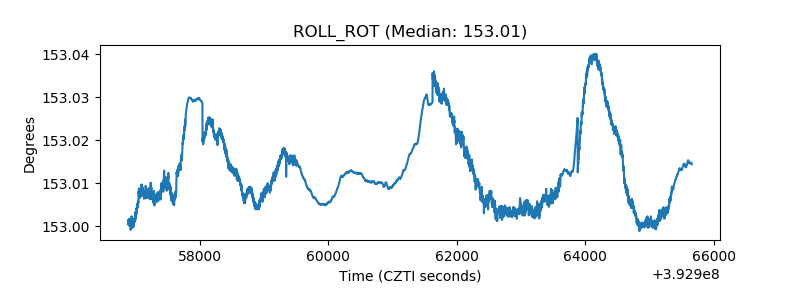 |
| _Roll_DEC | 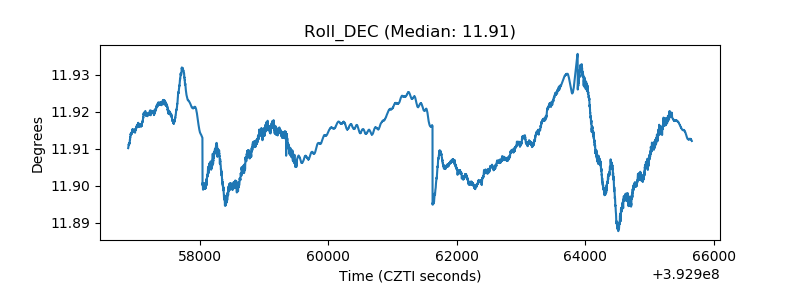 |
| _Roll_RA | 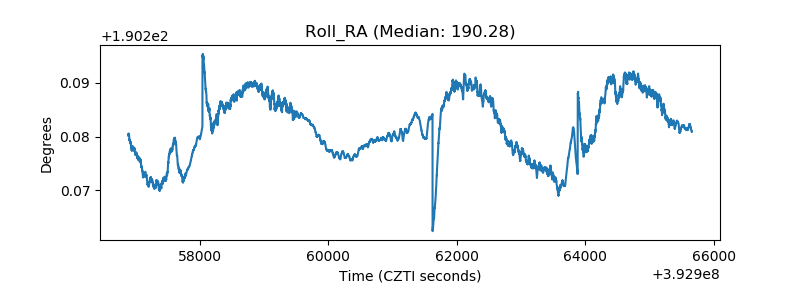 |
| Veto Counter | 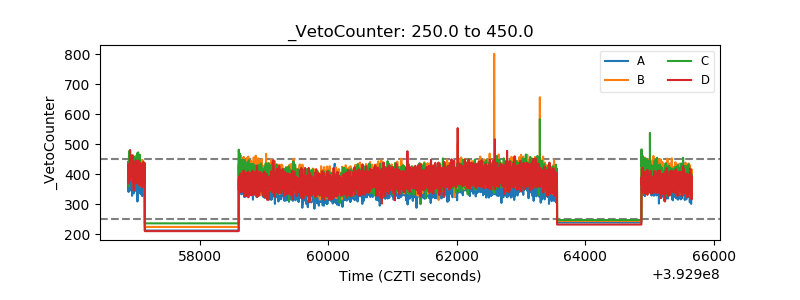 |