| Param | Original file | Final file |
|---|---|---|
| Filename | modeM0/AS1A10_071T33_9000005186_36293cztM0_level2.evt | modeM0/AS1A10_071T33_9000005186_36293cztM0_level2_quad_clean.evt |
| Size (bytes) | 461,894,400 | 50,022,720 |
| Size | 440.5 MB | 47.7 MB |
| Events in quadrant A | 3,279,802 | 296,390 |
| Events in quadrant B | 3,875,150 | 289,380 |
| Events in quadrant C | 2,719,312 | 290,415 |
| Events in quadrant D | 3,752,386 | 264,501 |
| Mode M0 | |||
|---|---|---|---|
| Quadrant | BADHDUFLAG | Total packets | Discarded packets |
| A | 0 | 13159 | 3 |
| B | 0 | 15096 | 2 |
| C | 0 | 11207 | 2 |
| D | 0 | 14888 | 2 |
| Mode SS | |||
|---|---|---|---|
| Quadrant | BADHDUFLAG | Total packets | Discarded packets |
| A | 0 | 108 | 0 |
| B | 0 | 108 | 0 |
| C | 0 | 108 | 0 |
| D | 0 | 108 | 0 |
| Mode M9 | |||
|---|---|---|---|
| Quadrant | BADHDUFLAG | Total packets | Discarded packets |
| A | 0 | 33 | 0 |
| B | 0 | 33 | 0 |
| C | 0 | 33 | 0 |
| D | 0 | 34 | 0 |
| Quadrant | Total seconds | Saturated seconds | Saturation percentage |
|---|---|---|---|
| A | 5334 | 132 | 2.474691% |
| B | 5334 | 260 | 4.874391% |
| C | 5334 | 34 | 0.637420% |
| D | 5334 | 297 | 5.568054% |
Noise dominated data is calculated using 1-second bins in cleaned event files. If a bin has >2000 counts, and if more than 50% of those come from <1% of pixels, then it is considered to be noise-dominated and hence unusable.
| Quadrant | # 1 sec bins | Bins with >0 counts | Bins with >2000 counts | High rate bins dominated by noise | Noise dominated (total time) | Noise dominated (detector-on time) | Marked lightcurve |
|---|---|---|---|---|---|---|---|
| A | 7127 | 5335 | 100 | 100 | 1.40% | 1.87% | 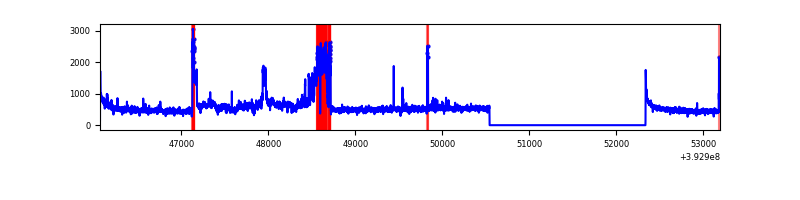 |
| B | 7127 | 5335 | 151 | 151 | 2.12% | 2.83% | 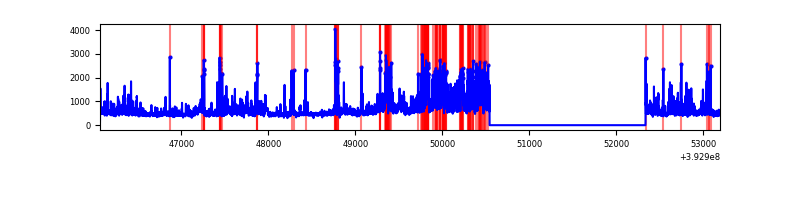 |
| C | 7127 | 5335 | 24 | 24 | 0.34% | 0.45% | 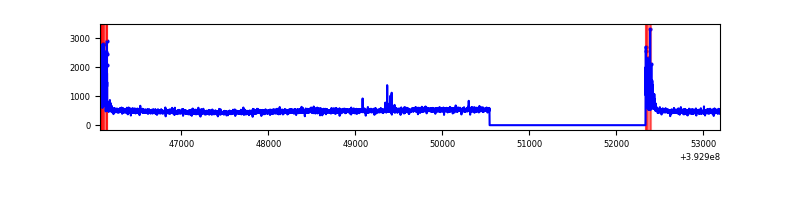 |
| D | 7127 | 5335 | 281 | 281 | 3.94% | 5.27% | 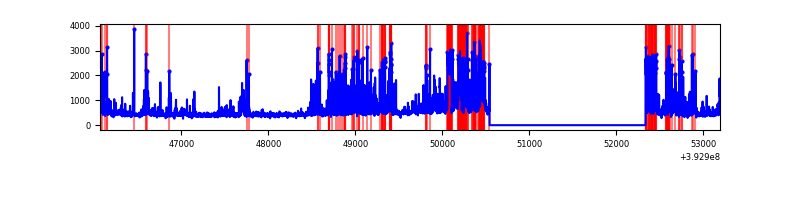 |
Top three noisy pixels from each quadrant. If the there are fewer than three noisy pixels in the level2.evt file, extra rows are filled as -1
| Pixel properties | Quadrant properties | ||||||
|---|---|---|---|---|---|---|---|
| Quadrant | DetID | PixID | Counts | Sigma | Mean | Median | Sigma |
| A | 15 | 223 | 683140 | 5497.89 | 614 | 601 | 124.1 |
| A | 10 | 83 | 177307 | 1423.38 | 614 | 601 | 124.1 |
| A | 9 | 143 | 27702 | 218.3 | 614 | 601 | 124.1 |
| B | 4 | 171 | 470636 | 4015.29 | 604 | 587 | 117.1 |
| B | 5 | 172 | 382732 | 3264.39 | 604 | 587 | 117.1 |
| B | 0 | 155 | 270376 | 2304.61 | 604 | 587 | 117.1 |
| C | 15 | 214 | 225997 | 1596.04 | 598 | 602 | 141.2 |
| C | 0 | 10 | 149990 | 1057.83 | 598 | 602 | 141.2 |
| C | 15 | 159 | 7551 | 49.21 | 598 | 602 | 141.2 |
| D | 7 | 223 | 651713 | 4520.38 | 583 | 566 | 144.0 |
| D | 12 | 6 | 494019 | 3425.64 | 583 | 566 | 144.0 |
| D | 13 | 249 | 83514 | 575.84 | 583 | 566 | 144.0 |
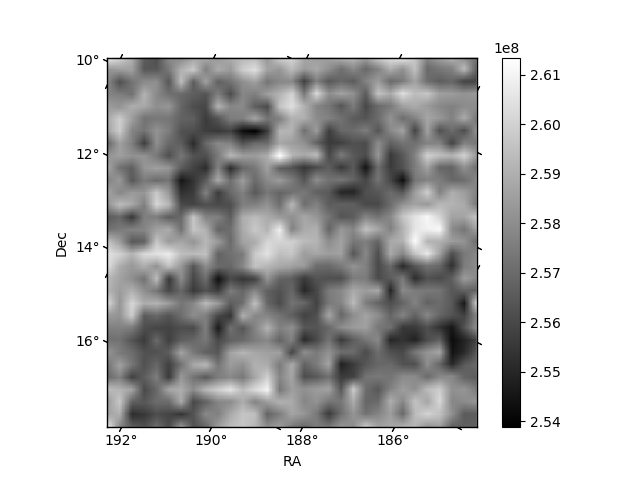
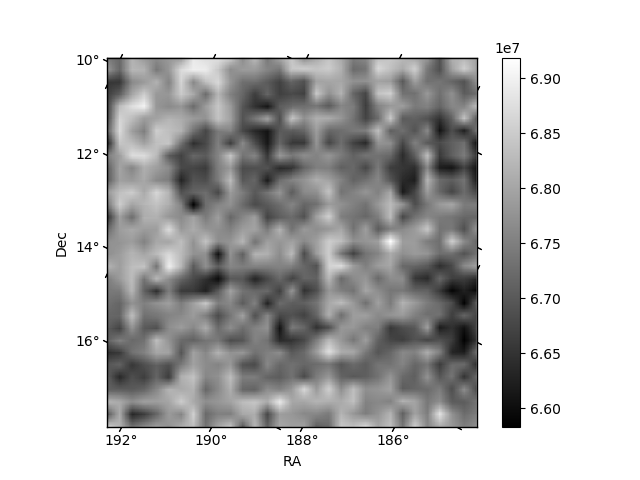
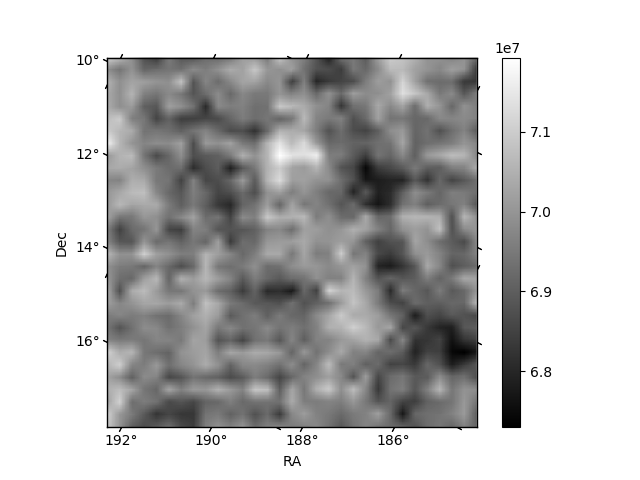
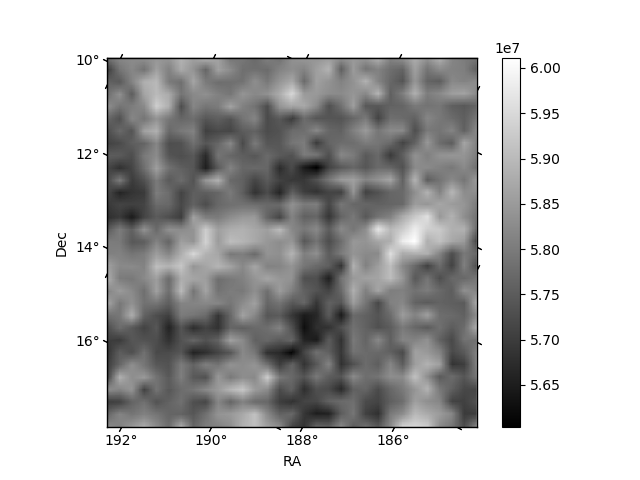
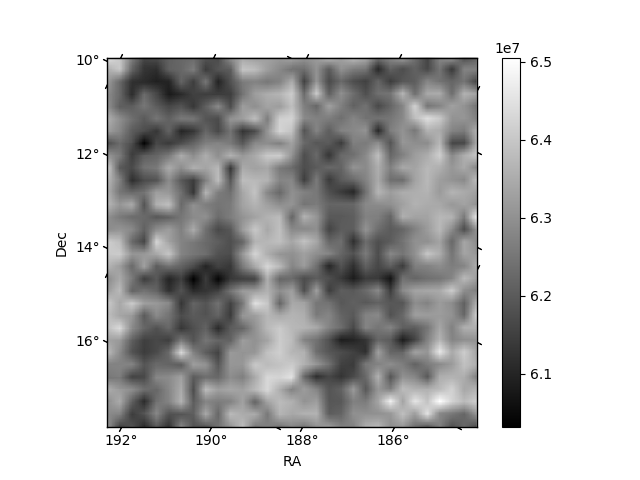
Histogram calculated using DETX and DETY for each event in the final _common_clean file
| Quadrant A | 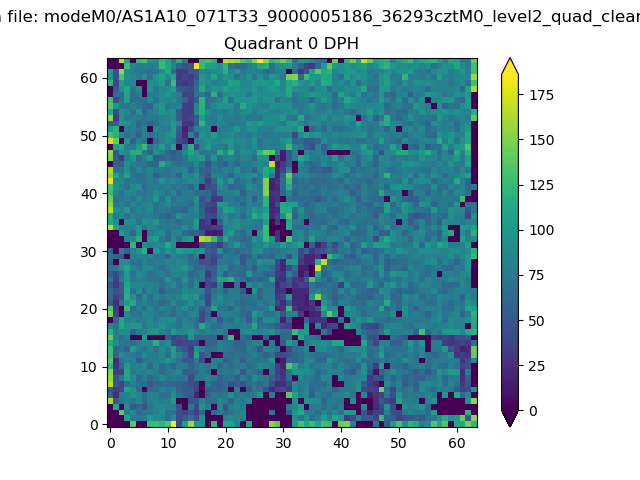 |
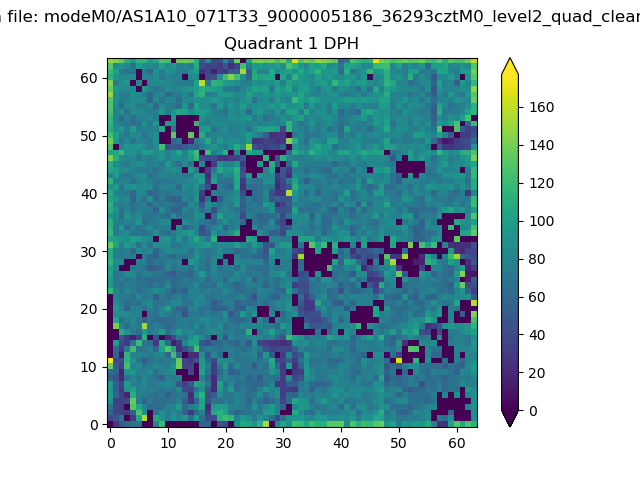 |
Quadrant B |
|---|---|---|---|
| Quadrant D | 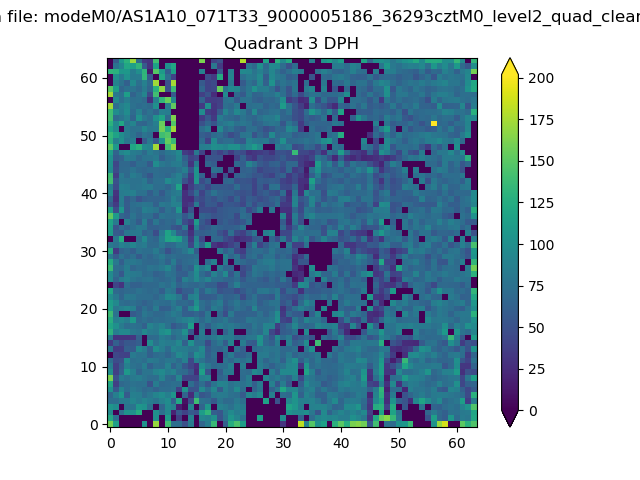 |
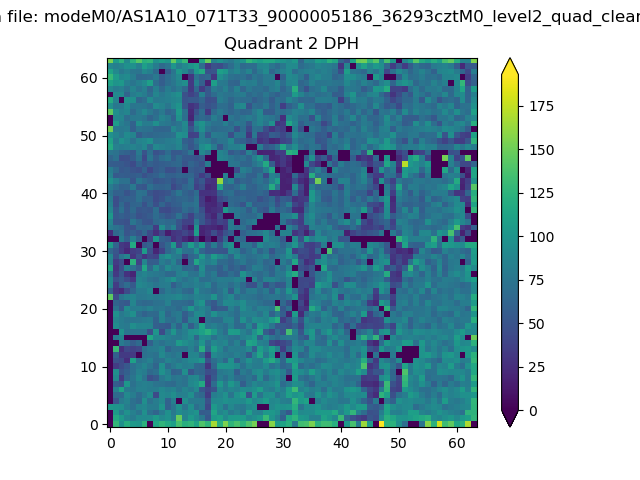 |
Quadrant C |
| Plot type | Count rate plots | Images |
|---|---|---|
| Comparison with Poisson distribution Blue bars denote a histogram of data divided into 1 sec bins. Red curve is a Poisson curve with rate = median count rate of data. |
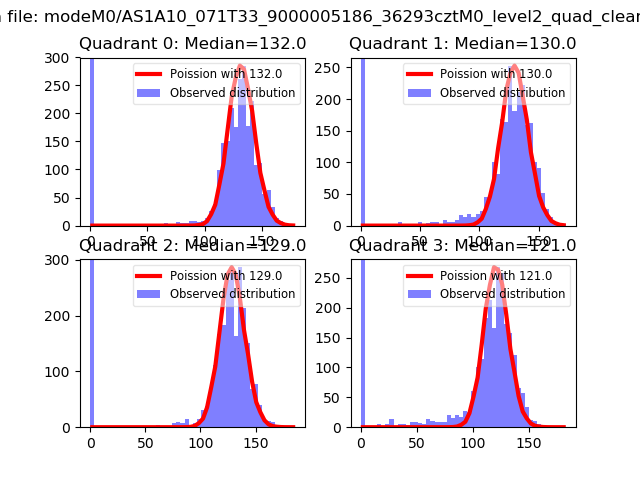 |
 |
| Quadrant-wise count rates Data is divided into 100 sec bins |
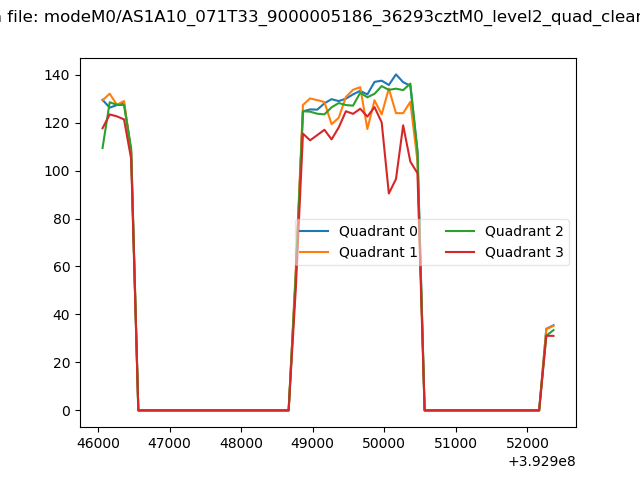 |
|
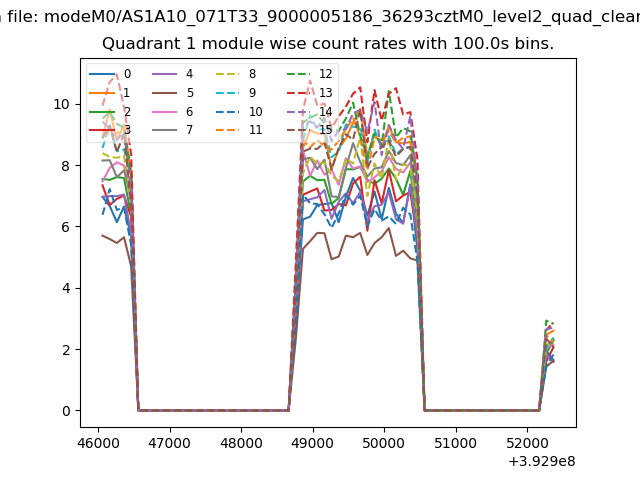
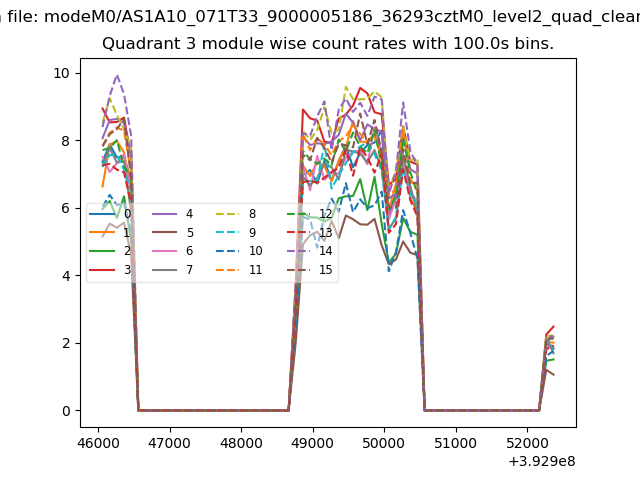
| Module-wise count rates for Quadrant A Data is divided into 100 sec bins |
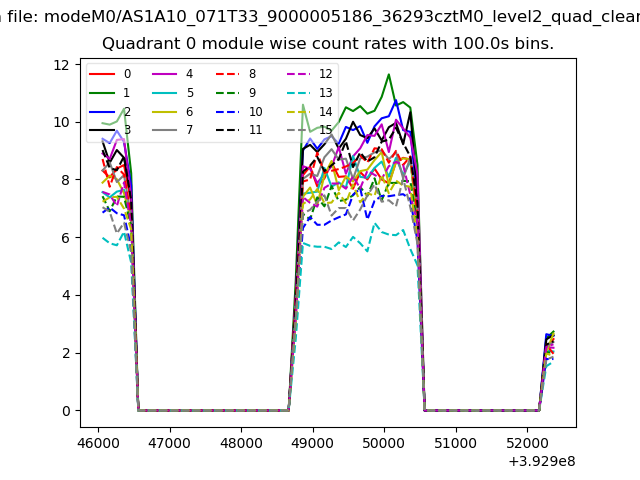 |
 |
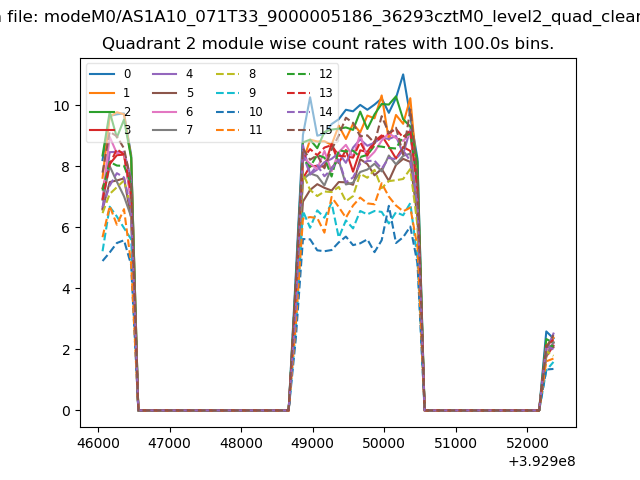
| Module-wise count rates for Quadrant B Data is divided into 100 sec bins |
 |
 |
| Module-wise count rates for Quadrant C Data is divided into 100 sec bins |
 |
 |
| Module-wise count rates for Quadrant D Data is divided into 100 sec bins |
 |
 |
| Parameter | Plot |
|---|---|
| CZT HV Monitor | 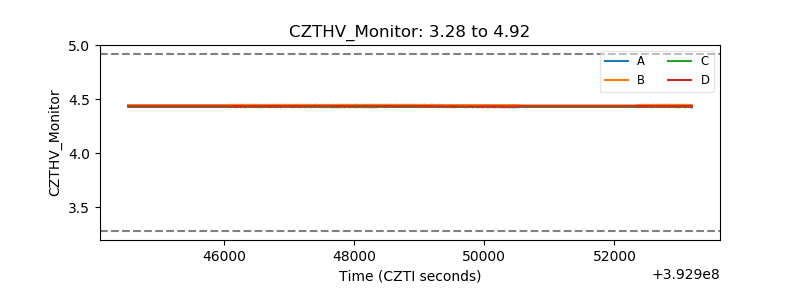 |
| D_VDD | 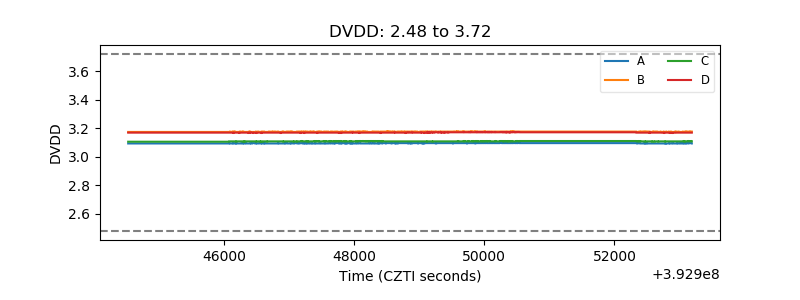 |
| Temperature 1 | 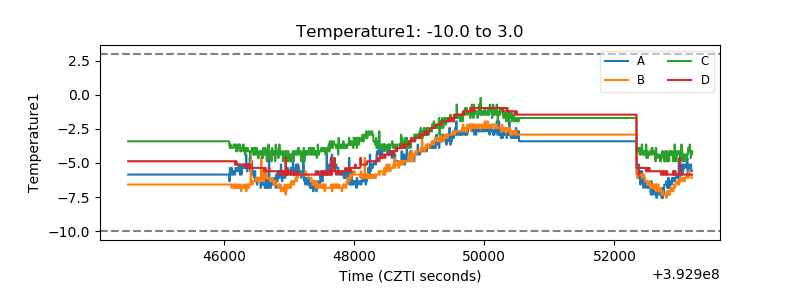 |
| Veto HV Monitor |  |
| Veto LLD | 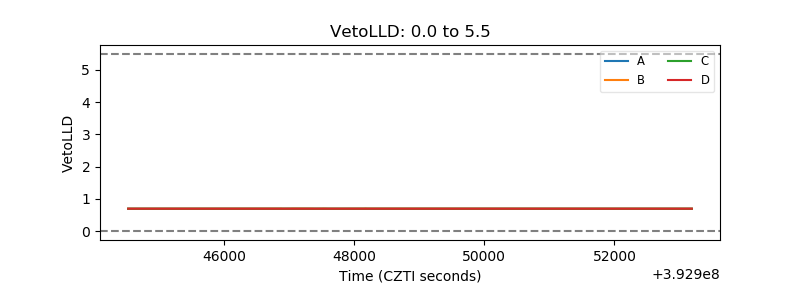 |
| Alpha Counter | 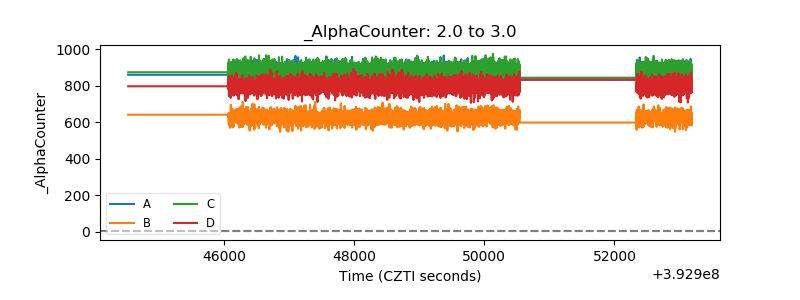 |
| _CPM_Rate | 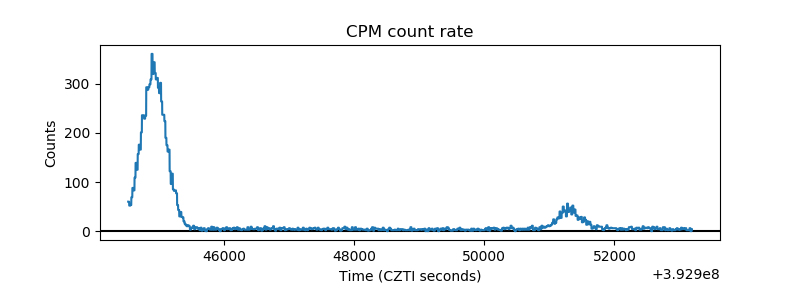 |
| CZT Counter | 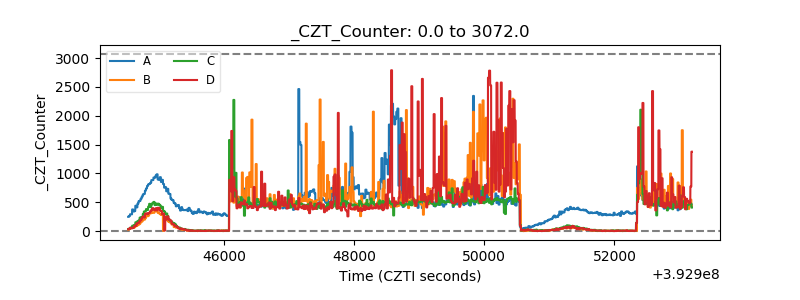 |
| +2.5 Volts monitor | 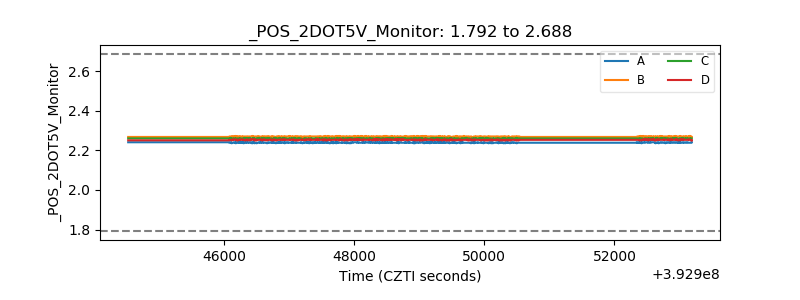 |
| +5 Volts monitor | 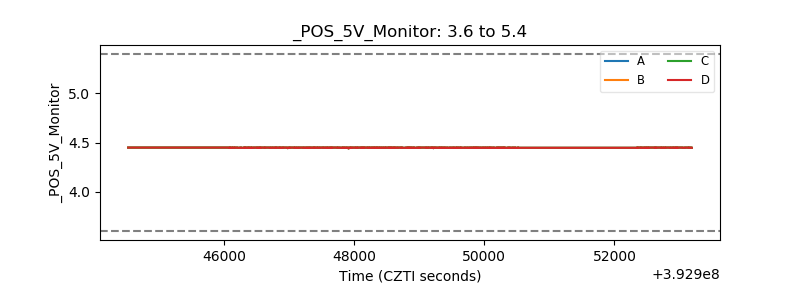 |
| _ROLL_ROT | 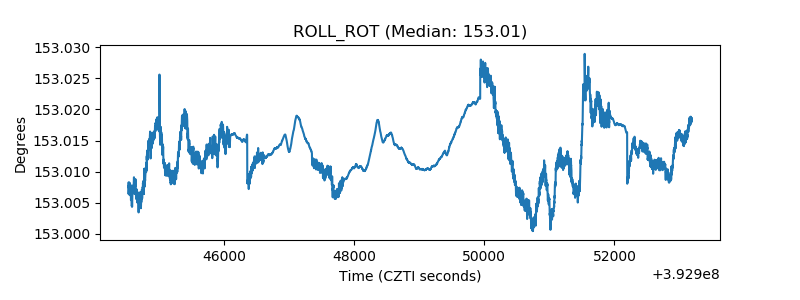 |
| _Roll_DEC | 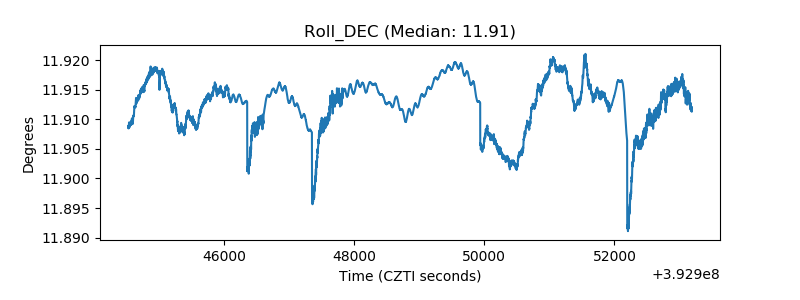 |
| _Roll_RA | 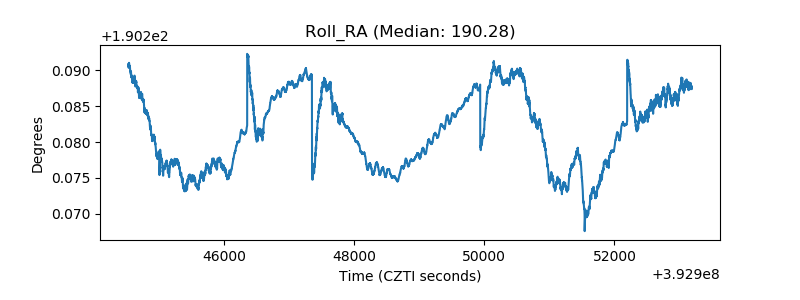 |
| Veto Counter | 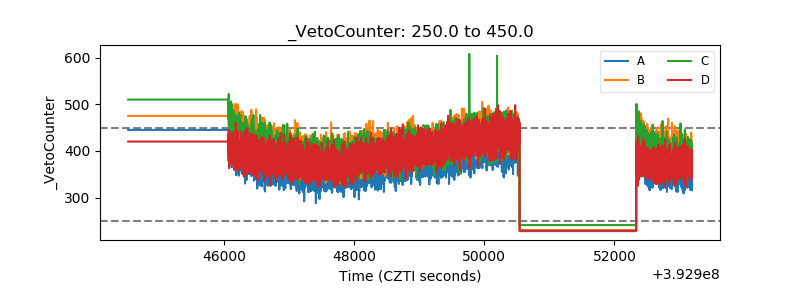 |