| Param | Original file | Final file |
|---|---|---|
| Filename | modeM0/AS1A10_071T33_9000005186_36288cztM0_level2.evt | modeM0/AS1A10_071T33_9000005186_36288cztM0_level2_quad_clean.evt |
| Size (bytes) | 433,238,400 | 73,670,400 |
| Size | 413.2 MB | 70.3 MB |
| Events in quadrant A | 2,776,325 | 478,448 |
| Events in quadrant B | 3,533,353 | 476,826 |
| Events in quadrant C | 2,949,540 | 466,477 |
| Events in quadrant D | 3,514,490 | 450,901 |
| Mode M0 | |||
|---|---|---|---|
| Quadrant | BADHDUFLAG | Total packets | Discarded packets |
| A | 0 | 11481 | 3 |
| B | 0 | 13797 | 2 |
| C | 0 | 11865 | 2 |
| D | 0 | 13780 | 2 |
| Mode SS | |||
|---|---|---|---|
| Quadrant | BADHDUFLAG | Total packets | Discarded packets |
| A | 0 | 106 | 0 |
| B | 0 | 106 | 0 |
| C | 0 | 106 | 0 |
| D | 0 | 106 | 0 |
| Mode M9 | |||
|---|---|---|---|
| Quadrant | BADHDUFLAG | Total packets | Discarded packets |
| A | 0 | 27 | 0 |
| B | 0 | 27 | 0 |
| C | 0 | 27 | 0 |
| D | 0 | 28 | 0 |
| Quadrant | Total seconds | Saturated seconds | Saturation percentage |
|---|---|---|---|
| A | 5102 | 55 | 1.078009% |
| B | 5102 | 214 | 4.194434% |
| C | 5102 | 128 | 2.508820% |
| D | 5102 | 232 | 4.547236% |
Noise dominated data is calculated using 1-second bins in cleaned event files. If a bin has >2000 counts, and if more than 50% of those come from <1% of pixels, then it is considered to be noise-dominated and hence unusable.
| Quadrant | # 1 sec bins | Bins with >0 counts | Bins with >2000 counts | High rate bins dominated by noise | Noise dominated (total time) | Noise dominated (detector-on time) | Marked lightcurve |
|---|---|---|---|---|---|---|---|
| A | 7015 | 5103 | 46 | 46 | 0.66% | 0.90% | 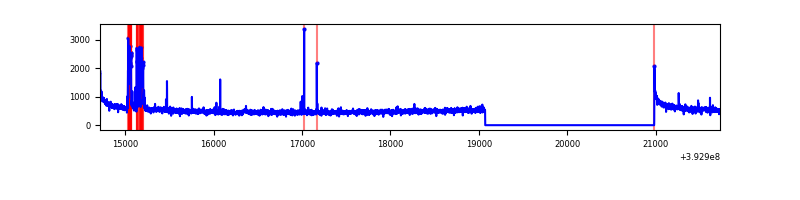 |
| B | 7015 | 5103 | 142 | 142 | 2.02% | 2.78% | 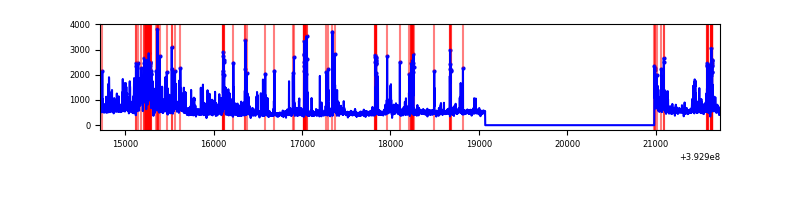 |
| C | 7015 | 5103 | 103 | 103 | 1.47% | 2.02% | 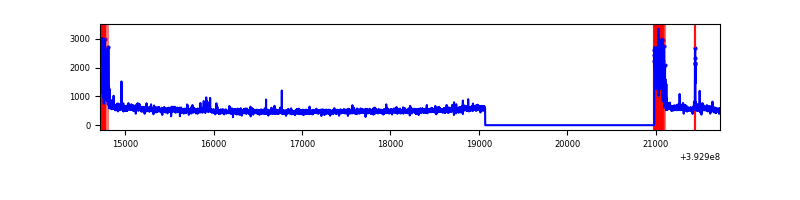 |
| D | 7015 | 5103 | 213 | 213 | 3.04% | 4.17% | 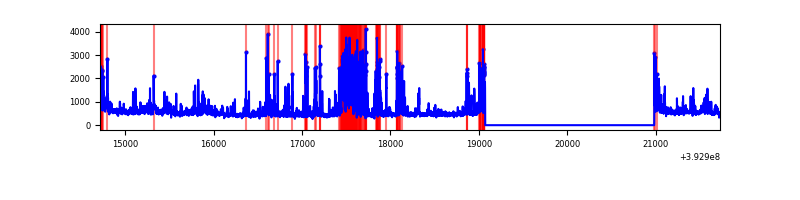 |
Top three noisy pixels from each quadrant. If the there are fewer than three noisy pixels in the level2.evt file, extra rows are filled as -1
| Pixel properties | Quadrant properties | ||||||
|---|---|---|---|---|---|---|---|
| Quadrant | DetID | PixID | Counts | Sigma | Mean | Median | Sigma |
| A | 10 | 83 | 181805 | 1453.36 | 619 | 608 | 124.7 |
| A | 9 | 143 | 165811 | 1325.08 | 619 | 608 | 124.7 |
| A | 13 | 6 | 26330 | 206.31 | 619 | 608 | 124.7 |
| B | 4 | 171 | 405550 | 3516.11 | 607 | 591 | 115.2 |
| B | 5 | 172 | 313694 | 2718.56 | 607 | 591 | 115.2 |
| B | 5 | 236 | 198054 | 1714.5 | 607 | 591 | 115.2 |
| C | 0 | 10 | 337514 | 2413.3 | 598 | 604 | 139.6 |
| C | 15 | 214 | 212761 | 1519.69 | 598 | 604 | 139.6 |
| C | 0 | 207 | 55189 | 390.99 | 598 | 604 | 139.6 |
| D | 12 | 6 | 671712 | 4650.73 | 593 | 577 | 144.3 |
| D | 13 | 171 | 145599 | 1004.95 | 593 | 577 | 144.3 |
| D | 13 | 249 | 118959 | 820.35 | 593 | 577 | 144.3 |
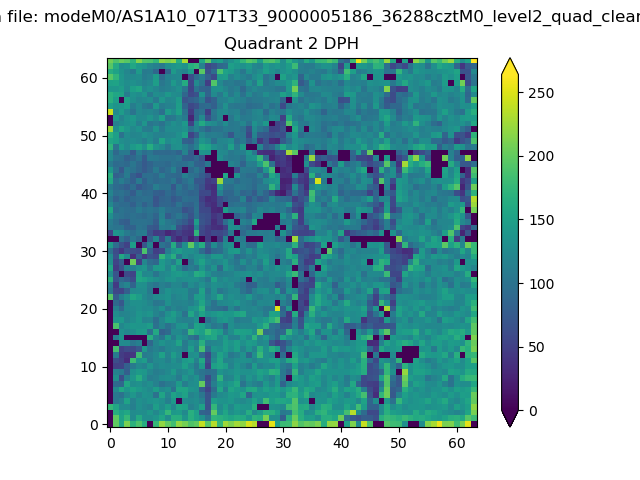
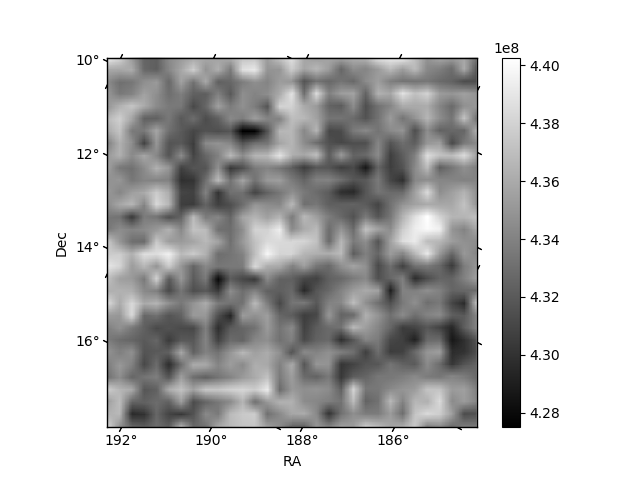
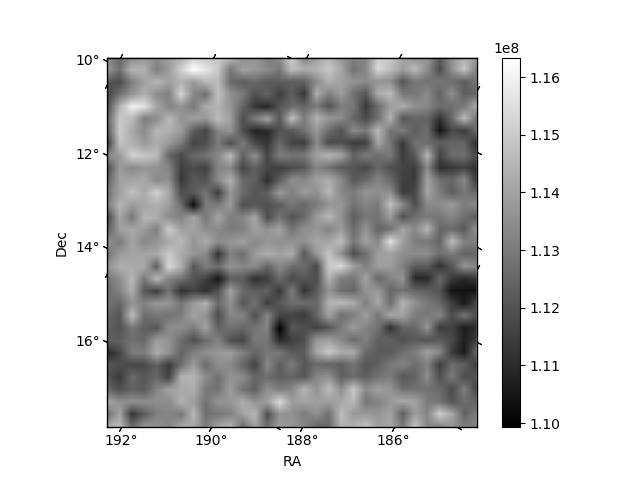
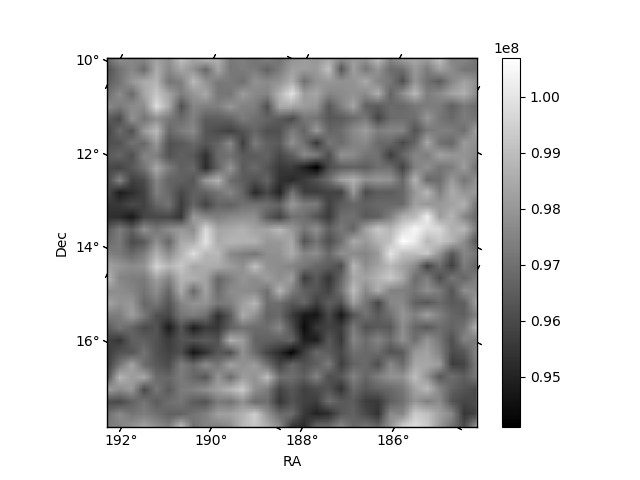
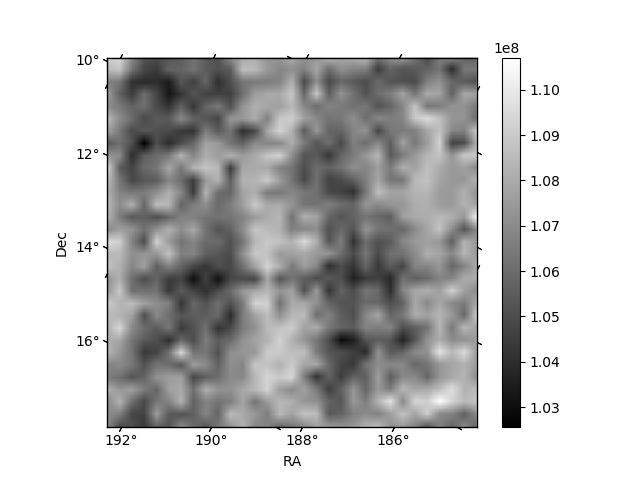
Histogram calculated using DETX and DETY for each event in the final _common_clean file
| Quadrant A | 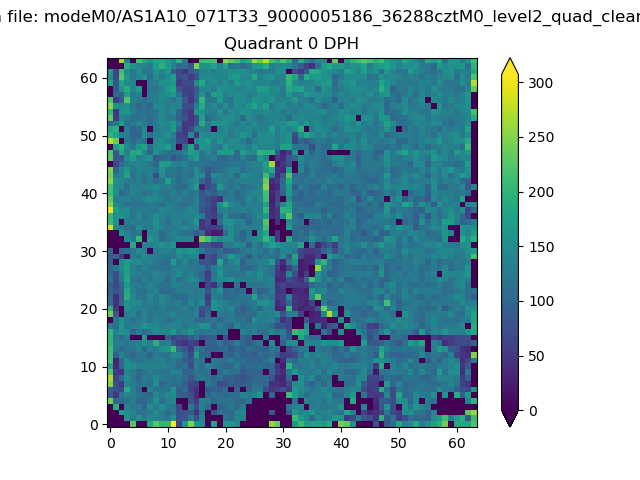 |
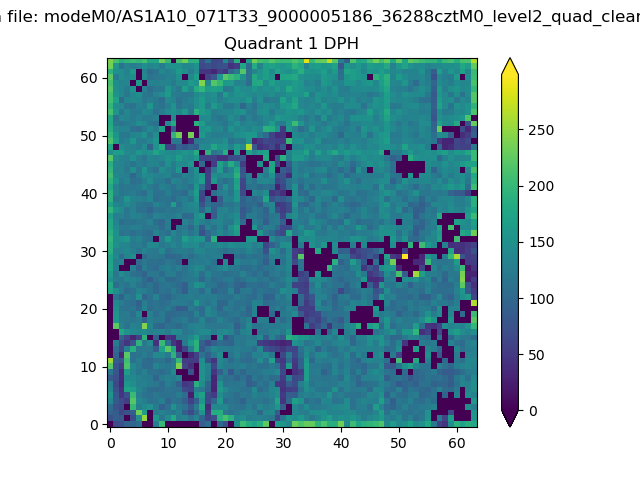 |
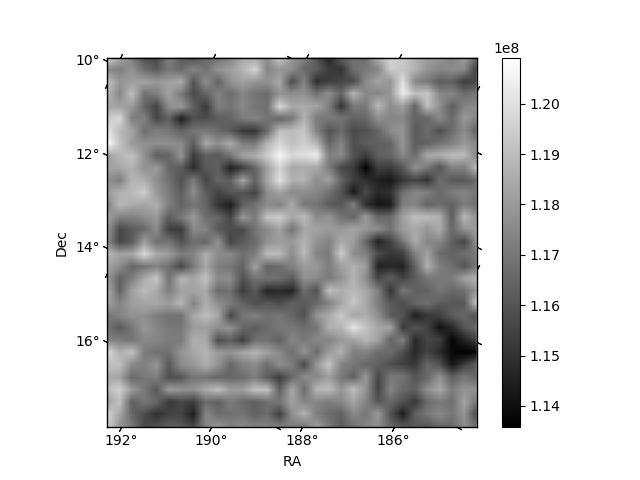
Quadrant B |
|---|---|---|---|
| Quadrant D | 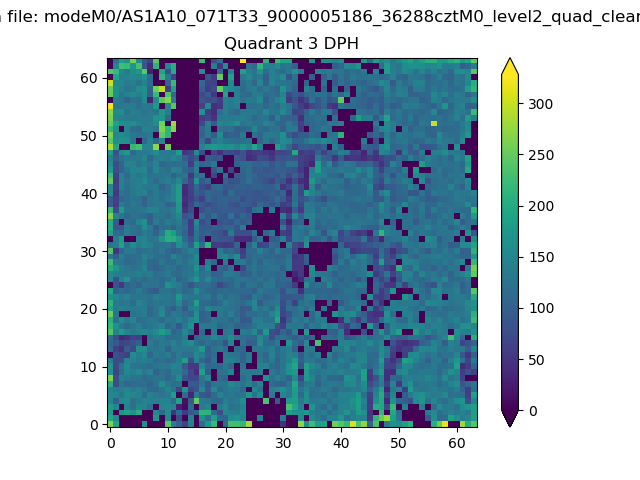 |
 |
Quadrant C |
| Plot type | Count rate plots | Images |
|---|---|---|
| Comparison with Poisson distribution Blue bars denote a histogram of data divided into 1 sec bins. Red curve is a Poisson curve with rate = median count rate of data. |
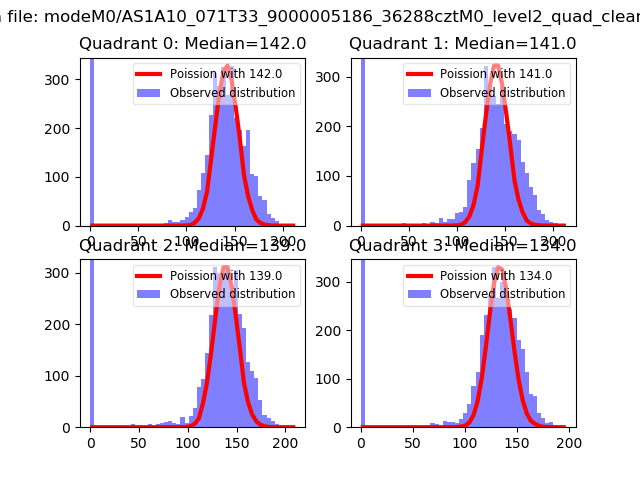 |
 |
| Quadrant-wise count rates Data is divided into 100 sec bins |
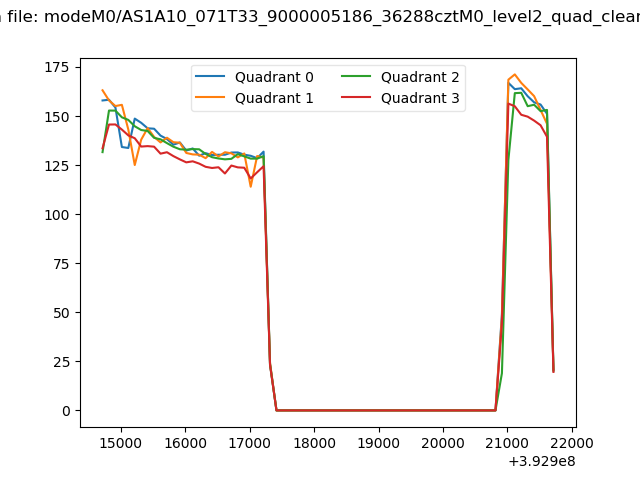 |
|
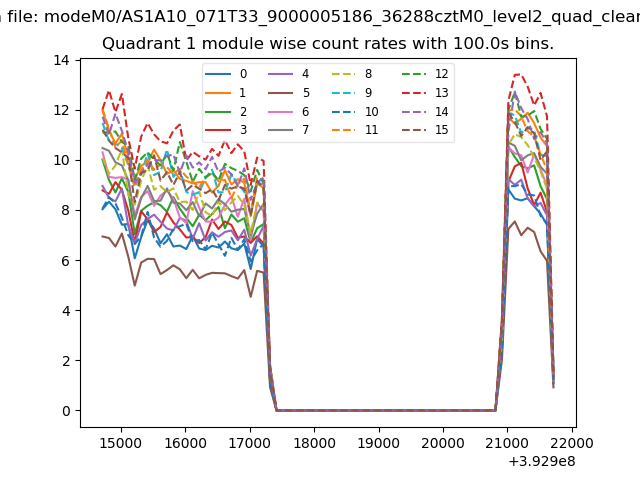
| Module-wise count rates for Quadrant A Data is divided into 100 sec bins |
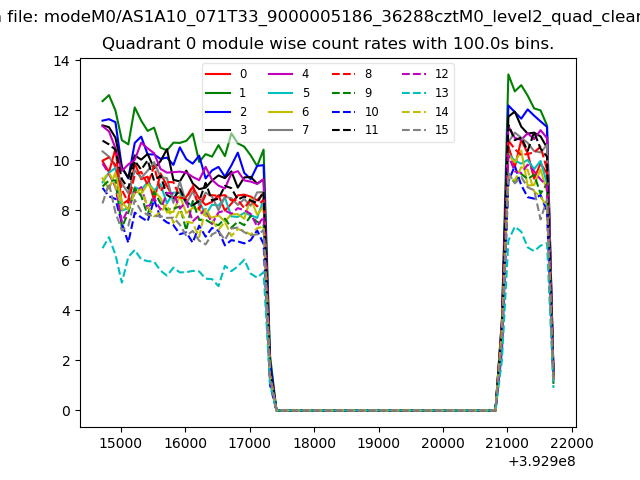 |
 |
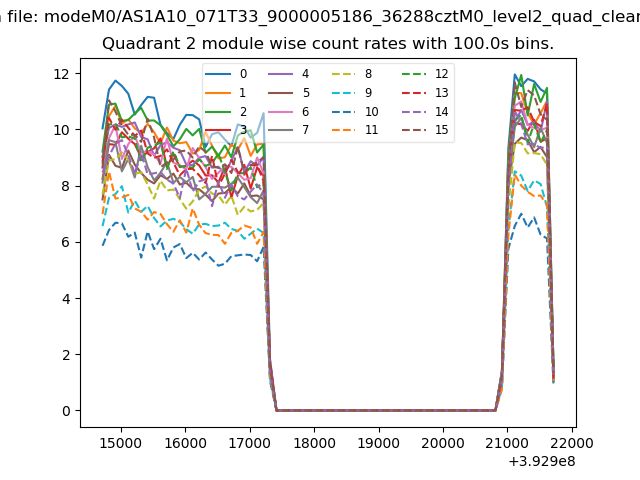
| Module-wise count rates for Quadrant B Data is divided into 100 sec bins |
 |
 |
| Module-wise count rates for Quadrant C Data is divided into 100 sec bins |
 |
 |
| Module-wise count rates for Quadrant D Data is divided into 100 sec bins |
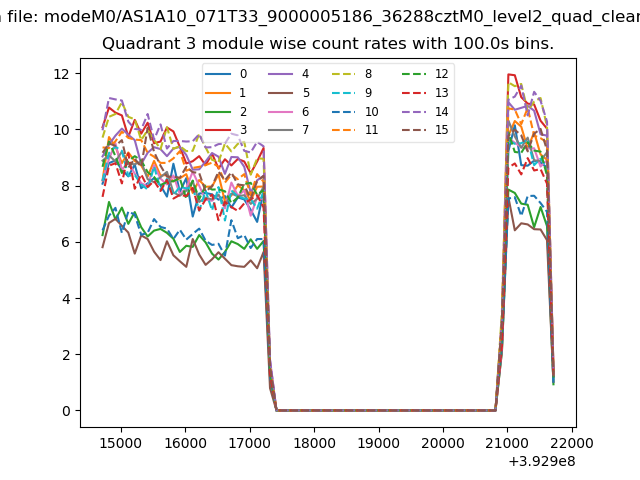 |
 |
| Parameter | Plot |
|---|---|
| CZT HV Monitor | 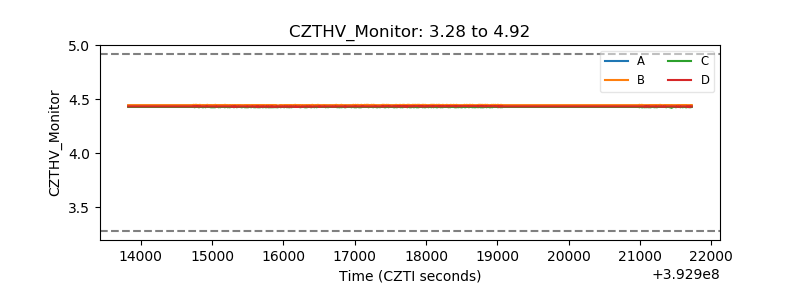 |
| D_VDD | 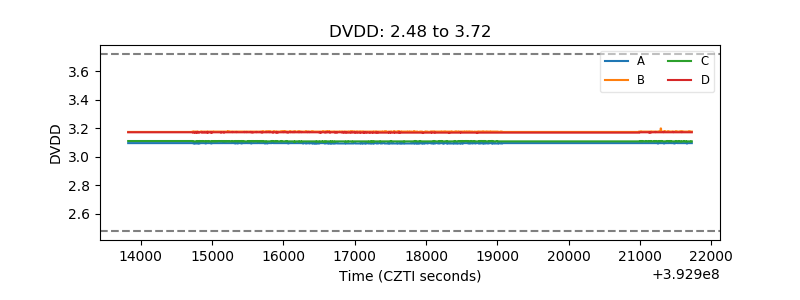 |
| Temperature 1 | 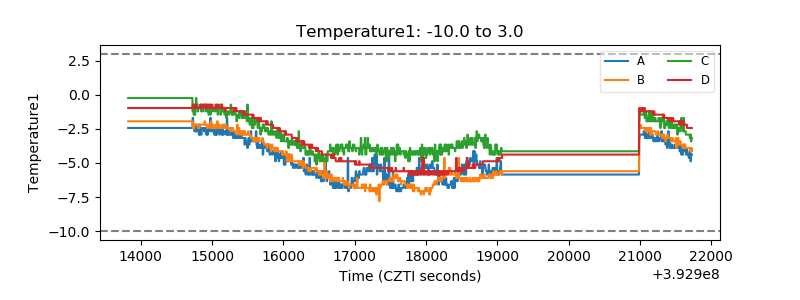 |
| Veto HV Monitor | 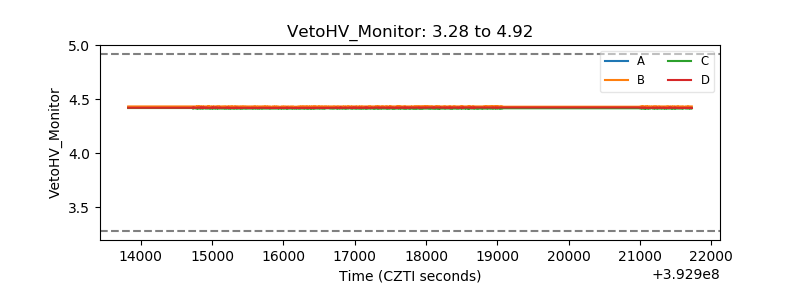 |
| Veto LLD | 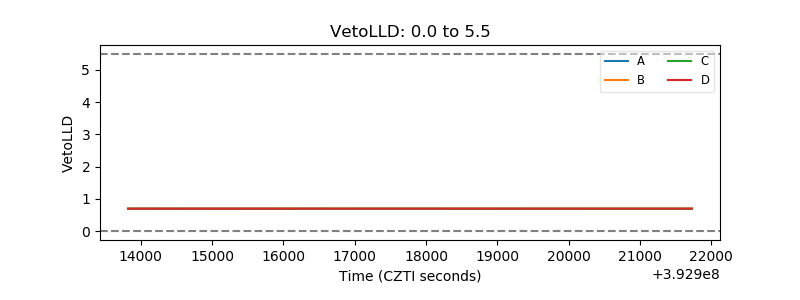 |
| Alpha Counter | 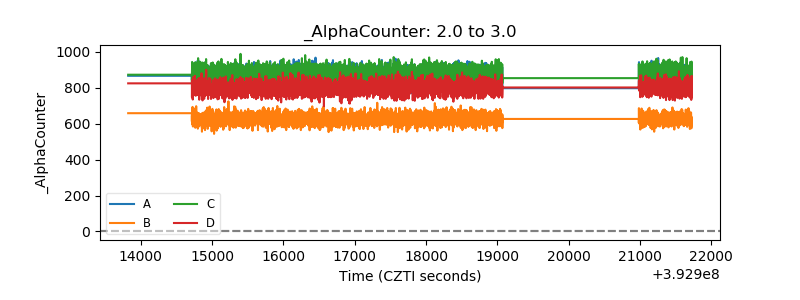 |
| _CPM_Rate | 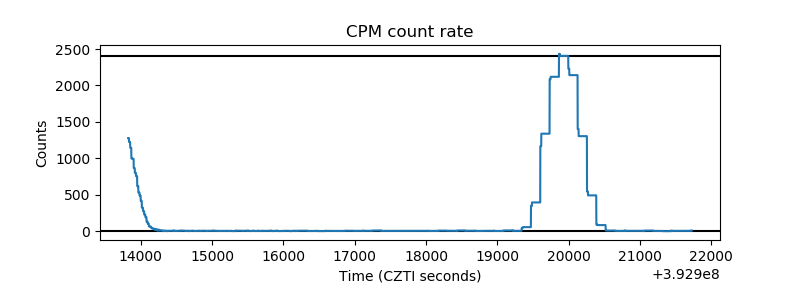 |
| CZT Counter | 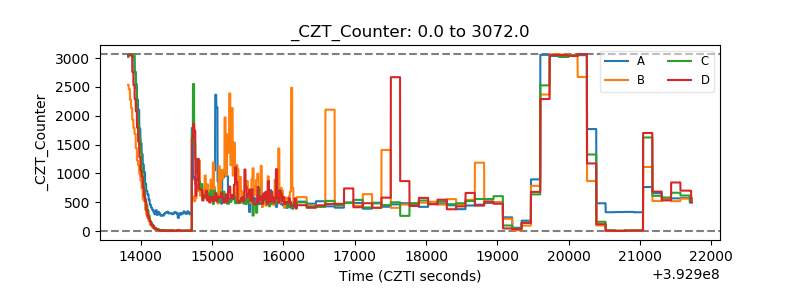 |
| +2.5 Volts monitor | 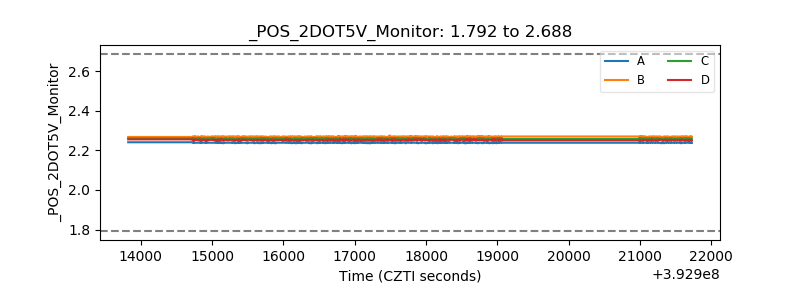 |
| +5 Volts monitor | 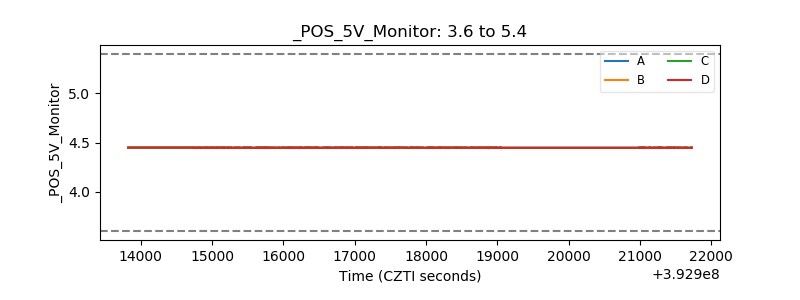 |
| _ROLL_ROT | 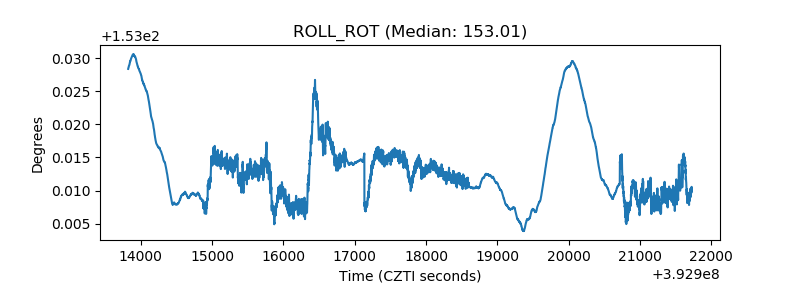 |
| _Roll_DEC | 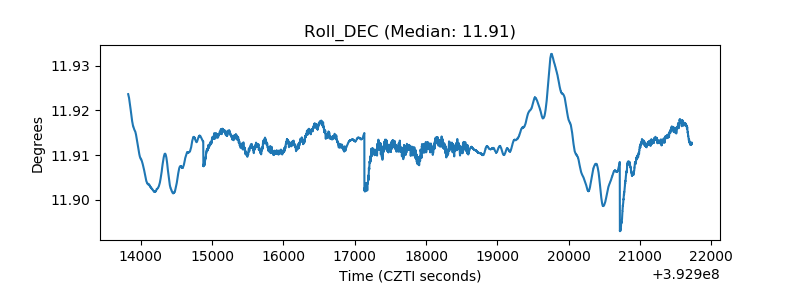 |
| _Roll_RA | 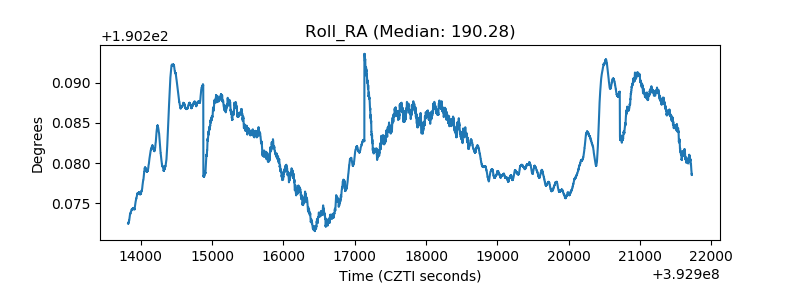 |
| Veto Counter |  |