| Param | Original file | Final file |
|---|---|---|
| Filename | modeM0/AS1A10_071T35_9000005184_36280cztM0_level2.evt | modeM0/AS1A10_071T35_9000005184_36280cztM0_level2_quad_clean.evt |
| Size (bytes) | 564,387,840 | 59,330,880 |
| Size | 538.2 MB | 56.6 MB |
| Events in quadrant A | 2,754,516 | 365,495 |
| Events in quadrant B | 3,473,826 | 358,226 |
| Events in quadrant C | 3,088,436 | 360,688 |
| Events in quadrant D | 7,390,281 | 313,906 |
| Mode M0 | |||
|---|---|---|---|
| Quadrant | BADHDUFLAG | Total packets | Discarded packets |
| A | 0 | 11665 | 3 |
| B | 0 | 14030 | 2 |
| C | 0 | 12466 | 2 |
| D | 0 | 25865 | 2 |
| Mode SS | |||
|---|---|---|---|
| Quadrant | BADHDUFLAG | Total packets | Discarded packets |
| A | 0 | 116 | 0 |
| B | 0 | 116 | 0 |
| C | 0 | 116 | 0 |
| D | 0 | 116 | 0 |
| Mode M9 | |||
|---|---|---|---|
| Quadrant | BADHDUFLAG | Total packets | Discarded packets |
| A | 0 | 17 | 0 |
| B | 0 | 17 | 0 |
| C | 0 | 17 | 0 |
| D | 0 | 18 | 0 |
| Quadrant | Total seconds | Saturated seconds | Saturation percentage |
|---|---|---|---|
| A | 5686 | 8 | 0.140696% |
| B | 5686 | 184 | 3.236018% |
| C | 5686 | 37 | 0.650721% |
| D | 5686 | 1412 | 24.832923% |
Noise dominated data is calculated using 1-second bins in cleaned event files. If a bin has >2000 counts, and if more than 50% of those come from <1% of pixels, then it is considered to be noise-dominated and hence unusable.
| Quadrant | # 1 sec bins | Bins with >0 counts | Bins with >2000 counts | High rate bins dominated by noise | Noise dominated (total time) | Noise dominated (detector-on time) | Marked lightcurve |
|---|---|---|---|---|---|---|---|
| A | 7028 | 5687 | 2 | 2 | 0.03% | 0.04% | 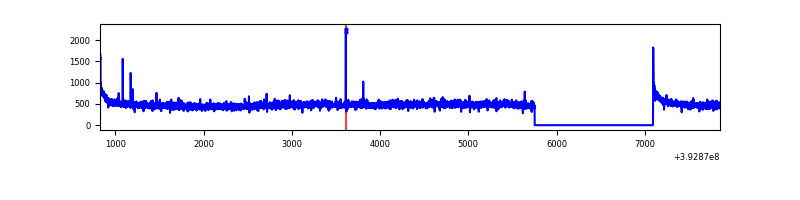 |
| B | 7028 | 5687 | 150 | 150 | 2.13% | 2.64% | 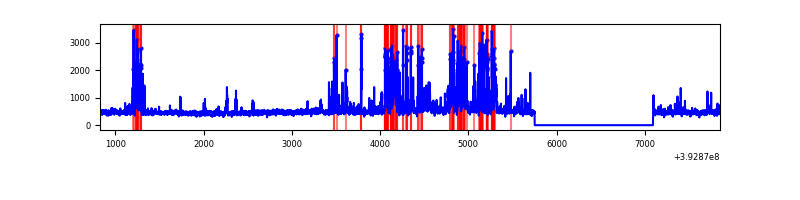 |
| C | 7028 | 5687 | 28 | 28 | 0.40% | 0.49% | 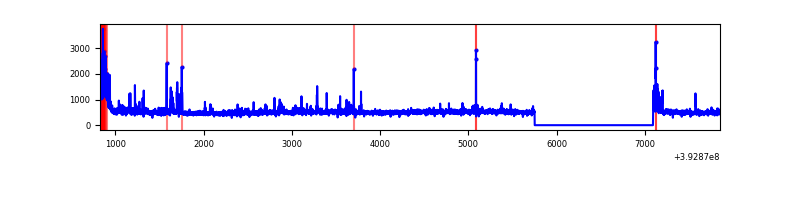 |
| D | 7028 | 5687 | 1378 | 1378 | 19.61% | 24.23% | 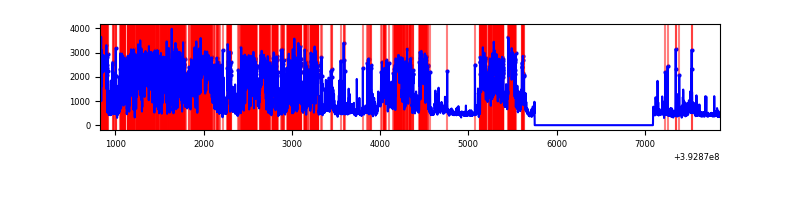 |
Top three noisy pixels from each quadrant. If the there are fewer than three noisy pixels in the level2.evt file, extra rows are filled as -1
| Pixel properties | Quadrant properties | ||||||
|---|---|---|---|---|---|---|---|
| Quadrant | DetID | PixID | Counts | Sigma | Mean | Median | Sigma |
| A | 10 | 83 | 183461 | 1375.84 | 656 | 643 | 132.9 |
| A | 13 | 6 | 19308 | 140.47 | 656 | 643 | 132.9 |
| A | 9 | 143 | 13523 | 96.93 | 656 | 643 | 132.9 |
| B | 5 | 172 | 561539 | 4478.93 | 645 | 627 | 125.2 |
| B | 5 | 236 | 151285 | 1203.02 | 645 | 627 | 125.2 |
| B | 8 | 128 | 102100 | 810.27 | 645 | 627 | 125.2 |
| C | 15 | 214 | 239747 | 1586.44 | 638 | 642 | 150.7 |
| C | 0 | 10 | 230623 | 1525.9 | 638 | 642 | 150.7 |
| C | 0 | 207 | 120485 | 795.15 | 638 | 642 | 150.7 |
| D | 12 | 6 | 2924781 | 20454.54 | 582 | 565 | 143.0 |
| D | 12 | 227 | 1503379 | 10512.0 | 582 | 565 | 143.0 |
| D | 13 | 249 | 453541 | 3168.51 | 582 | 565 | 143.0 |
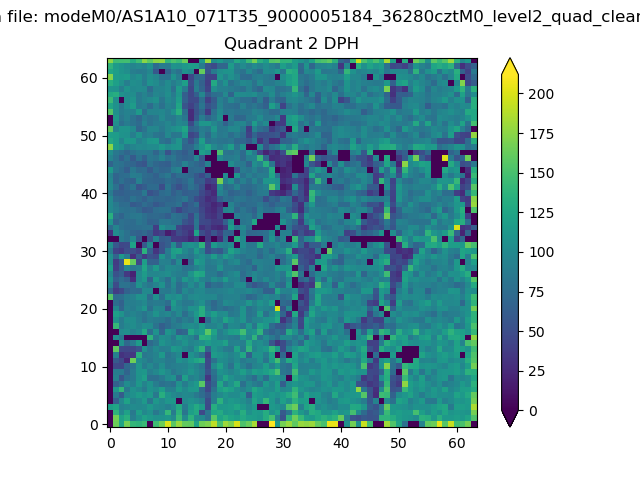
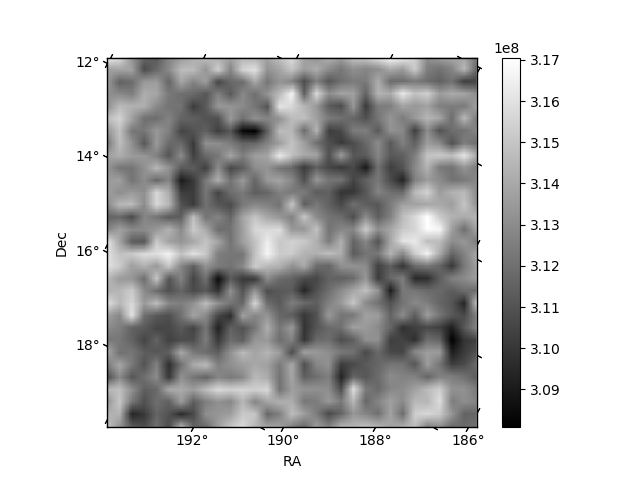
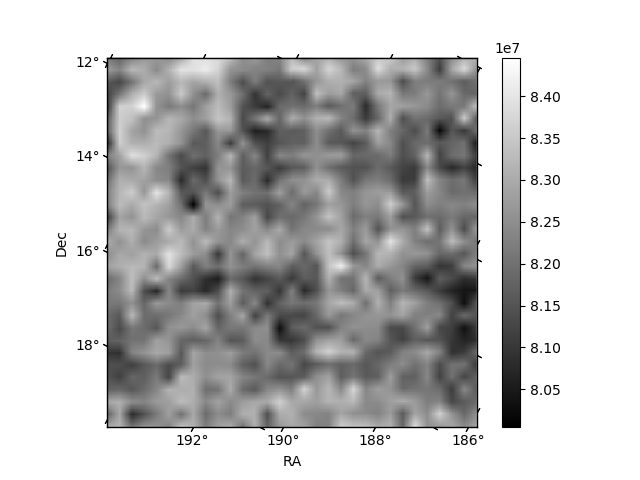
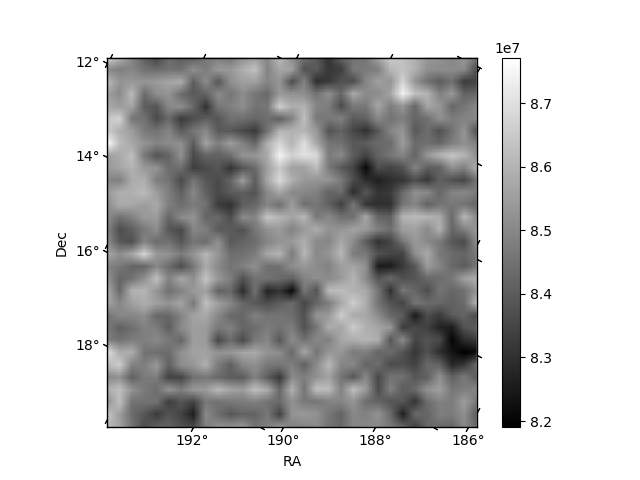
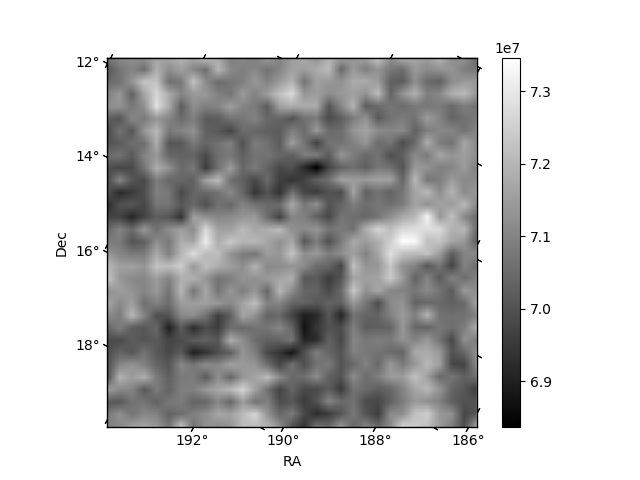
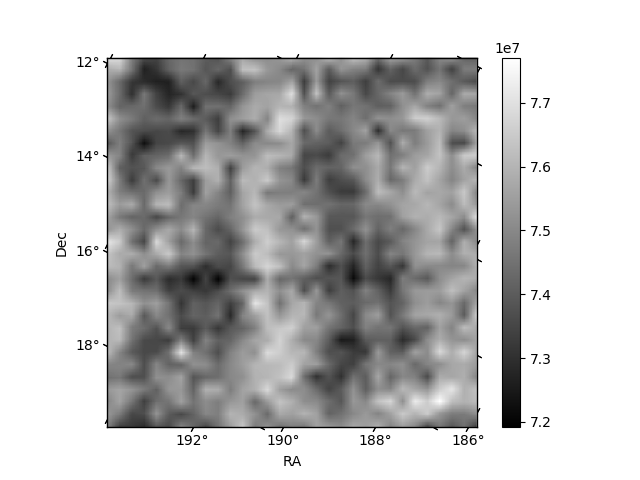
Histogram calculated using DETX and DETY for each event in the final _common_clean file
| Quadrant A | 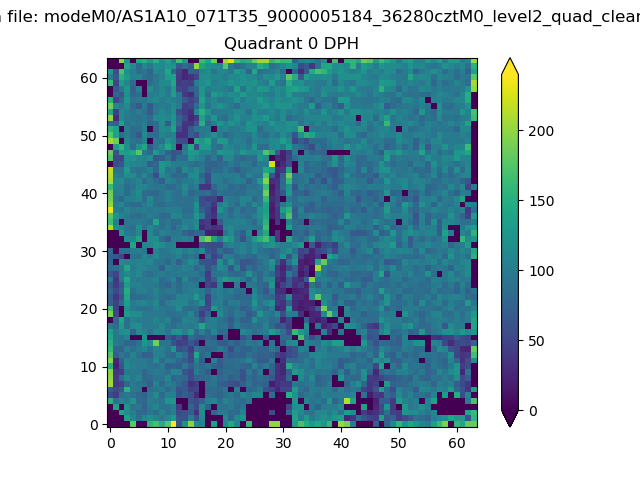 |
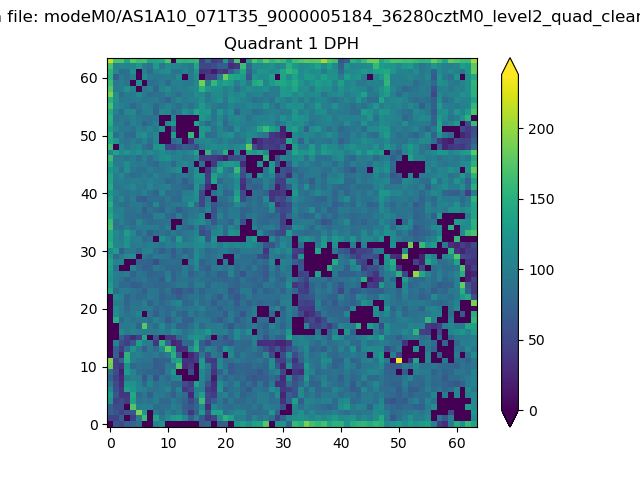 |
Quadrant B |
|---|---|---|---|
| Quadrant D | 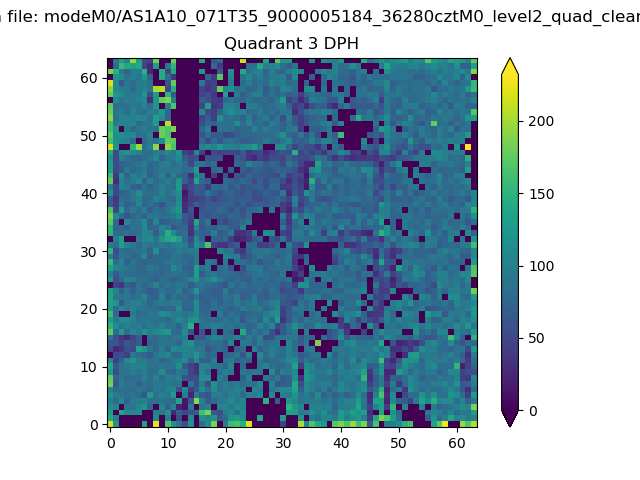 |
 |
Quadrant C |
| Plot type | Count rate plots | Images |
|---|---|---|
| Comparison with Poisson distribution Blue bars denote a histogram of data divided into 1 sec bins. Red curve is a Poisson curve with rate = median count rate of data. |
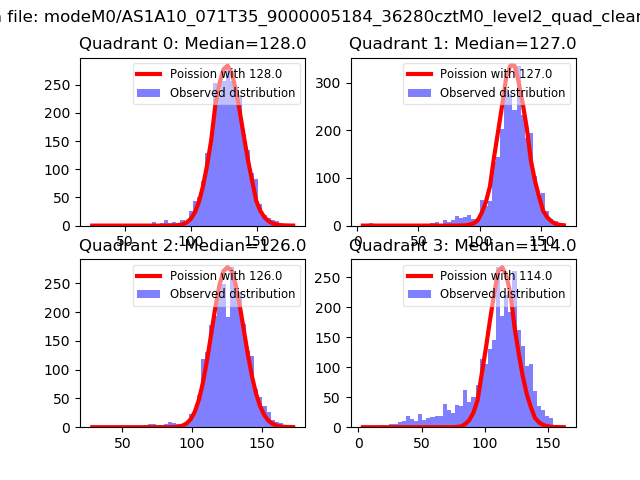 |
 |
| Quadrant-wise count rates Data is divided into 100 sec bins |
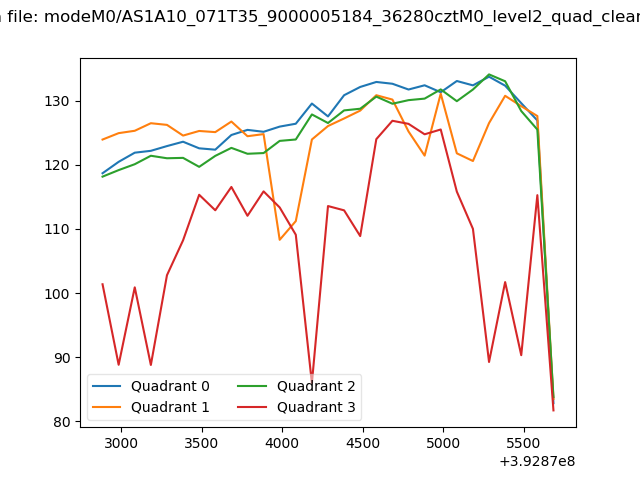 |
|
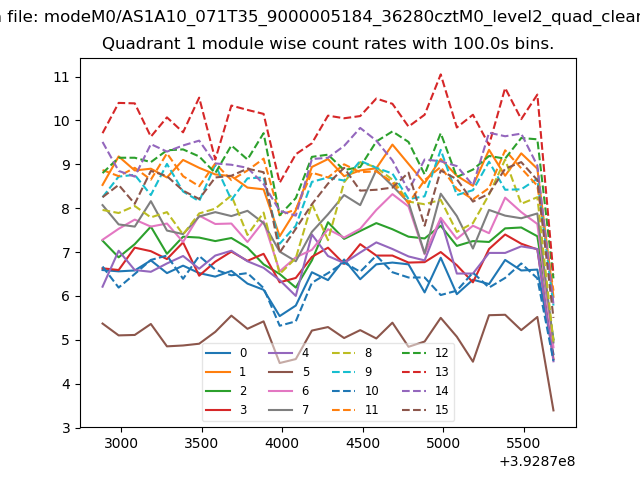
| Module-wise count rates for Quadrant A Data is divided into 100 sec bins |
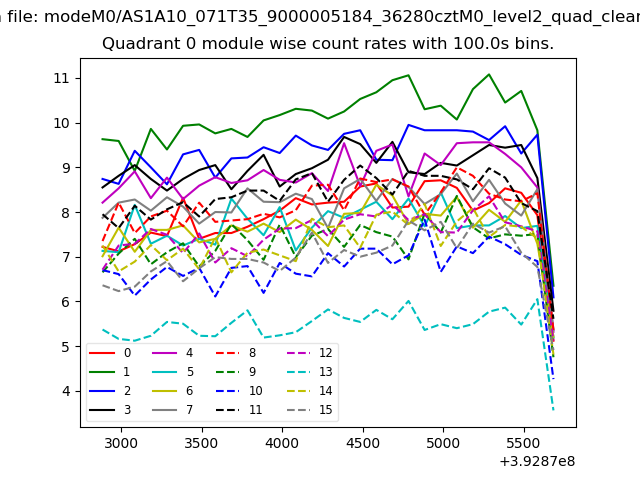 |
 |
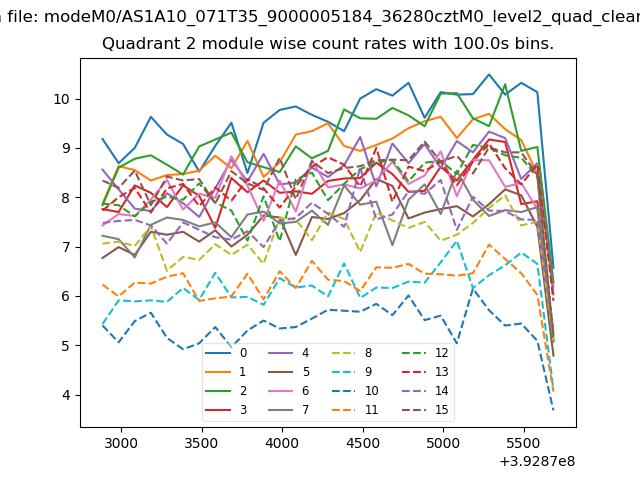
| Module-wise count rates for Quadrant B Data is divided into 100 sec bins |
 |
 |
| Module-wise count rates for Quadrant C Data is divided into 100 sec bins |
 |
 |
| Module-wise count rates for Quadrant D Data is divided into 100 sec bins |
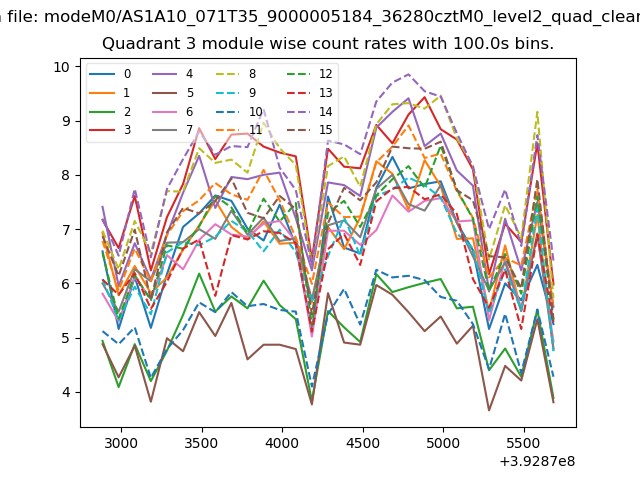 |
 |
| Parameter | Plot |
|---|---|
| CZT HV Monitor | 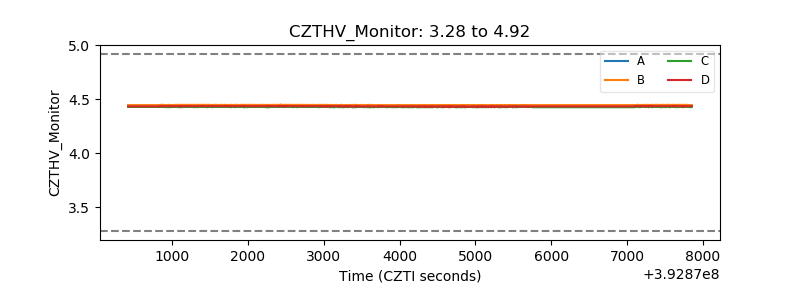 |
| D_VDD | 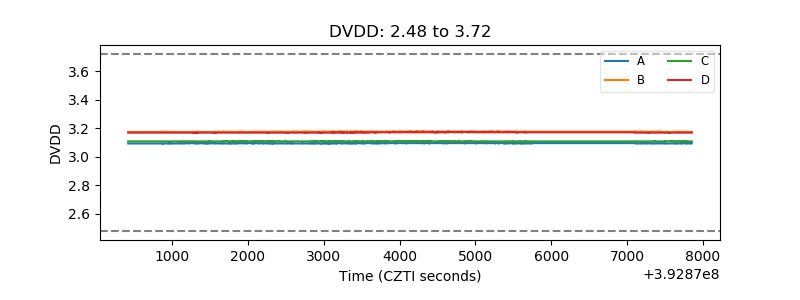 |
| Temperature 1 | 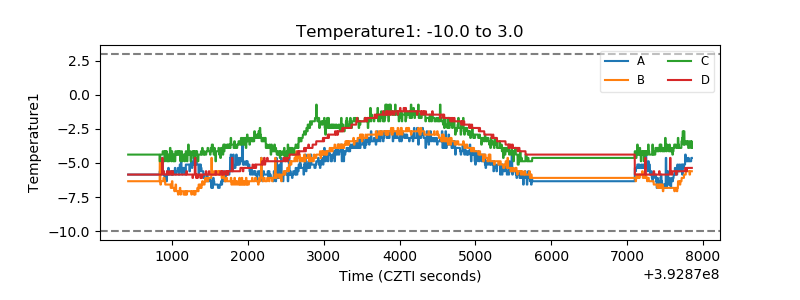 |
| Veto HV Monitor | 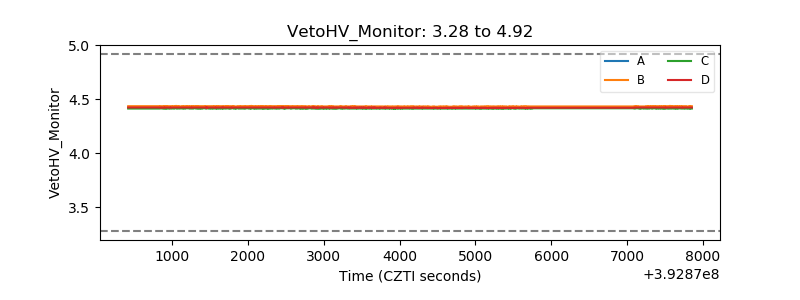 |
| Veto LLD | 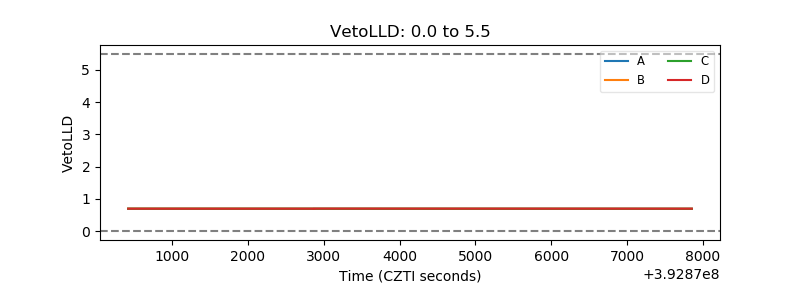 |
| Alpha Counter | 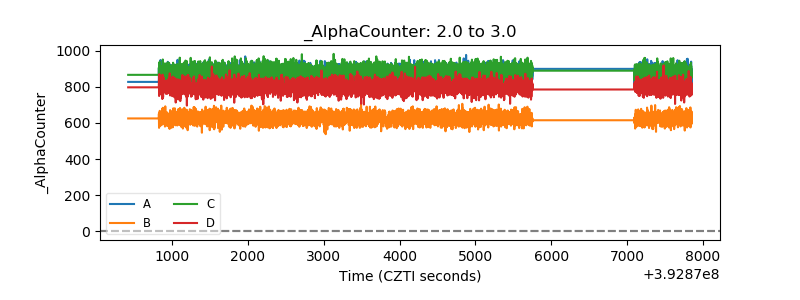 |
| _CPM_Rate | 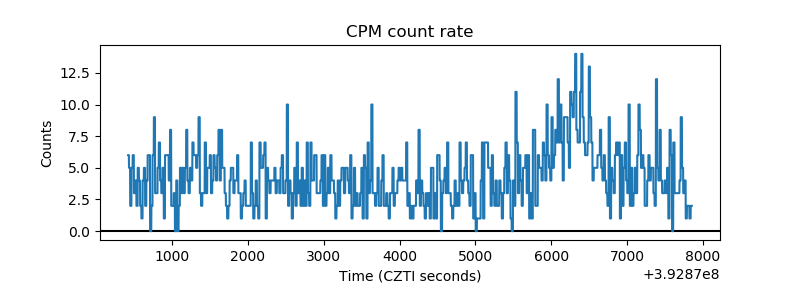 |
| CZT Counter | 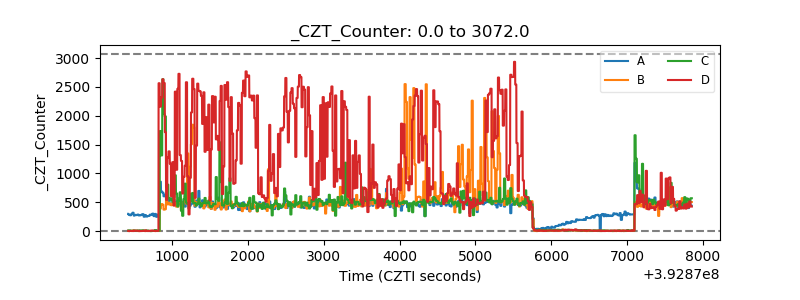 |
| +2.5 Volts monitor | 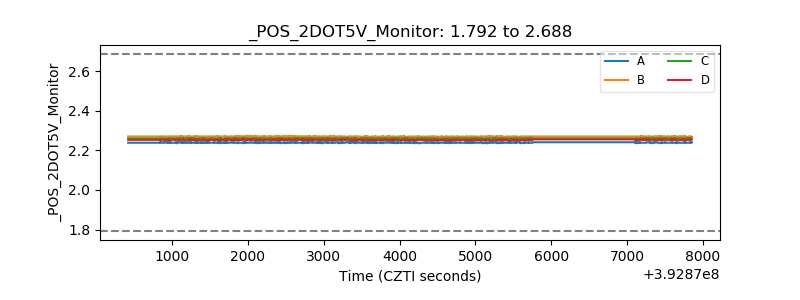 |
| +5 Volts monitor | 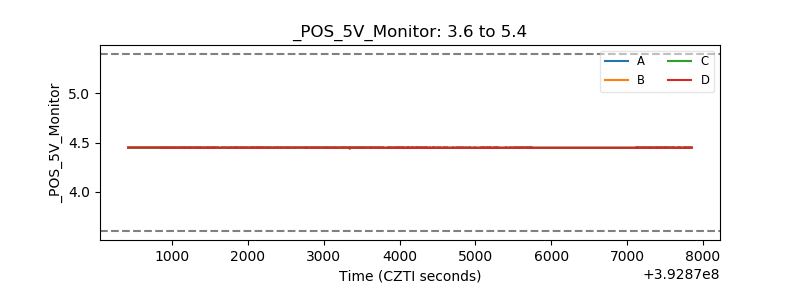 |
| _ROLL_ROT | 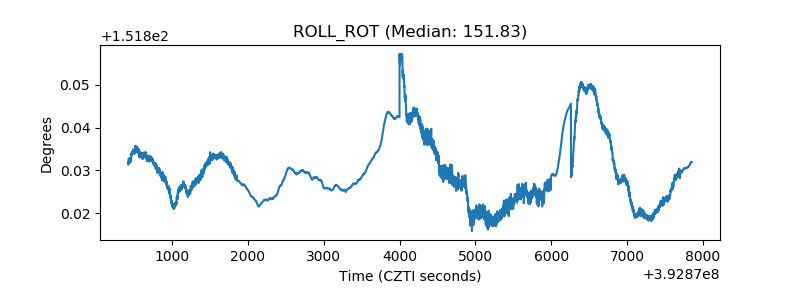 |
| _Roll_DEC | 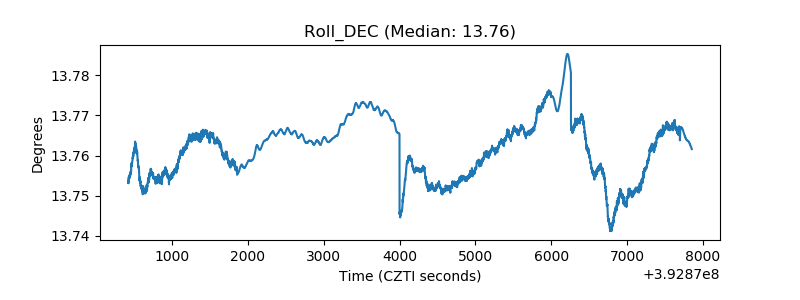 |
| _Roll_RA | 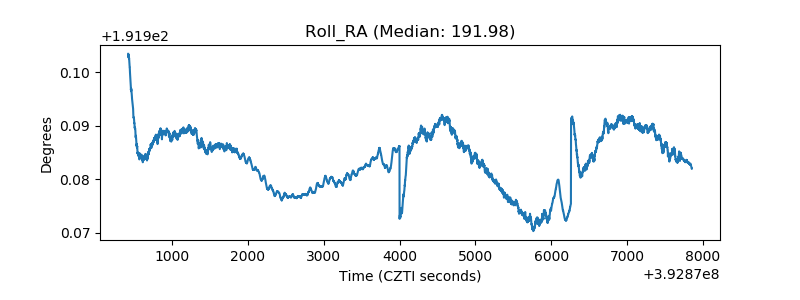 |
| Veto Counter | 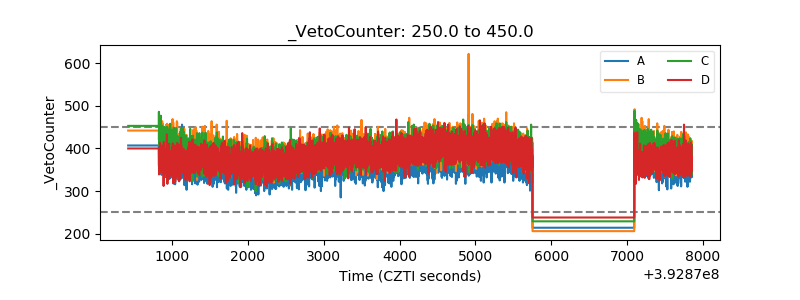 |