| Param | Original file | Final file |
|---|---|---|
| Filename | modeM0/AS1A10_071T35_9000005184_36279cztM0_level2.evt | modeM0/AS1A10_071T35_9000005184_36279cztM0_level2_quad_clean.evt |
| Size (bytes) | 571,098,240 | 58,417,920 |
| Size | 544.6 MB | 55.7 MB |
| Events in quadrant A | 2,851,262 | 356,281 |
| Events in quadrant B | 3,204,200 | 356,864 |
| Events in quadrant C | 3,508,910 | 337,186 |
| Events in quadrant D | 7,339,259 | 313,636 |
| Mode M0 | |||
|---|---|---|---|
| Quadrant | BADHDUFLAG | Total packets | Discarded packets |
| A | 0 | 11962 | 3 |
| B | 0 | 13191 | 2 |
| C | 0 | 13893 | 2 |
| D | 0 | 25643 | 2 |
| Mode SS | |||
|---|---|---|---|
| Quadrant | BADHDUFLAG | Total packets | Discarded packets |
| A | 0 | 118 | 0 |
| B | 0 | 118 | 0 |
| C | 0 | 118 | 0 |
| D | 0 | 118 | 0 |
| Mode M9 | |||
|---|---|---|---|
| Quadrant | BADHDUFLAG | Total packets | Discarded packets |
| A | 0 | 37 | 0 |
| B | 0 | 37 | 0 |
| C | 0 | 37 | 0 |
| D | 0 | 37 | 0 |
| Quadrant | Total seconds | Saturated seconds | Saturation percentage |
|---|---|---|---|
| A | 5791 | 10 | 0.172682% |
| B | 5791 | 95 | 1.640477% |
| C | 5791 | 167 | 2.883785% |
| D | 5791 | 1609 | 27.784493% |
Noise dominated data is calculated using 1-second bins in cleaned event files. If a bin has >2000 counts, and if more than 50% of those come from <1% of pixels, then it is considered to be noise-dominated and hence unusable.
| Quadrant | # 1 sec bins | Bins with >0 counts | Bins with >2000 counts | High rate bins dominated by noise | Noise dominated (total time) | Noise dominated (detector-on time) | Marked lightcurve |
|---|---|---|---|---|---|---|---|
| A | 9377 | 5793 | 1 | 1 | 0.01% | 0.02% | 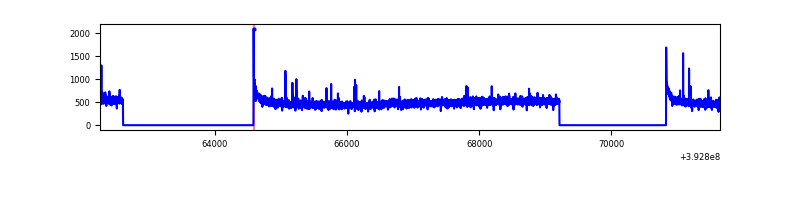 |
| B | 9377 | 5793 | 68 | 68 | 0.73% | 1.17% | 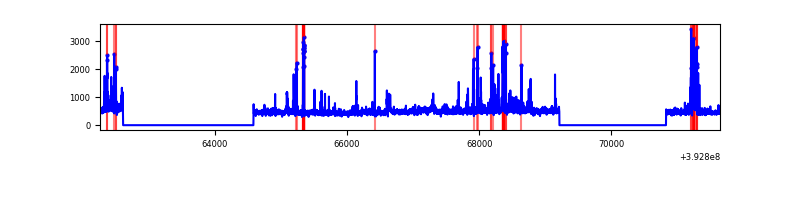 |
| C | 9377 | 5793 | 144 | 144 | 1.54% | 2.49% | 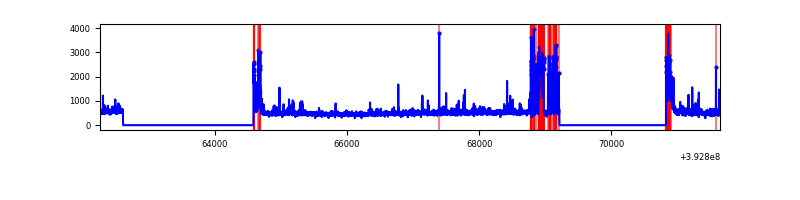 |
| D | 9377 | 5793 | 1548 | 1548 | 16.51% | 26.72% | 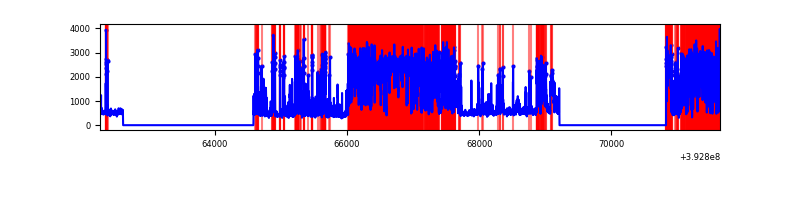 |
Top three noisy pixels from each quadrant. If the there are fewer than three noisy pixels in the level2.evt file, extra rows are filled as -1
| Pixel properties | Quadrant properties | ||||||
|---|---|---|---|---|---|---|---|
| Quadrant | DetID | PixID | Counts | Sigma | Mean | Median | Sigma |
| A | 10 | 83 | 185751 | 1338.28 | 678 | 665 | 138.3 |
| A | 13 | 6 | 22700 | 159.33 | 678 | 665 | 138.3 |
| A | 9 | 143 | 14162 | 97.59 | 678 | 665 | 138.3 |
| B | 5 | 172 | 245378 | 1895.31 | 670 | 652 | 129.1 |
| B | 5 | 236 | 172239 | 1328.88 | 670 | 652 | 129.1 |
| B | 8 | 128 | 92722 | 713.05 | 670 | 652 | 129.1 |
| C | 0 | 207 | 432371 | 2846.24 | 647 | 650 | 151.7 |
| C | 0 | 10 | 307084 | 2020.25 | 647 | 650 | 151.7 |
| C | 15 | 214 | 238746 | 1569.71 | 647 | 650 | 151.7 |
| D | 12 | 6 | 3511680 | 24996.92 | 572 | 556 | 140.5 |
| D | 13 | 249 | 969756 | 6900.07 | 572 | 556 | 140.5 |
| D | 2 | 153 | 380273 | 2703.33 | 572 | 556 | 140.5 |
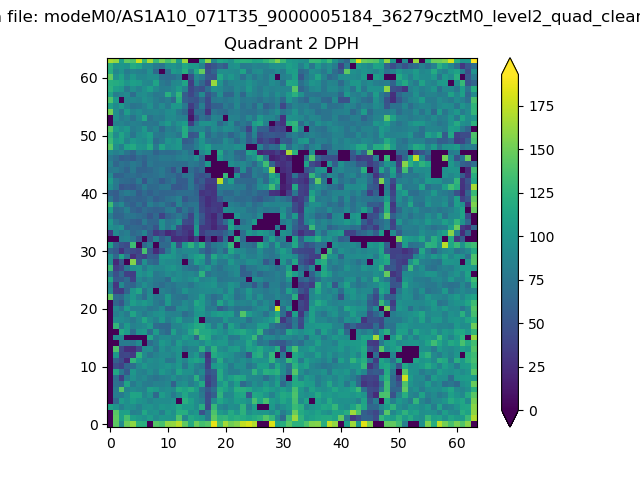
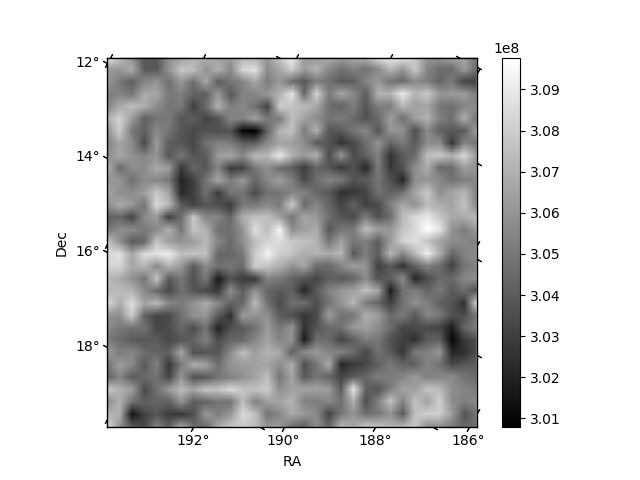
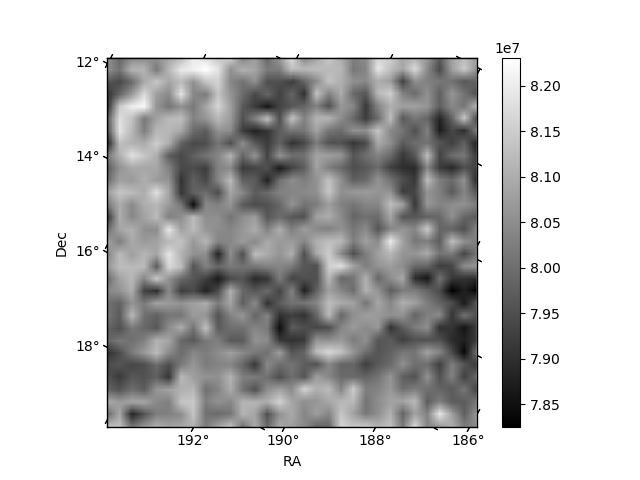
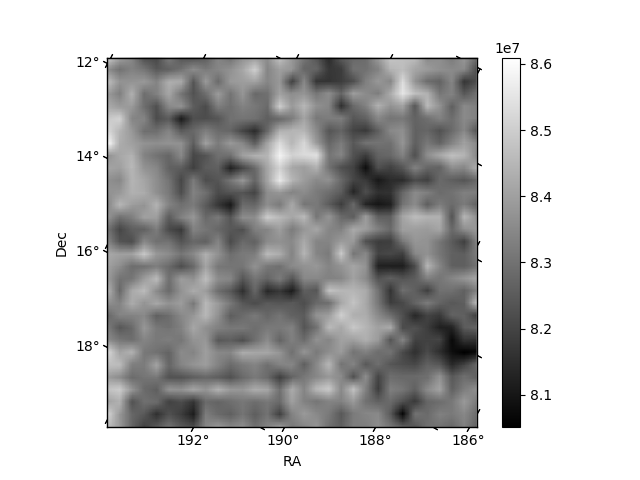
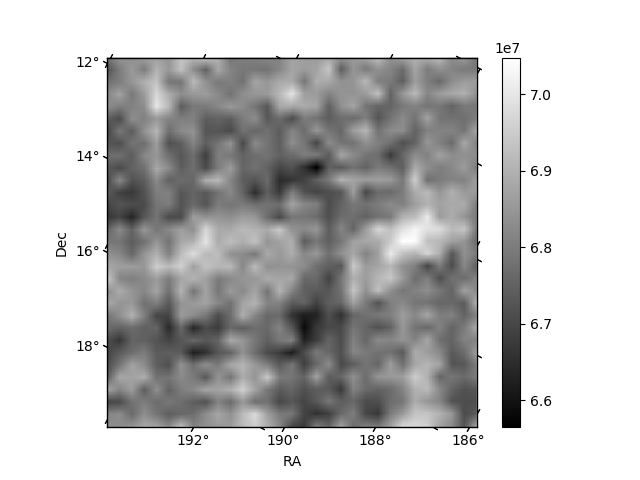
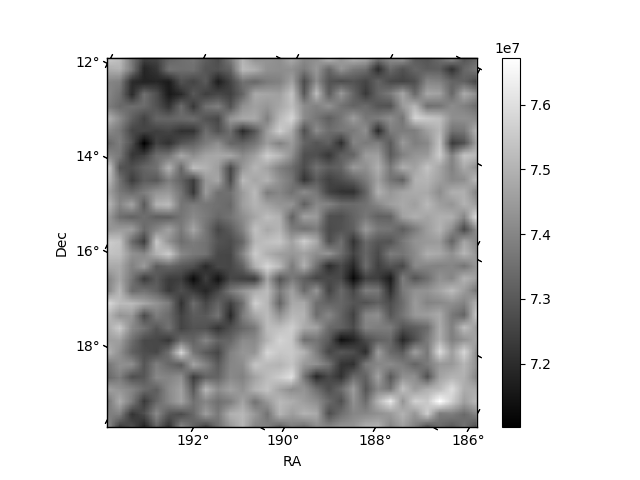
Histogram calculated using DETX and DETY for each event in the final _common_clean file
| Quadrant A | 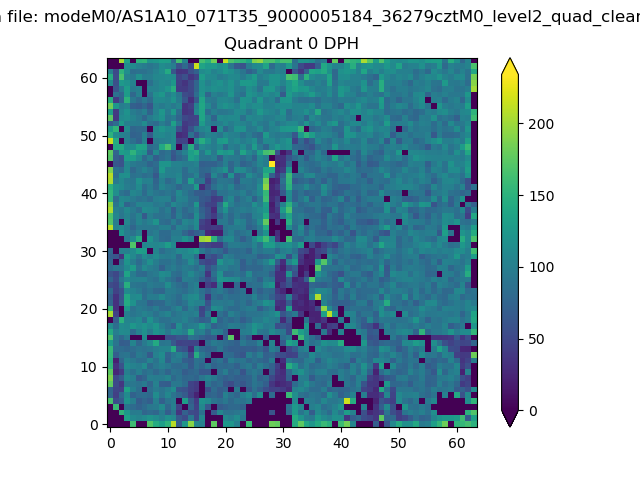 |
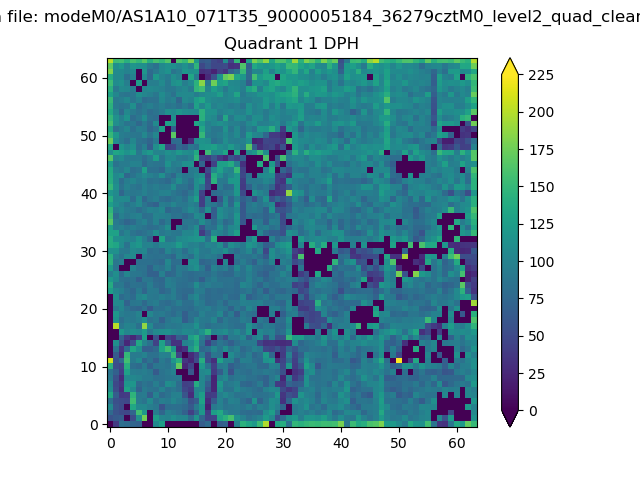 |
Quadrant B |
|---|---|---|---|
| Quadrant D | 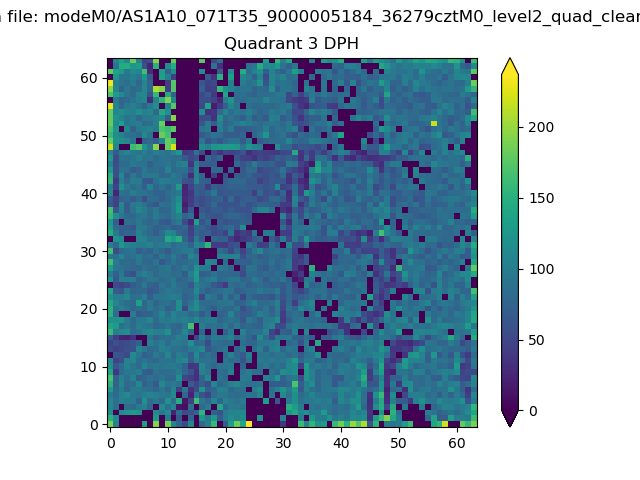 |
 |
Quadrant C |
| Plot type | Count rate plots | Images |
|---|---|---|
| Comparison with Poisson distribution Blue bars denote a histogram of data divided into 1 sec bins. Red curve is a Poisson curve with rate = median count rate of data. |
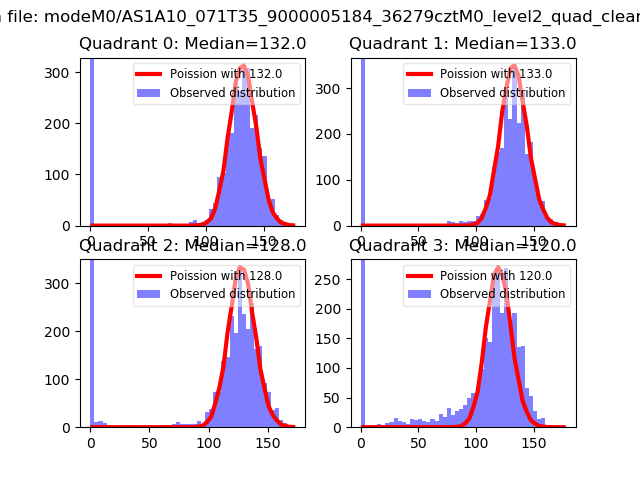 |
 |
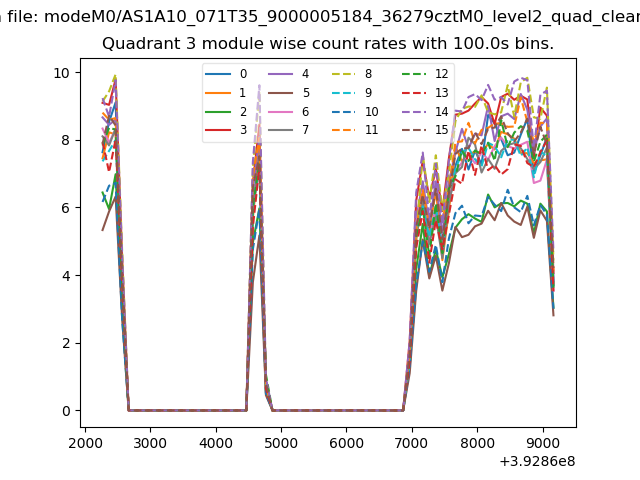
| Quadrant-wise count rates Data is divided into 100 sec bins |
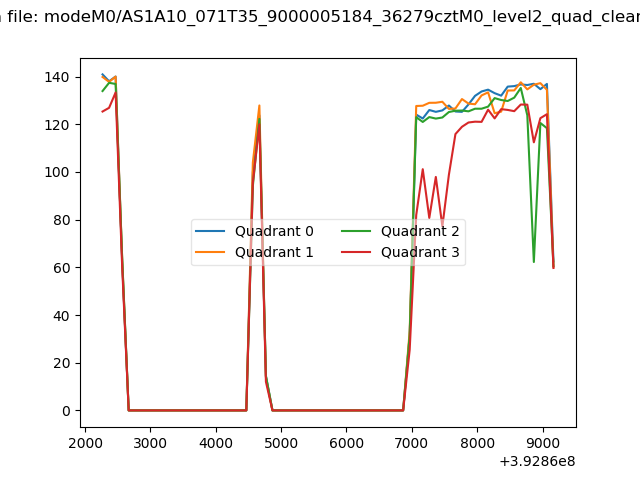 |
|
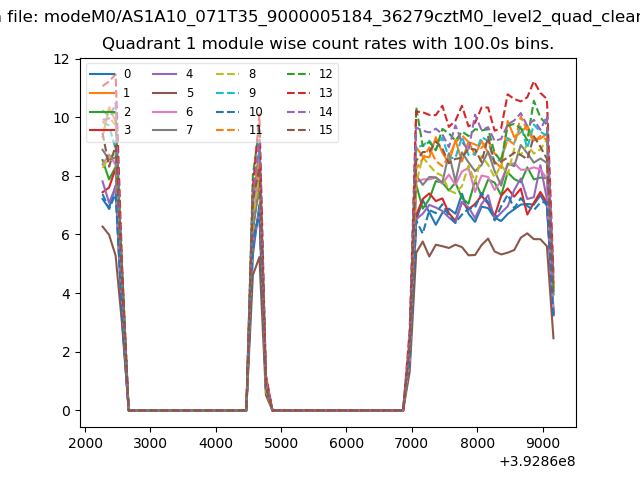
| Module-wise count rates for Quadrant A Data is divided into 100 sec bins |
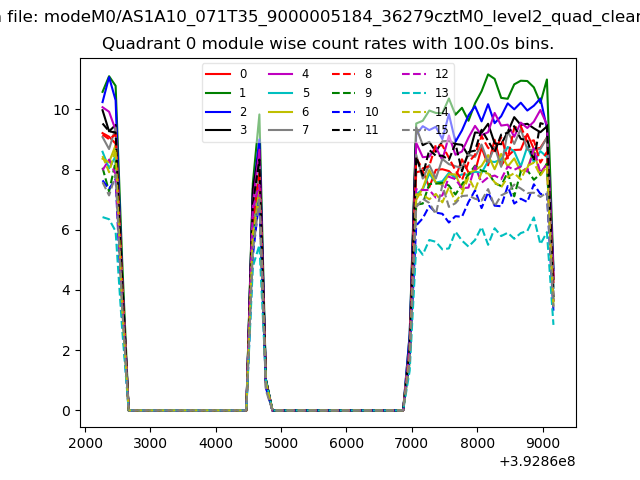 |
 |
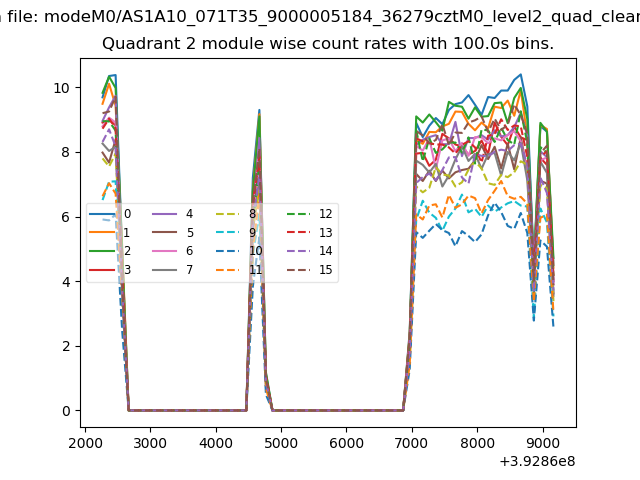
| Module-wise count rates for Quadrant B Data is divided into 100 sec bins |
 |
 |
| Module-wise count rates for Quadrant C Data is divided into 100 sec bins |
 |
 |
| Module-wise count rates for Quadrant D Data is divided into 100 sec bins |
 |
 |
| Parameter | Plot |
|---|---|
| CZT HV Monitor | 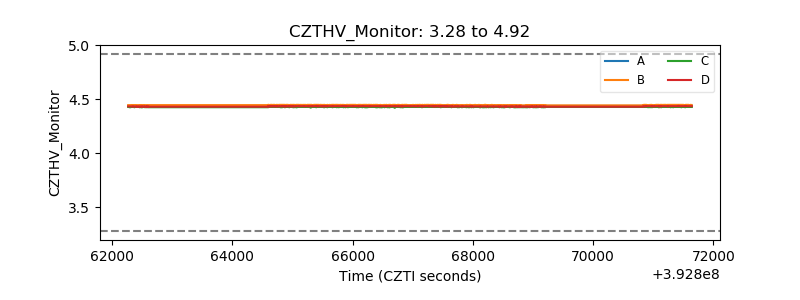 |
| D_VDD | 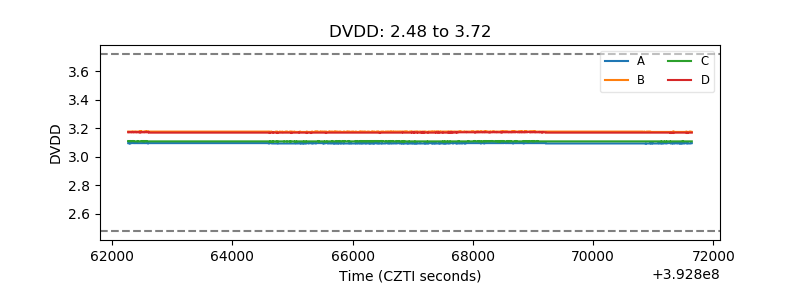 |
| Temperature 1 | 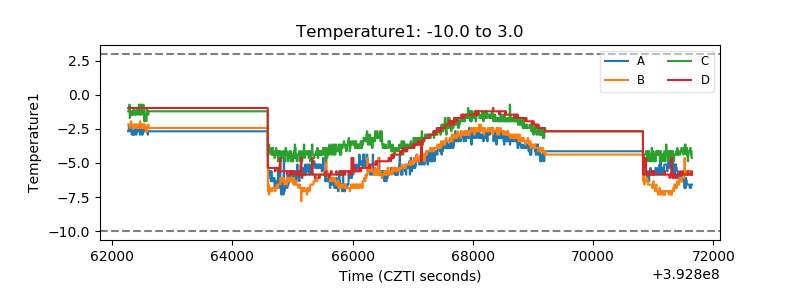 |
| Veto HV Monitor | 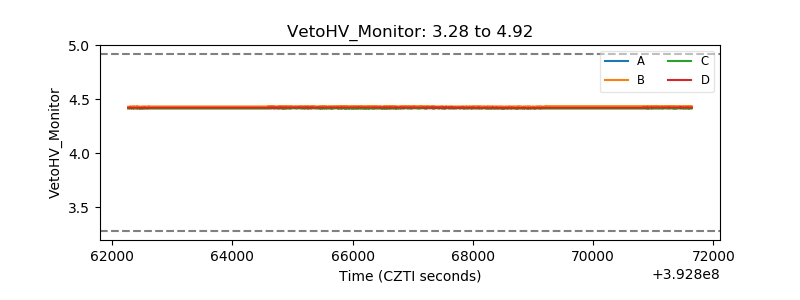 |
| Veto LLD | 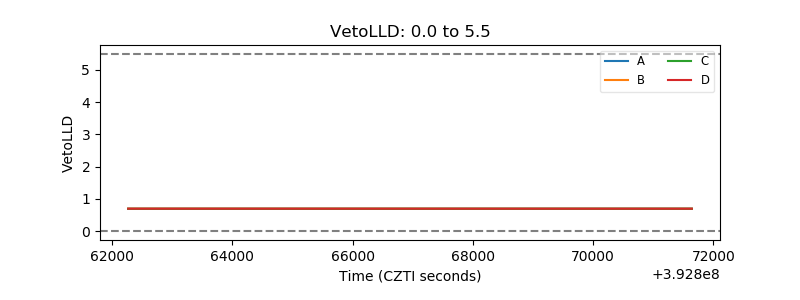 |
| Alpha Counter | 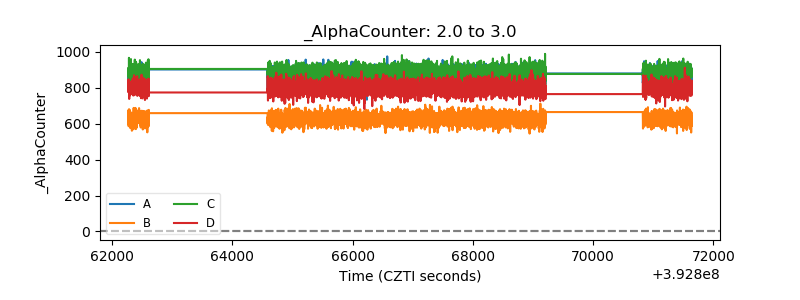 |
| _CPM_Rate | 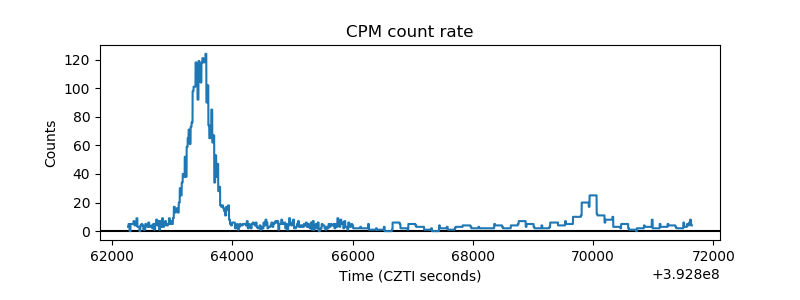 |
| CZT Counter | 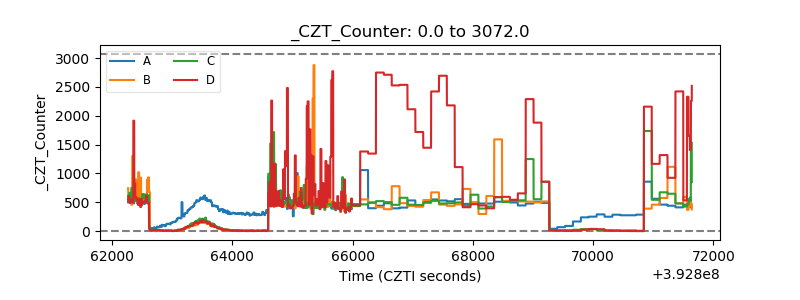 |
| +2.5 Volts monitor | 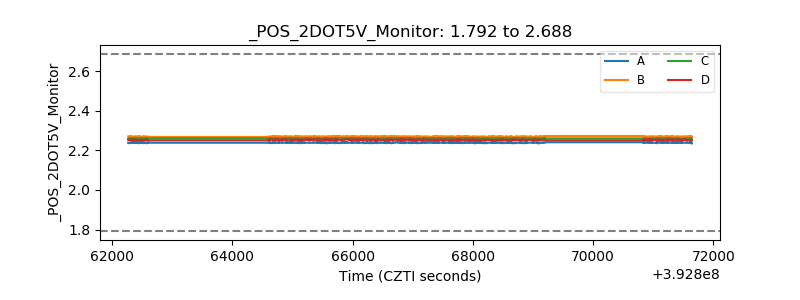 |
| +5 Volts monitor | 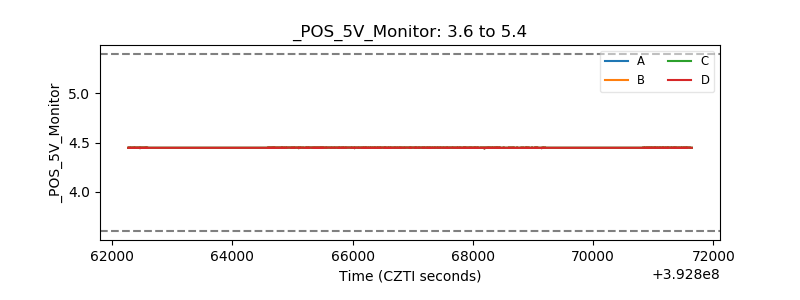 |
| _ROLL_ROT | 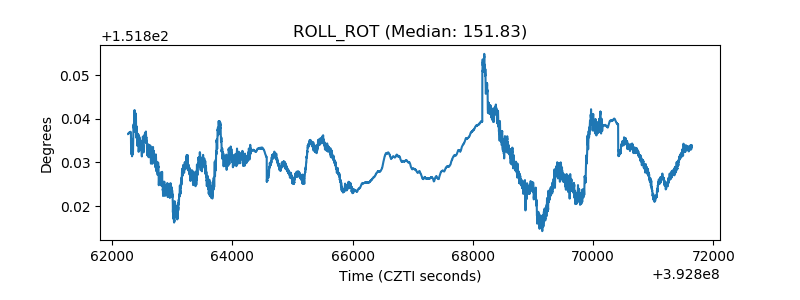 |
| _Roll_DEC | 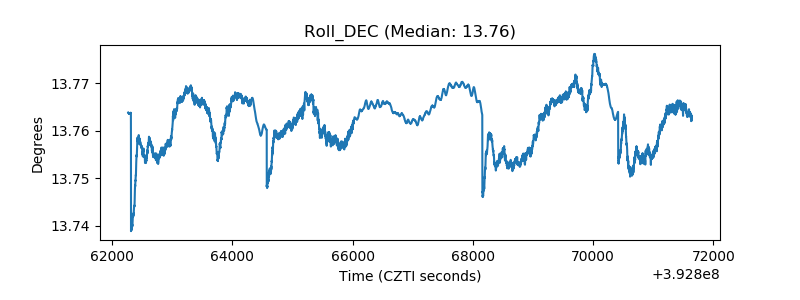 |
| _Roll_RA | 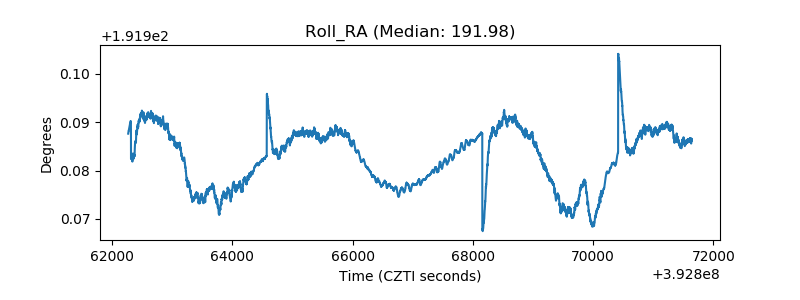 |
| Veto Counter | 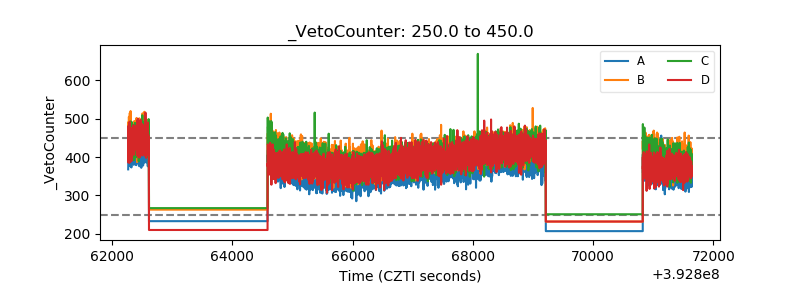 |