| Param | Original file | Final file |
|---|---|---|
| Filename | modeM0/AS1A10_071T35_9000005184_36278cztM0_level2.evt | modeM0/AS1A10_071T35_9000005184_36278cztM0_level2_quad_clean.evt |
| Size (bytes) | 415,811,520 | 50,215,680 |
| Size | 396.5 MB | 47.9 MB |
| Events in quadrant A | 2,513,572 | 297,026 |
| Events in quadrant B | 3,148,463 | 301,158 |
| Events in quadrant C | 2,948,198 | 289,210 |
| Events in quadrant D | 3,635,945 | 275,175 |
| Mode M0 | |||
|---|---|---|---|
| Quadrant | BADHDUFLAG | Total packets | Discarded packets |
| A | 0 | 10612 | 3 |
| B | 0 | 12593 | 2 |
| C | 0 | 11776 | 2 |
| D | 0 | 14248 | 2 |
| Mode SS | |||
|---|---|---|---|
| Quadrant | BADHDUFLAG | Total packets | Discarded packets |
| A | 0 | 106 | 0 |
| B | 0 | 106 | 0 |
| C | 0 | 106 | 0 |
| D | 0 | 106 | 0 |
| Mode M9 | |||
|---|---|---|---|
| Quadrant | BADHDUFLAG | Total packets | Discarded packets |
| A | 0 | 41 | 0 |
| B | 0 | 41 | 0 |
| C | 0 | 41 | 0 |
| D | 0 | 41 | 0 |
| Quadrant | Total seconds | Saturated seconds | Saturation percentage |
|---|---|---|---|
| A | 5101 | 6 | 0.117624% |
| B | 5101 | 184 | 3.607136% |
| C | 5101 | 90 | 1.764360% |
| D | 5101 | 288 | 5.645952% |
Noise dominated data is calculated using 1-second bins in cleaned event files. If a bin has >2000 counts, and if more than 50% of those come from <1% of pixels, then it is considered to be noise-dominated and hence unusable.
| Quadrant | # 1 sec bins | Bins with >0 counts | Bins with >2000 counts | High rate bins dominated by noise | Noise dominated (total time) | Noise dominated (detector-on time) | Marked lightcurve |
|---|---|---|---|---|---|---|---|
| A | 9197 | 5103 | 1 | 1 | 0.01% | 0.02% | 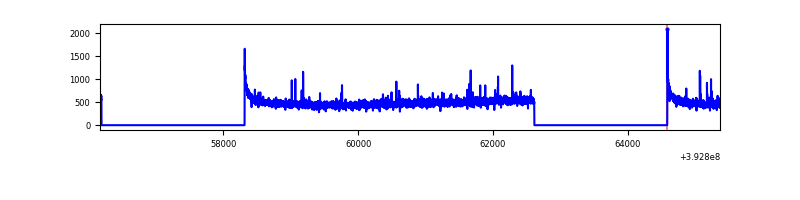 |
| B | 9197 | 5103 | 139 | 139 | 1.51% | 2.72% | 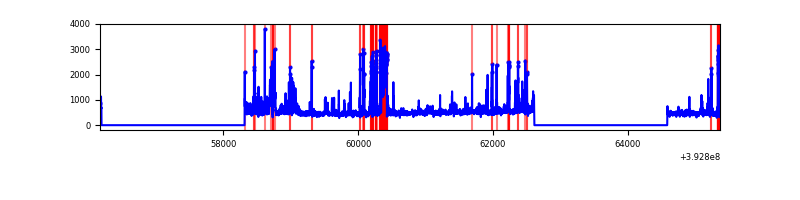 |
| C | 9197 | 5103 | 84 | 84 | 0.91% | 1.65% | 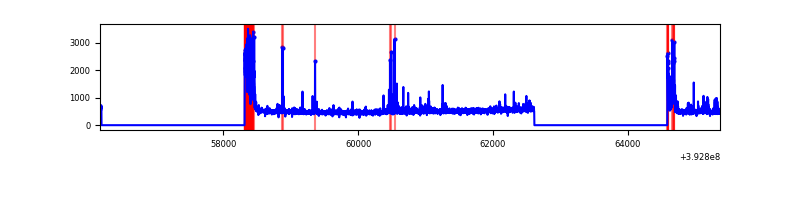 |
| D | 9197 | 5103 | 257 | 257 | 2.79% | 5.04% | 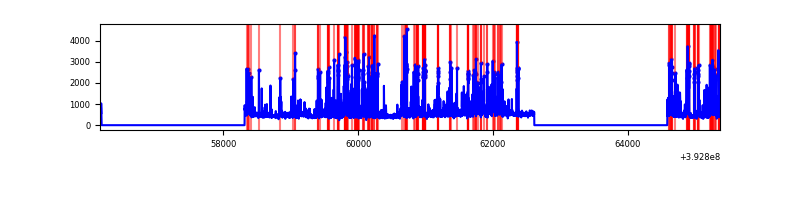 |
Top three noisy pixels from each quadrant. If the there are fewer than three noisy pixels in the level2.evt file, extra rows are filled as -1
| Pixel properties | Quadrant properties | ||||||
|---|---|---|---|---|---|---|---|
| Quadrant | DetID | PixID | Counts | Sigma | Mean | Median | Sigma |
| A | 10 | 83 | 171191 | 1397.67 | 597 | 587 | 122.1 |
| A | 13 | 248 | 12934 | 101.15 | 597 | 587 | 122.1 |
| A | 9 | 143 | 10715 | 82.97 | 597 | 587 | 122.1 |
| B | 8 | 128 | 309668 | 2734.73 | 588 | 573 | 113.0 |
| B | 5 | 172 | 245915 | 2170.67 | 588 | 573 | 113.0 |
| B | 5 | 236 | 183035 | 1614.34 | 588 | 573 | 113.0 |
| C | 0 | 10 | 418750 | 3090.24 | 577 | 582 | 135.3 |
| C | 15 | 214 | 213887 | 1576.31 | 577 | 582 | 135.3 |
| C | 0 | 207 | 65660 | 480.92 | 577 | 582 | 135.3 |
| D | 12 | 6 | 561333 | 4051.21 | 561 | 545 | 138.4 |
| D | 13 | 249 | 441831 | 3187.91 | 561 | 545 | 138.4 |
| D | 13 | 171 | 114932 | 826.35 | 561 | 545 | 138.4 |
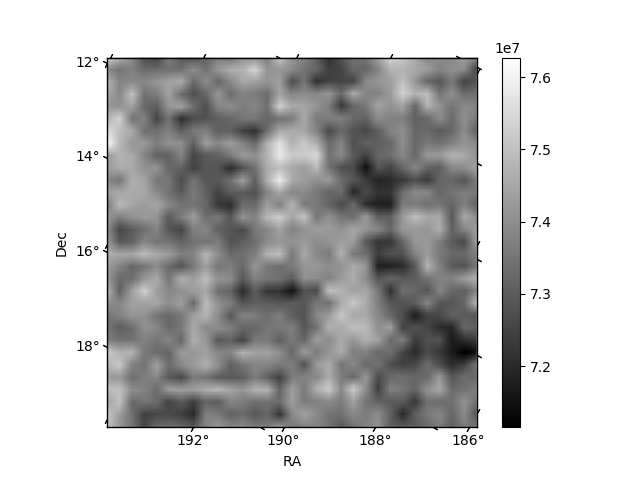
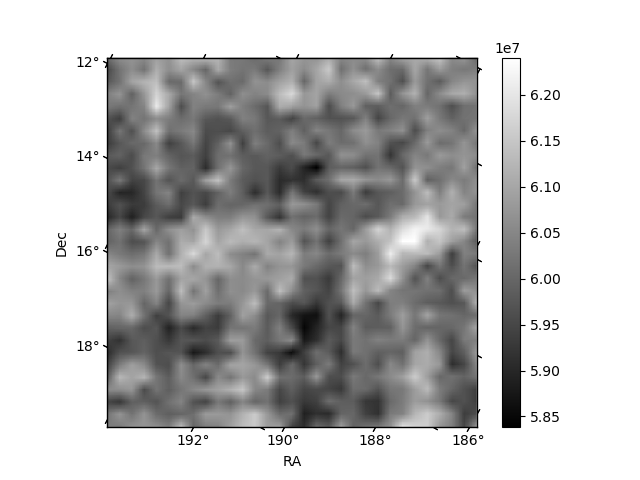
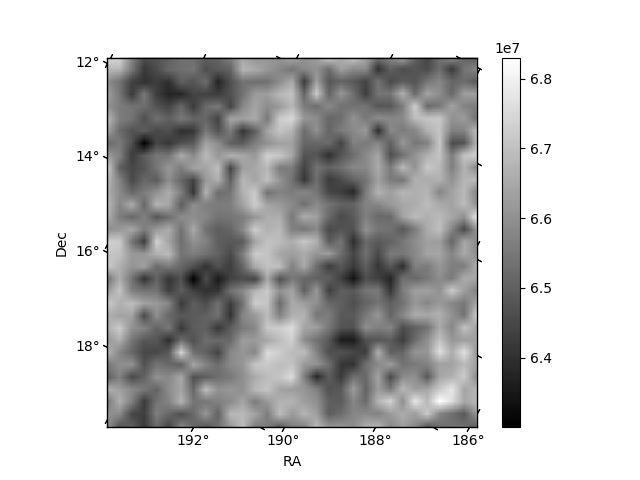
Histogram calculated using DETX and DETY for each event in the final _common_clean file
| Quadrant A | 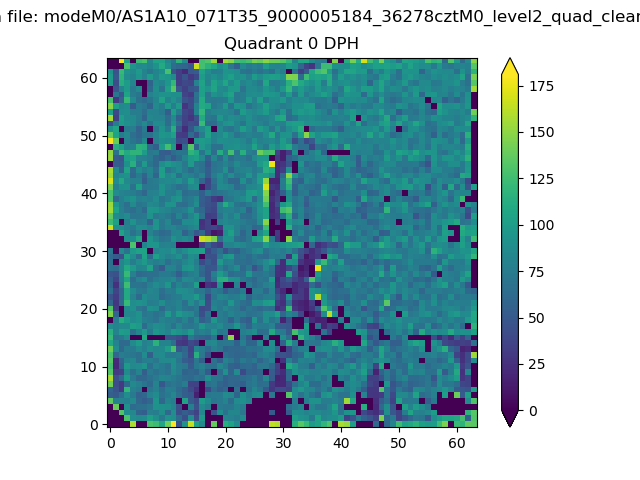 |
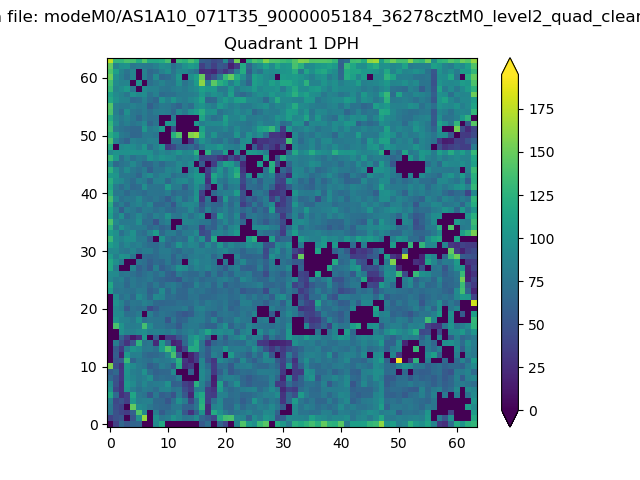 |
Quadrant B |
|---|---|---|---|
| Quadrant D | 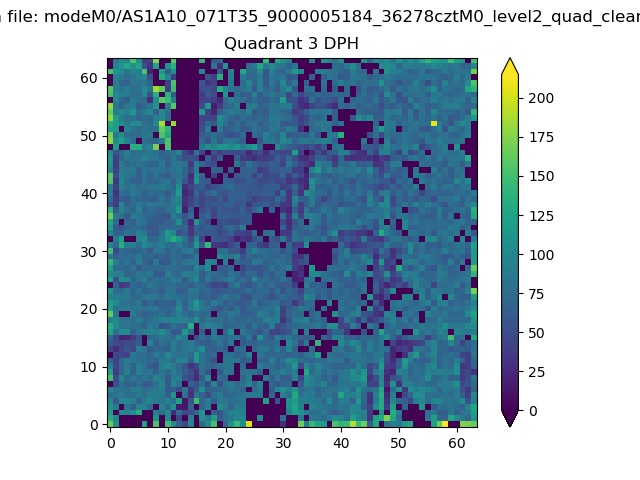 |
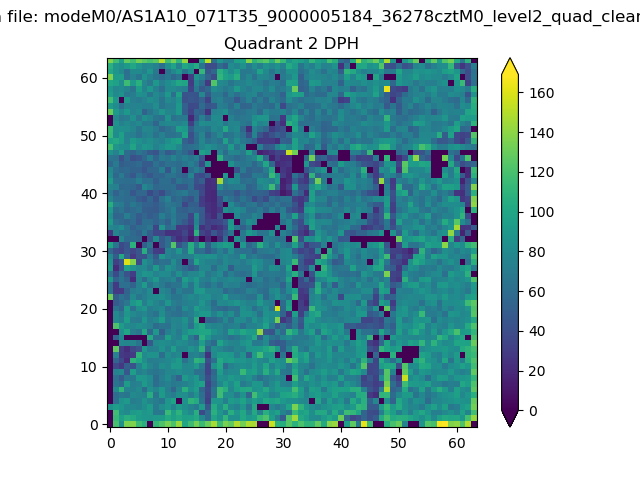 |
Quadrant C |
| Plot type | Count rate plots | Images |
|---|---|---|
| Comparison with Poisson distribution Blue bars denote a histogram of data divided into 1 sec bins. Red curve is a Poisson curve with rate = median count rate of data. |
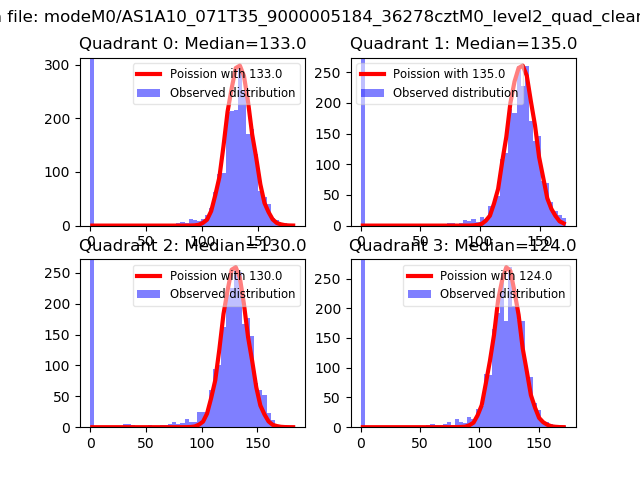 |
 |
| Quadrant-wise count rates Data is divided into 100 sec bins |
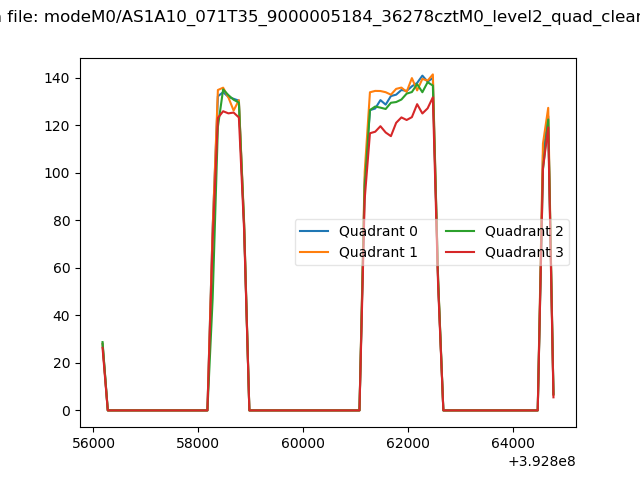 |
|
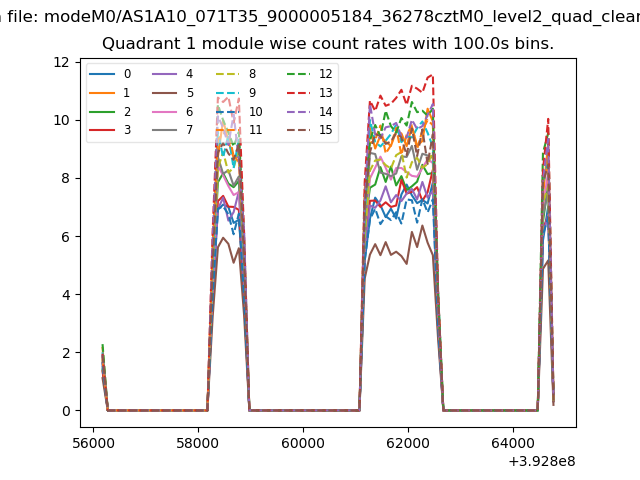
| Module-wise count rates for Quadrant A Data is divided into 100 sec bins |
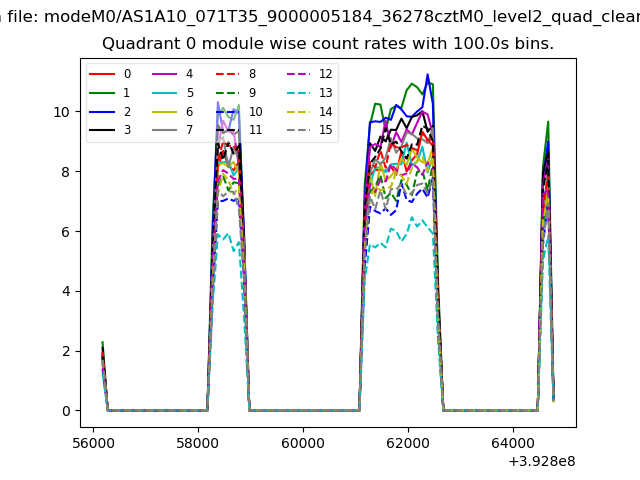 |
 |
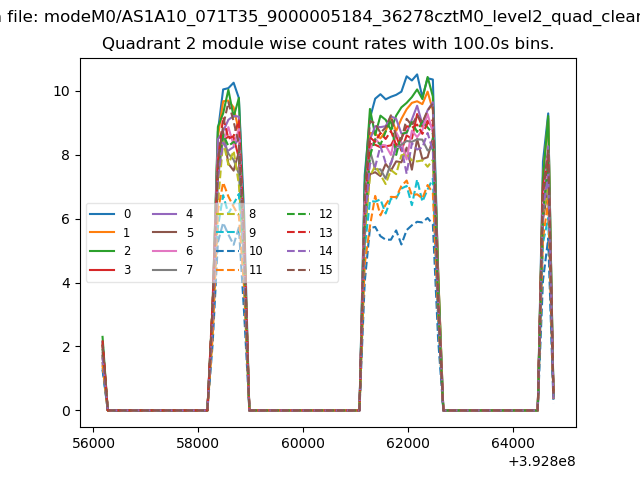
| Module-wise count rates for Quadrant B Data is divided into 100 sec bins |
 |
 |
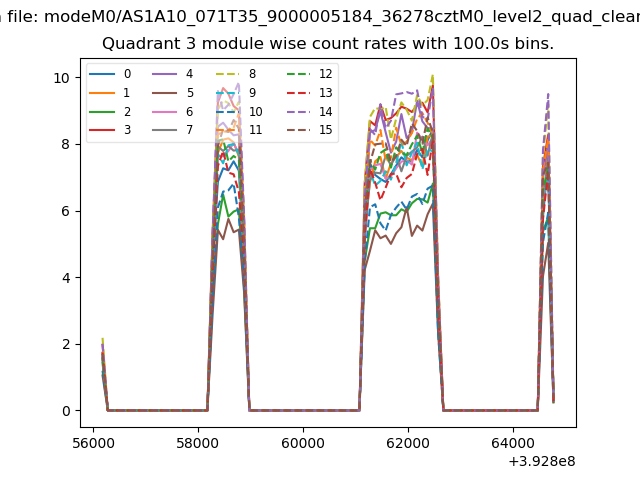
| Module-wise count rates for Quadrant C Data is divided into 100 sec bins |
 |
 |
| Module-wise count rates for Quadrant D Data is divided into 100 sec bins |
 |
 |
| Parameter | Plot |
|---|---|
| CZT HV Monitor | 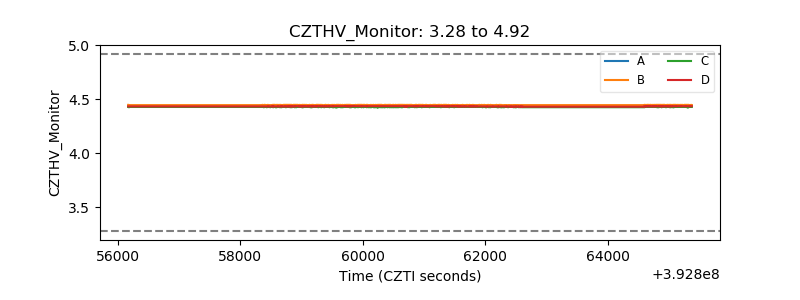 |
| D_VDD | 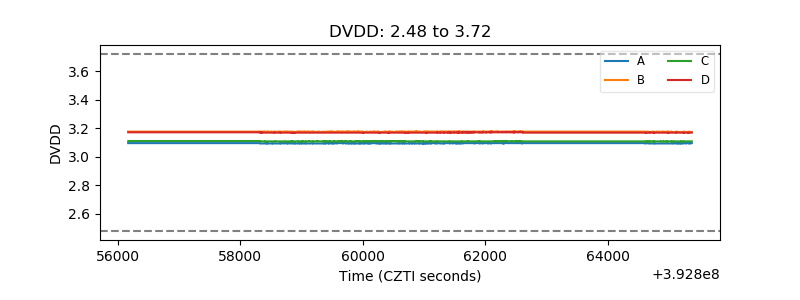 |
| Temperature 1 | 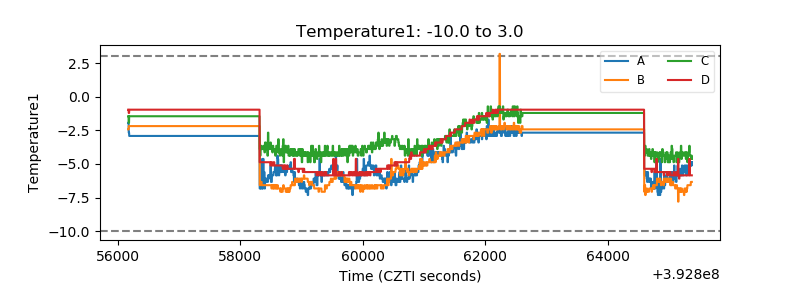 |
| Veto HV Monitor |  |
| Veto LLD | 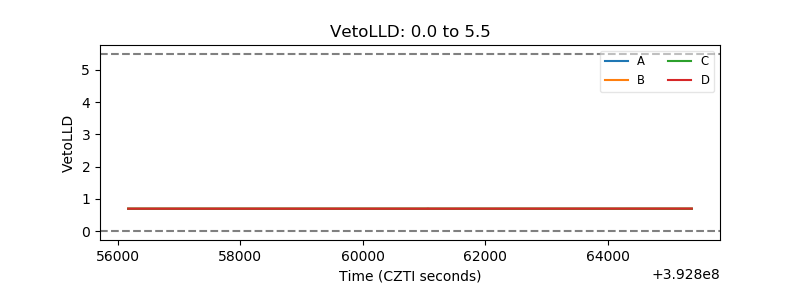 |
| Alpha Counter | 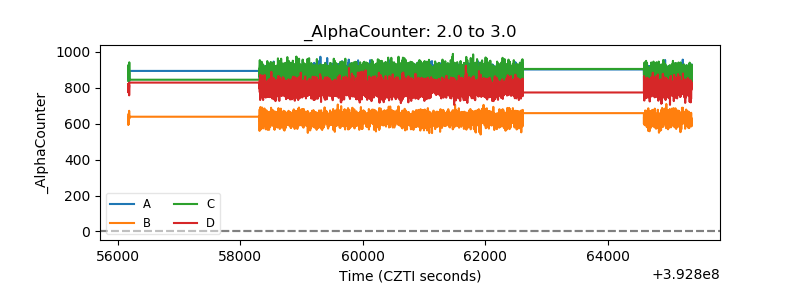 |
| _CPM_Rate | 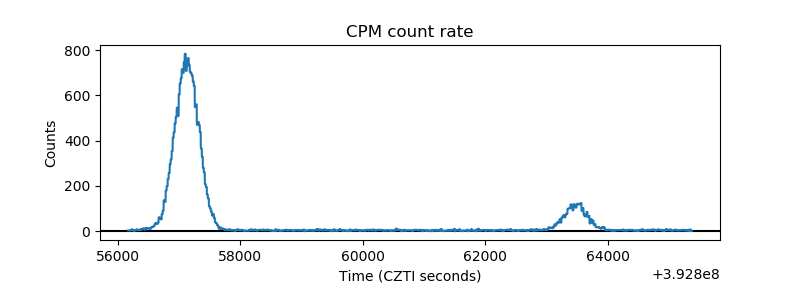 |
| CZT Counter | 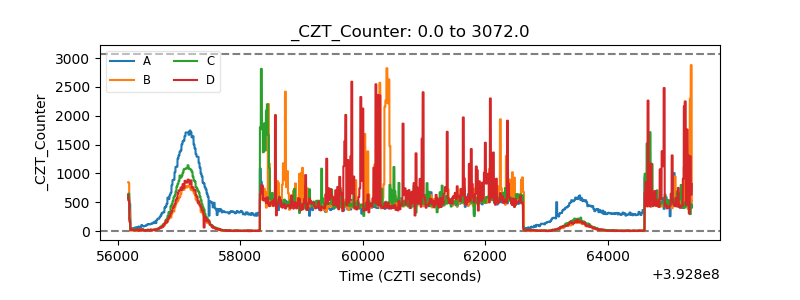 |
| +2.5 Volts monitor | 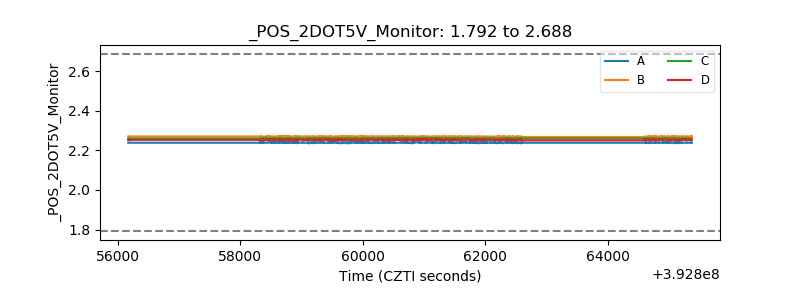 |
| +5 Volts monitor | 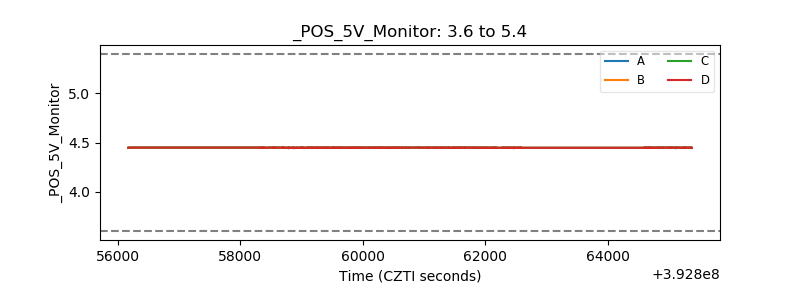 |
| _ROLL_ROT | 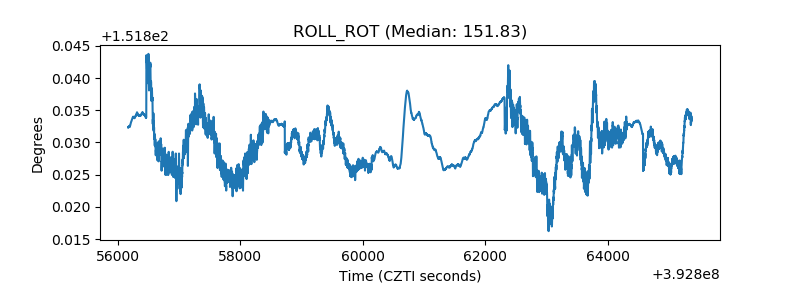 |
| _Roll_DEC | 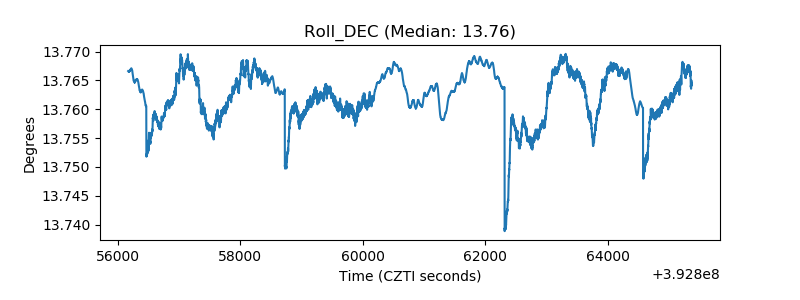 |
| _Roll_RA | 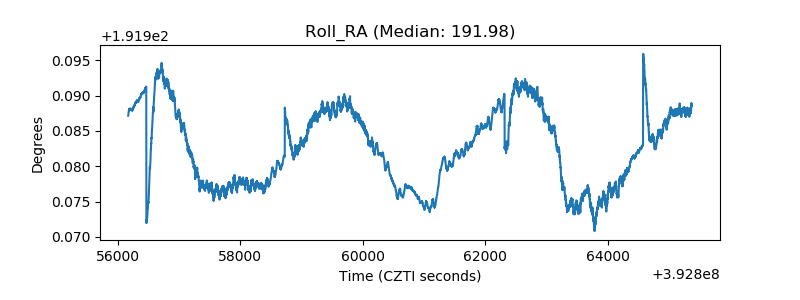 |
| Veto Counter | 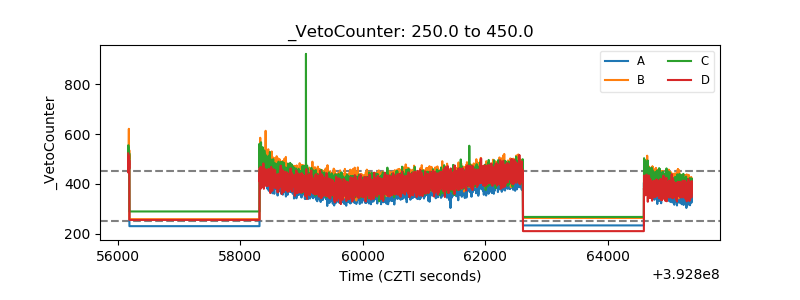 |