| Param | Original file | Final file |
|---|---|---|
| Filename | modeM0/AS1A10_071T35_9000005184_36277cztM0_level2.evt | modeM0/AS1A10_071T35_9000005184_36277cztM0_level2_quad_clean.evt |
| Size (bytes) | 408,404,160 | 55,722,240 |
| Size | 389.5 MB | 53.1 MB |
| Events in quadrant A | 2,444,004 | 345,675 |
| Events in quadrant B | 2,998,805 | 348,616 |
| Events in quadrant C | 2,940,254 | 335,079 |
| Events in quadrant D | 3,653,597 | 315,024 |
| Mode M0 | |||
|---|---|---|---|
| Quadrant | BADHDUFLAG | Total packets | Discarded packets |
| A | 0 | 10233 | 3 |
| B | 0 | 11993 | 2 |
| C | 0 | 11506 | 2 |
| D | 0 | 14105 | 2 |
| Mode SS | |||
|---|---|---|---|
| Quadrant | BADHDUFLAG | Total packets | Discarded packets |
| A | 0 | 100 | 0 |
| B | 0 | 100 | 0 |
| C | 0 | 100 | 0 |
| D | 0 | 100 | 0 |
| Mode M9 | |||
|---|---|---|---|
| Quadrant | BADHDUFLAG | Total packets | Discarded packets |
| A | 0 | 38 | 0 |
| B | 0 | 38 | 0 |
| C | 0 | 38 | 0 |
| D | 0 | 39 | 0 |
| Quadrant | Total seconds | Saturated seconds | Saturation percentage |
|---|---|---|---|
| A | 4882 | 10 | 0.204834% |
| B | 4882 | 118 | 2.417042% |
| C | 4882 | 143 | 2.929127% |
| D | 4882 | 240 | 4.916018% |
Noise dominated data is calculated using 1-second bins in cleaned event files. If a bin has >2000 counts, and if more than 50% of those come from <1% of pixels, then it is considered to be noise-dominated and hence unusable.
| Quadrant | # 1 sec bins | Bins with >0 counts | Bins with >2000 counts | High rate bins dominated by noise | Noise dominated (total time) | Noise dominated (detector-on time) | Marked lightcurve |
|---|---|---|---|---|---|---|---|
| A | 7005 | 4883 | 1 | 1 | 0.01% | 0.02% | 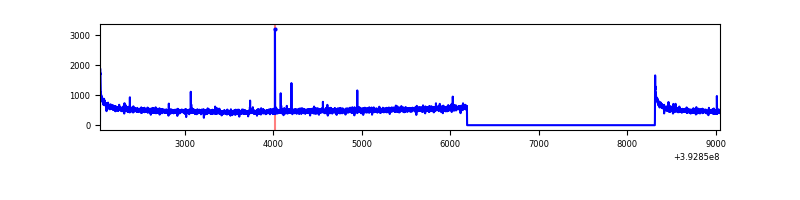 |
| B | 7005 | 4883 | 84 | 84 | 1.20% | 1.72% | 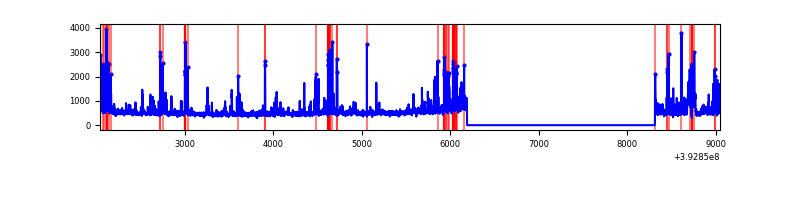 |
| C | 7005 | 4883 | 131 | 131 | 1.87% | 2.68% | 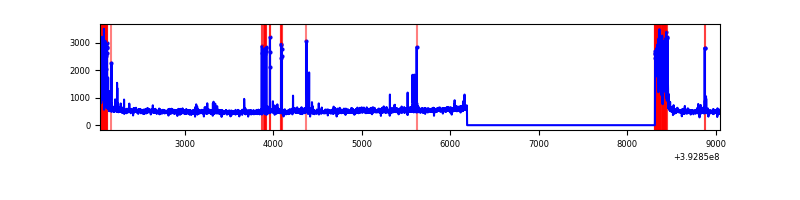 |
| D | 7005 | 4883 | 224 | 224 | 3.20% | 4.59% | 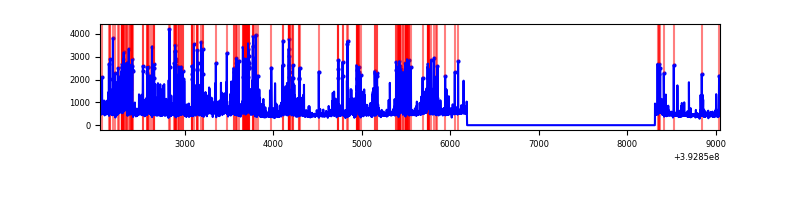 |
Top three noisy pixels from each quadrant. If the there are fewer than three noisy pixels in the level2.evt file, extra rows are filled as -1
| Pixel properties | Quadrant properties | ||||||
|---|---|---|---|---|---|---|---|
| Quadrant | DetID | PixID | Counts | Sigma | Mean | Median | Sigma |
| A | 10 | 83 | 166153 | 1413.4 | 583 | 571 | 117.2 |
| A | 13 | 6 | 8667 | 69.11 | 583 | 571 | 117.2 |
| A | 13 | 254 | 7637 | 60.31 | 583 | 571 | 117.2 |
| B | 5 | 236 | 307468 | 2763.3 | 579 | 567 | 111.1 |
| B | 5 | 172 | 292248 | 2626.26 | 579 | 567 | 111.1 |
| B | 0 | 155 | 41773 | 371.01 | 579 | 567 | 111.1 |
| C | 0 | 10 | 418175 | 3169.24 | 561 | 567 | 131.8 |
| C | 15 | 214 | 202524 | 1532.66 | 561 | 567 | 131.8 |
| C | 0 | 207 | 115026 | 868.63 | 561 | 567 | 131.8 |
| D | 12 | 6 | 872767 | 6399.52 | 550 | 534 | 136.3 |
| D | 7 | 223 | 186686 | 1365.79 | 550 | 534 | 136.3 |
| D | 2 | 250 | 139361 | 1018.56 | 550 | 534 | 136.3 |
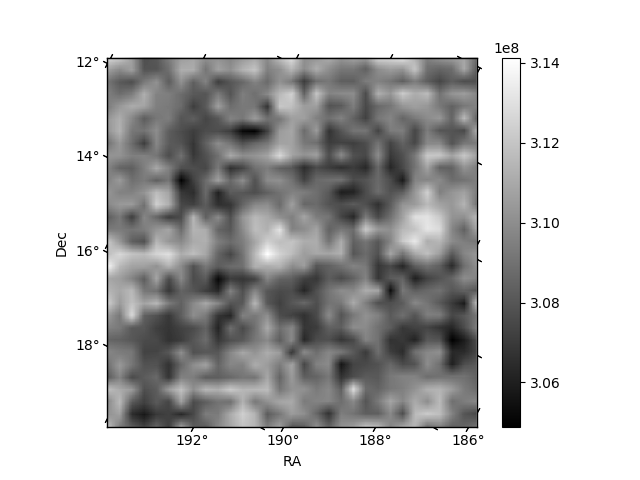
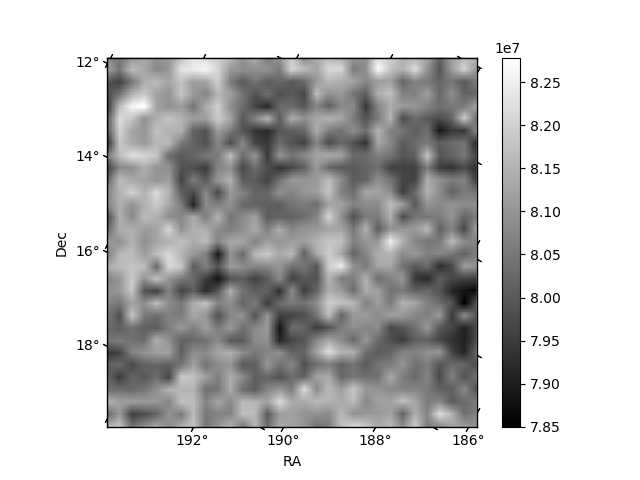
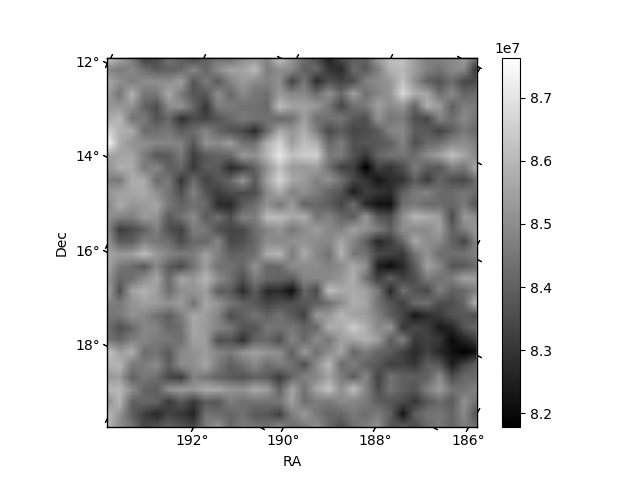
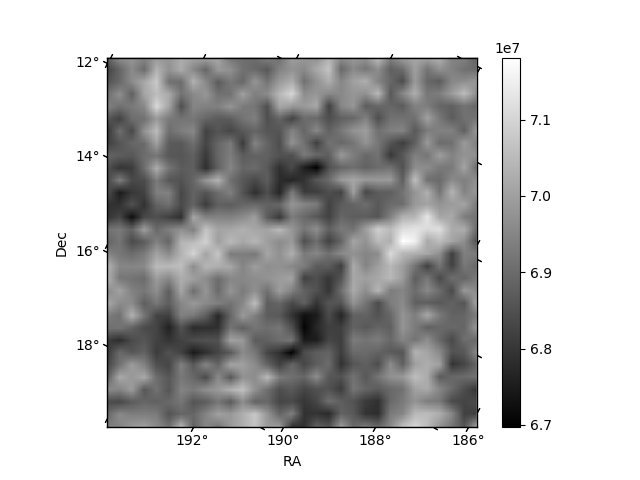
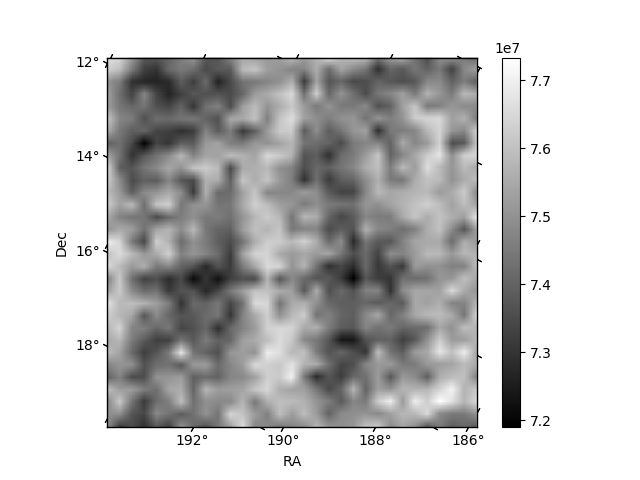
Histogram calculated using DETX and DETY for each event in the final _common_clean file
| Quadrant A | 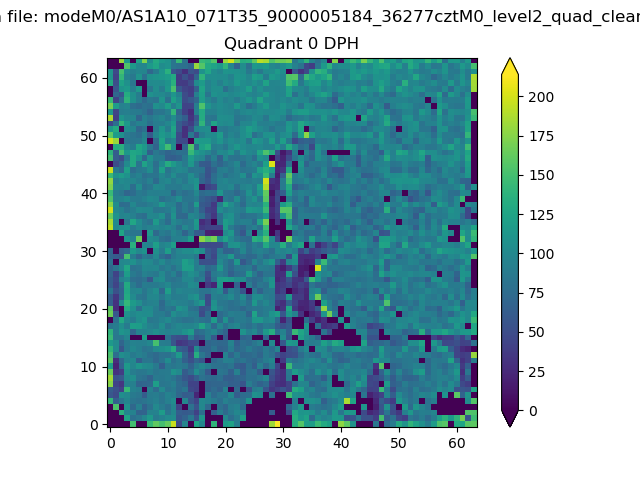 |
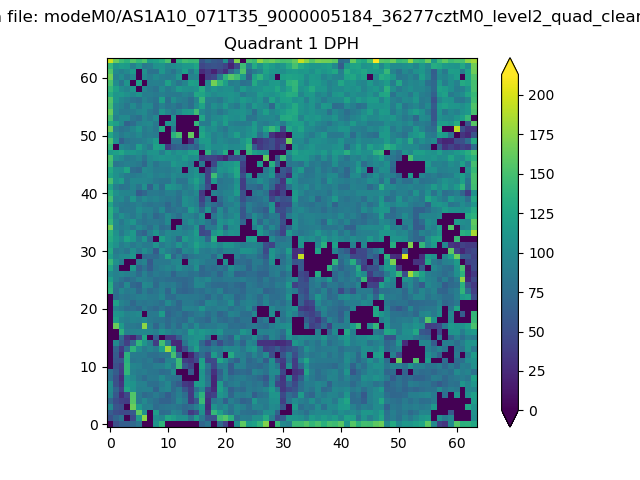 |
Quadrant B |
|---|---|---|---|
| Quadrant D | 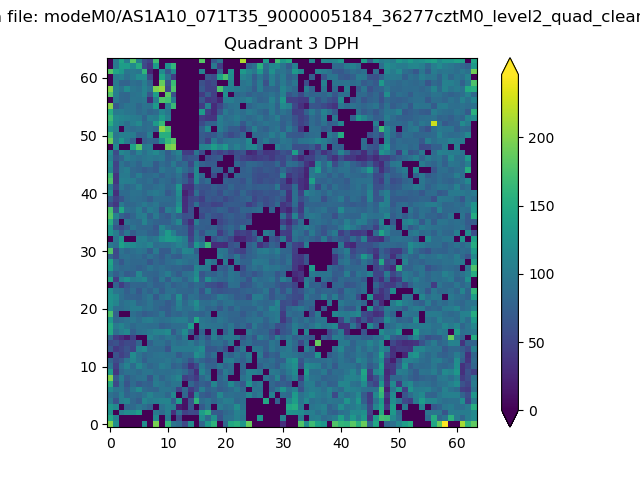 |
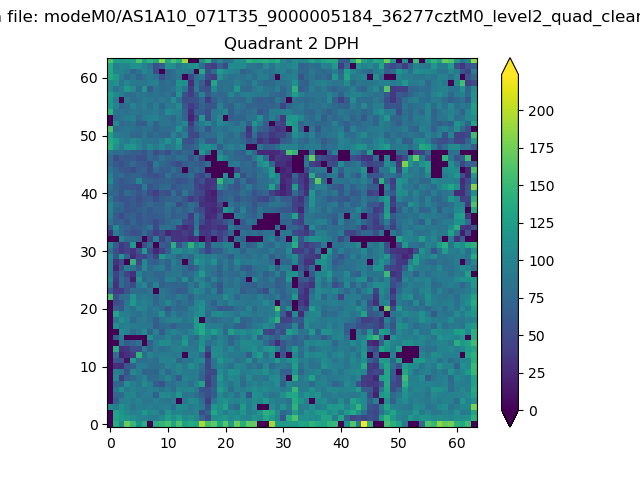 |
Quadrant C |
| Plot type | Count rate plots | Images |
|---|---|---|
| Comparison with Poisson distribution Blue bars denote a histogram of data divided into 1 sec bins. Red curve is a Poisson curve with rate = median count rate of data. |
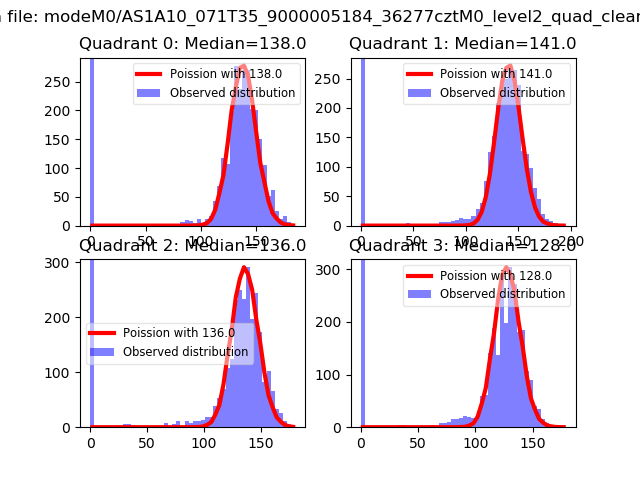 |
 |
| Quadrant-wise count rates Data is divided into 100 sec bins |
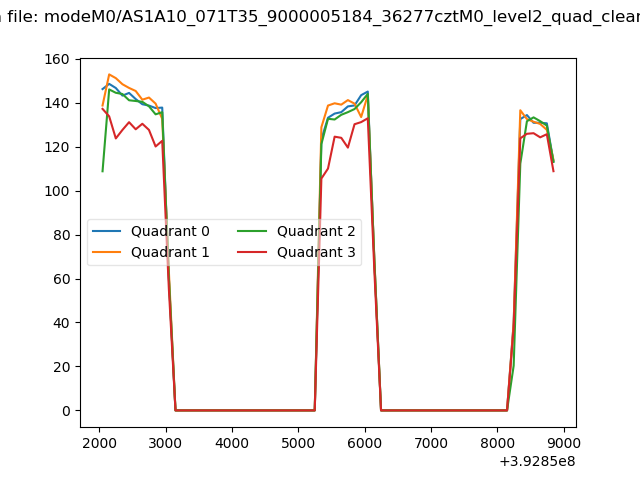 |
|
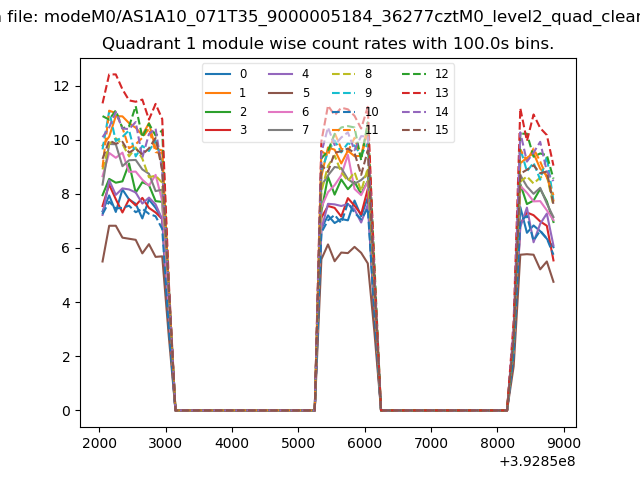
| Module-wise count rates for Quadrant A Data is divided into 100 sec bins |
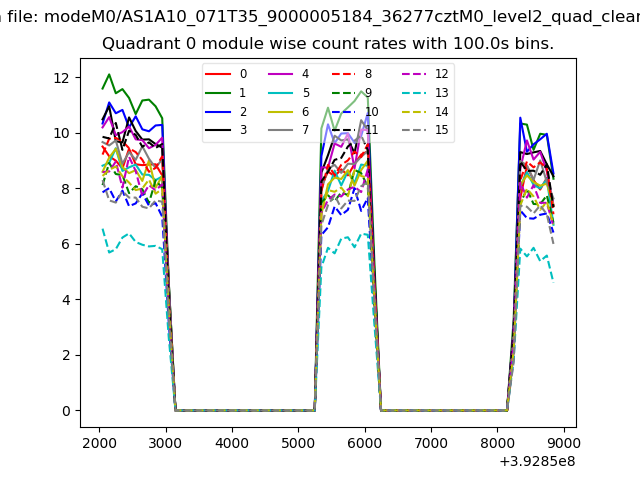 |
 |
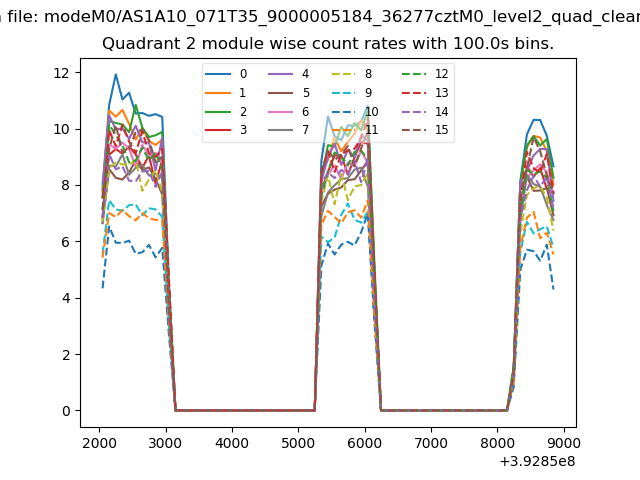
| Module-wise count rates for Quadrant B Data is divided into 100 sec bins |
 |
 |
| Module-wise count rates for Quadrant C Data is divided into 100 sec bins |
 |
 |
| Module-wise count rates for Quadrant D Data is divided into 100 sec bins |
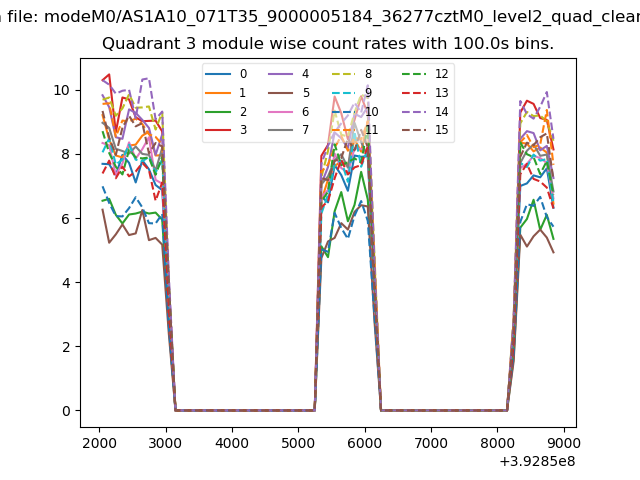 |
 |
| Parameter | Plot |
|---|---|
| CZT HV Monitor | 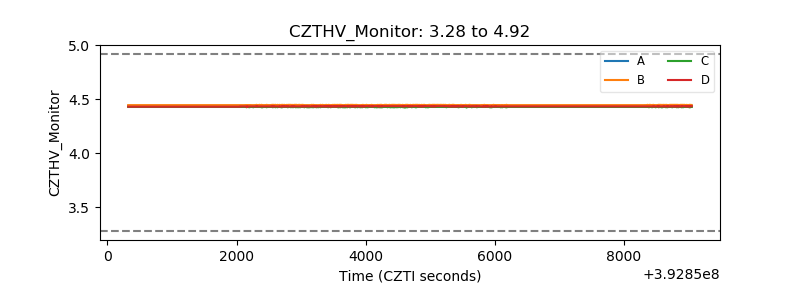 |
| D_VDD | 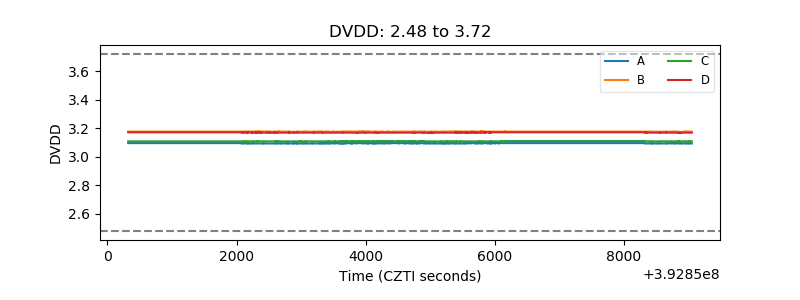 |
| Temperature 1 | 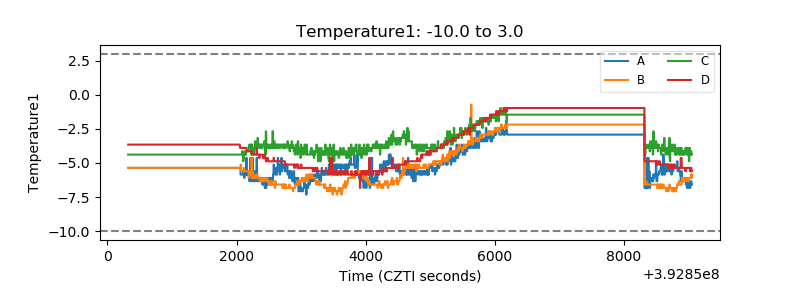 |
| Veto HV Monitor | 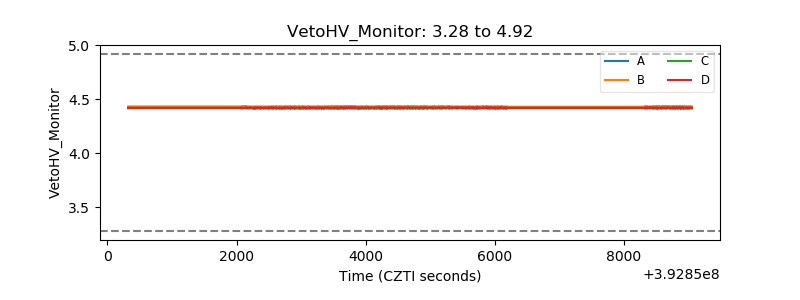 |
| Veto LLD | 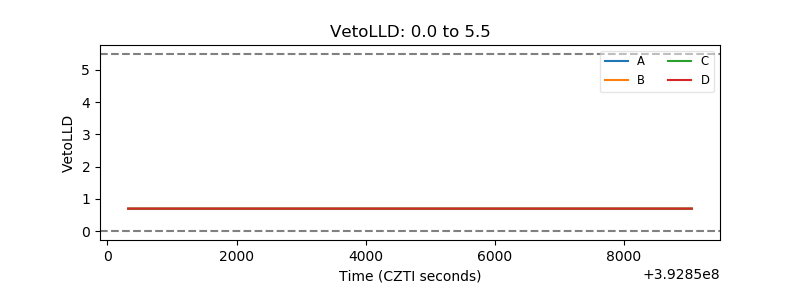 |
| Alpha Counter | 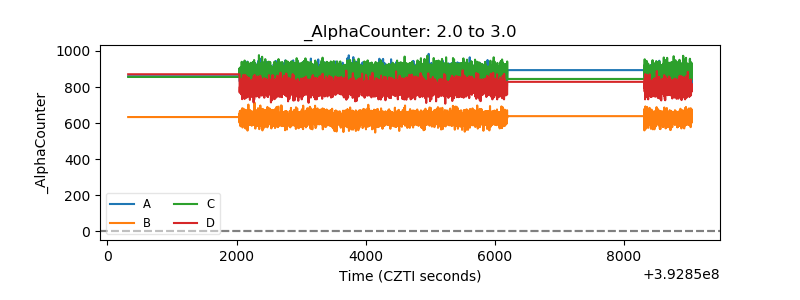 |
| _CPM_Rate | 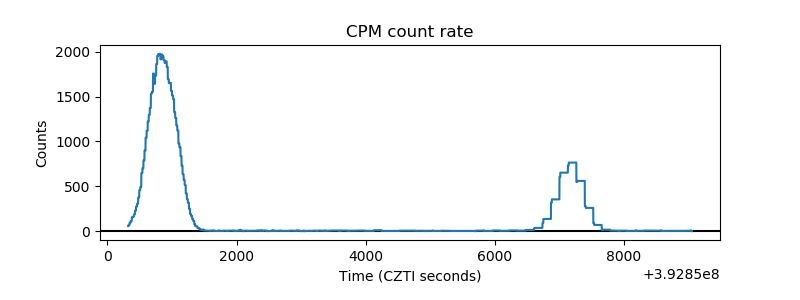 |
| CZT Counter | 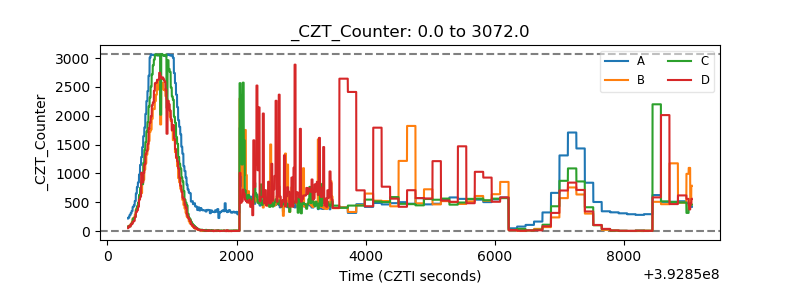 |
| +2.5 Volts monitor | 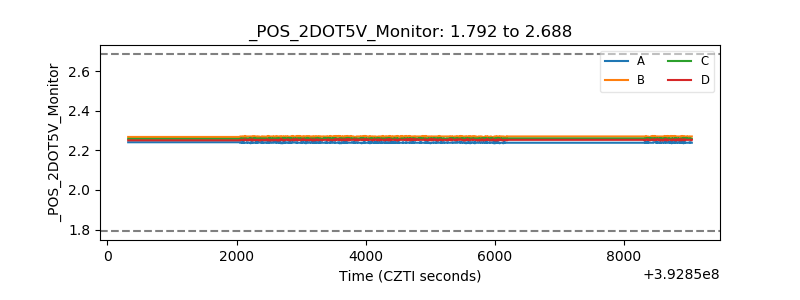 |
| +5 Volts monitor | 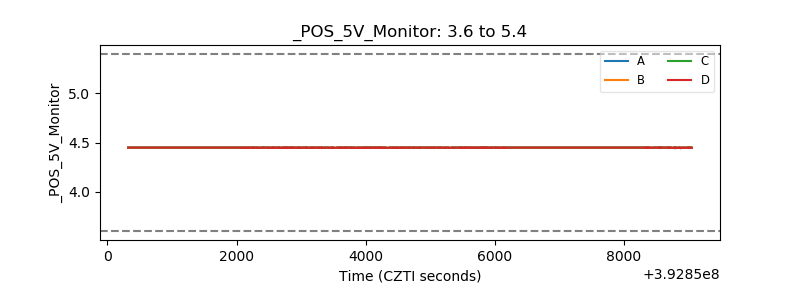 |
| _ROLL_ROT | 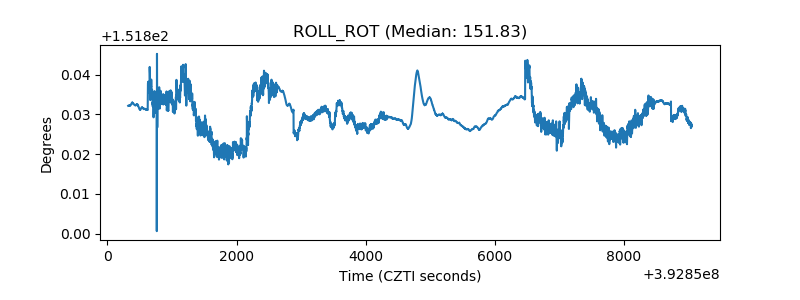 |
| _Roll_DEC | 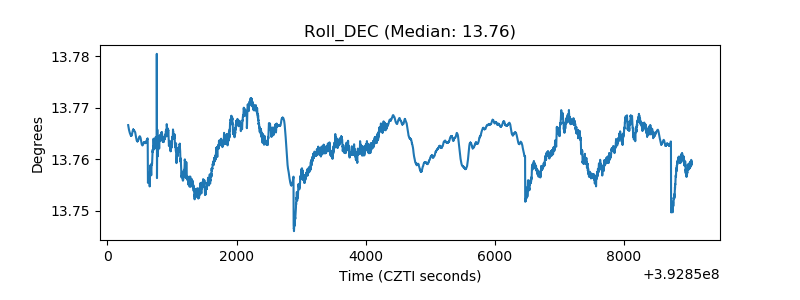 |
| _Roll_RA | 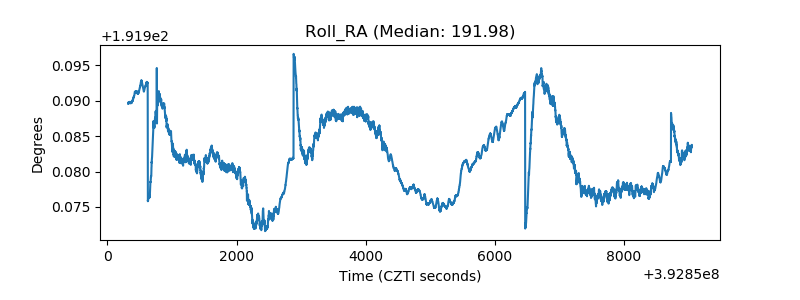 |
| Veto Counter | 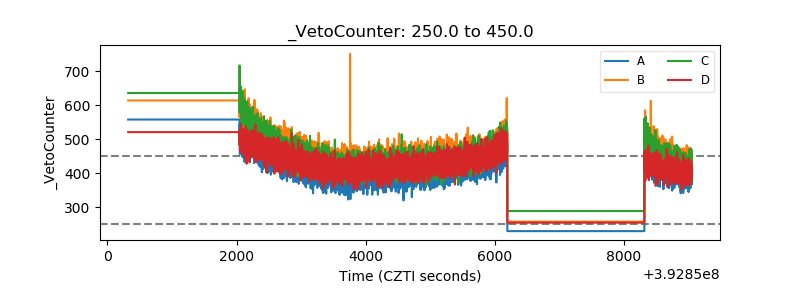 |