| Param | Original file | Final file |
|---|---|---|
| Filename | modeM0/AS1A10_071T36_9000005182_36261cztM0_level2.evt | modeM0/AS1A10_071T36_9000005182_36261cztM0_level2_quad_clean.evt |
| Size (bytes) | 488,799,360 | 61,476,480 |
| Size | 466.2 MB | 58.6 MB |
| Events in quadrant A | 2,537,270 | 393,614 |
| Events in quadrant B | 5,170,869 | 379,003 |
| Events in quadrant C | 2,865,813 | 383,603 |
| Events in quadrant D | 3,896,329 | 360,276 |
| Mode SS | |||
|---|---|---|---|
| Quadrant | BADHDUFLAG | Total packets | Discarded packets |
| A | 0 | 100 | 0 |
| B | 0 | 100 | 0 |
| C | 0 | 100 | 0 |
| D | 0 | 100 | 0 |
| Mode M9 | |||
|---|---|---|---|
| Quadrant | BADHDUFLAG | Total packets | Discarded packets |
| A | 0 | 36 | 0 |
| B | 0 | 36 | 0 |
| C | 0 | 36 | 0 |
| D | 0 | 37 | 0 |
| Mode M0 | |||
|---|---|---|---|
| Quadrant | BADHDUFLAG | Total packets | Discarded packets |
| A | 0 | 10469 | 3 |
| B | 0 | 18605 | 2 |
| C | 0 | 11265 | 2 |
| D | 0 | 14765 | 2 |
| Quadrant | Total seconds | Saturated seconds | Saturation percentage |
|---|---|---|---|
| A | 4913 | 13 | 0.264604% |
| B | 4913 | 846 | 17.219621% |
| C | 4913 | 124 | 2.523916% |
| D | 4913 | 323 | 6.574394% |
Noise dominated data is calculated using 1-second bins in cleaned event files. If a bin has >2000 counts, and if more than 50% of those come from <1% of pixels, then it is considered to be noise-dominated and hence unusable.
| Quadrant | # 1 sec bins | Bins with >0 counts | Bins with >2000 counts | High rate bins dominated by noise | Noise dominated (total time) | Noise dominated (detector-on time) | Marked lightcurve |
|---|---|---|---|---|---|---|---|
| A | 7007 | 4914 | 3 | 3 | 0.04% | 0.06% | 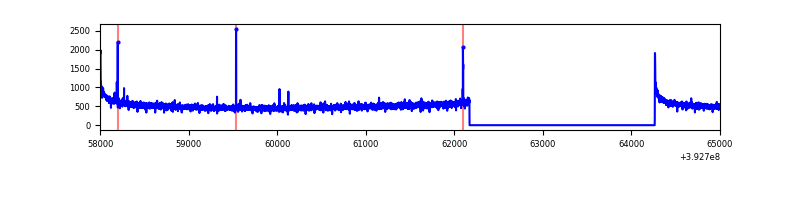 |
| B | 7007 | 4914 | 688 | 688 | 9.82% | 14.00% | 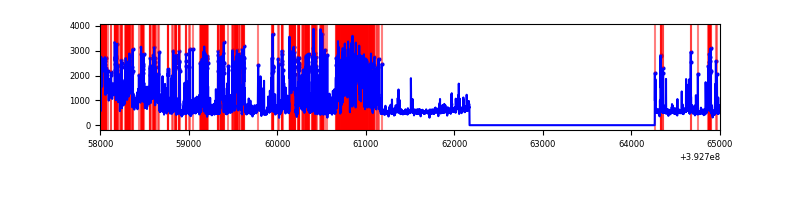 |
| C | 7007 | 4914 | 105 | 105 | 1.50% | 2.14% | 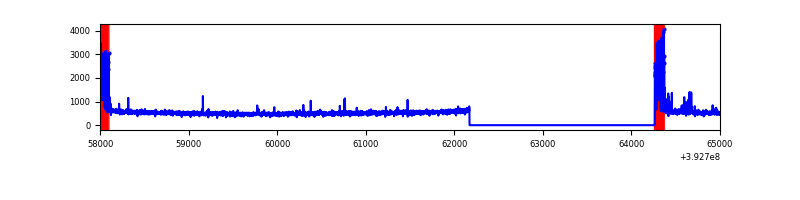 |
| D | 7007 | 4914 | 303 | 303 | 4.32% | 6.17% | 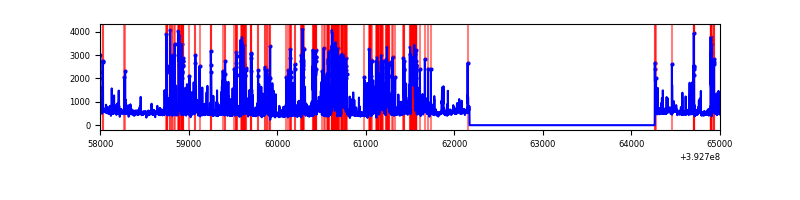 |
Top three noisy pixels from each quadrant. If the there are fewer than three noisy pixels in the level2.evt file, extra rows are filled as -1
| Pixel properties | Quadrant properties | ||||||
|---|---|---|---|---|---|---|---|
| Quadrant | DetID | PixID | Counts | Sigma | Mean | Median | Sigma |
| A | 10 | 83 | 169658 | 1386.39 | 607 | 595 | 121.9 |
| A | 9 | 143 | 8776 | 67.09 | 607 | 595 | 121.9 |
| A | 13 | 254 | 7647 | 57.83 | 607 | 595 | 121.9 |
| B | 5 | 172 | 1111322 | 10286.74 | 573 | 561 | 108.0 |
| B | 5 | 236 | 656530 | 6074.92 | 573 | 561 | 108.0 |
| B | 4 | 171 | 539211 | 4988.43 | 573 | 561 | 108.0 |
| C | 0 | 10 | 363959 | 2655.61 | 587 | 593 | 136.8 |
| C | 15 | 214 | 204530 | 1490.45 | 587 | 593 | 136.8 |
| C | 0 | 207 | 10809 | 74.66 | 587 | 593 | 136.8 |
| D | 12 | 6 | 1014219 | 7256.92 | 570 | 556 | 139.7 |
| D | 13 | 249 | 312663 | 2234.41 | 570 | 556 | 139.7 |
| D | 12 | 235 | 109274 | 778.32 | 570 | 556 | 139.7 |
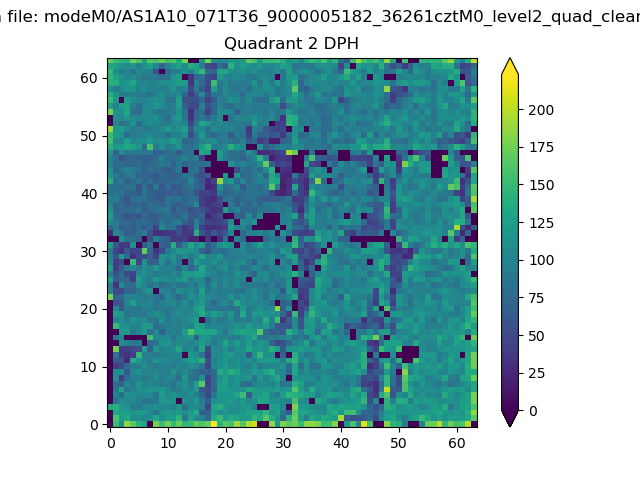
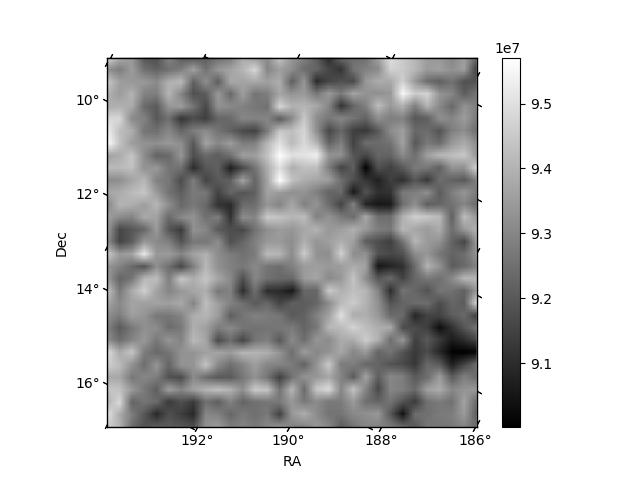
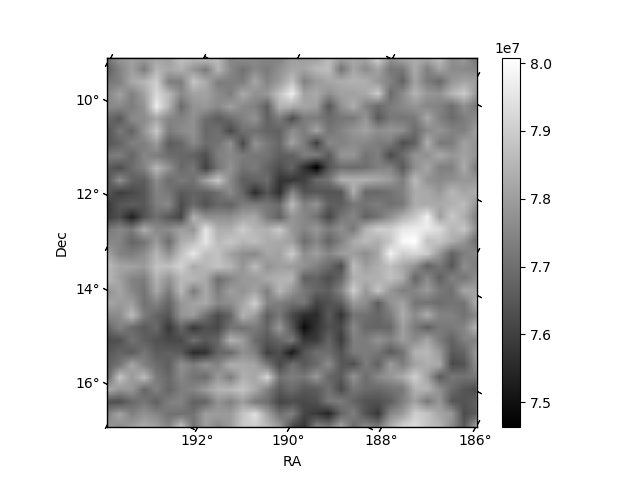
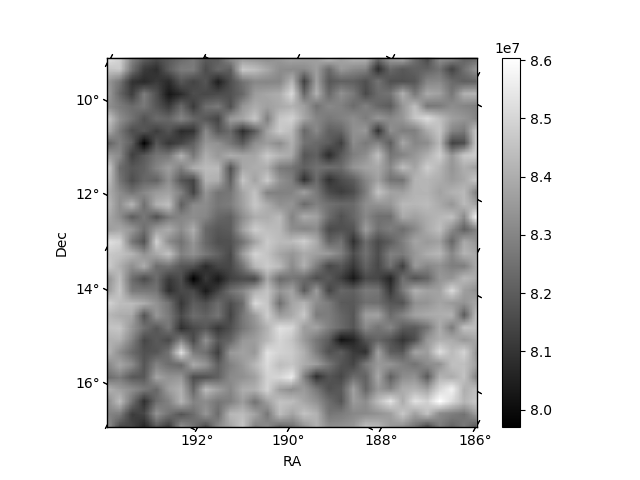
Histogram calculated using DETX and DETY for each event in the final _common_clean file
| Quadrant A | 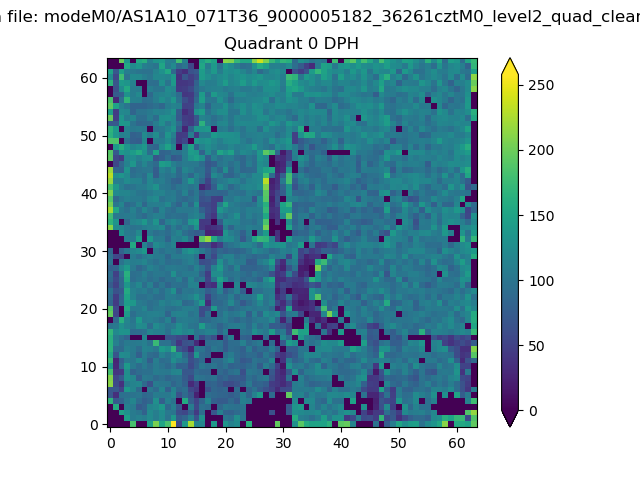 |
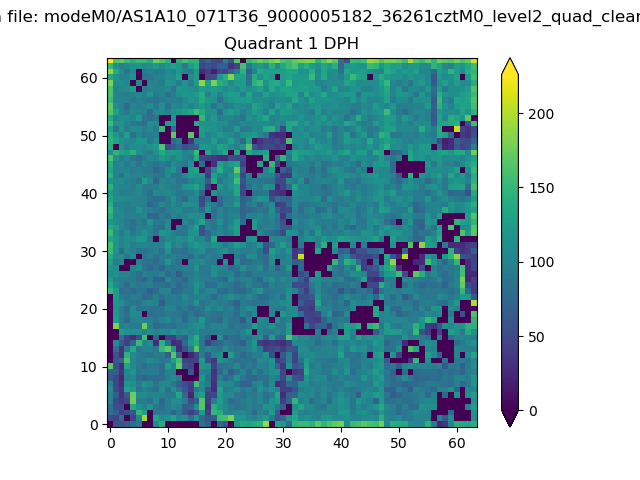 |
Quadrant B |
|---|---|---|---|
| Quadrant D | 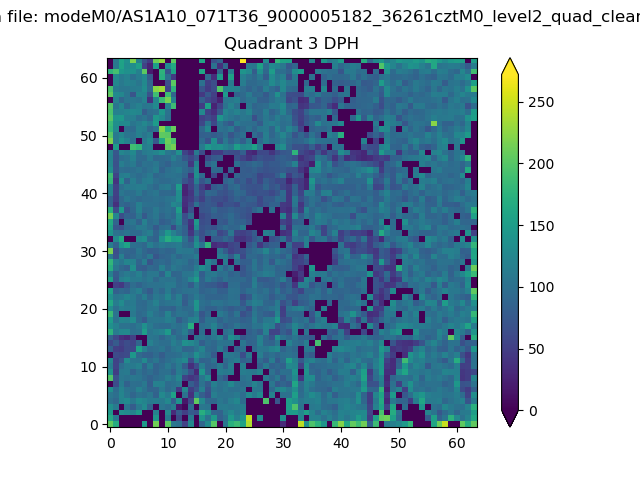 |
 |
Quadrant C |
| Plot type | Count rate plots | Images |
|---|---|---|
| Comparison with Poisson distribution Blue bars denote a histogram of data divided into 1 sec bins. Red curve is a Poisson curve with rate = median count rate of data. |
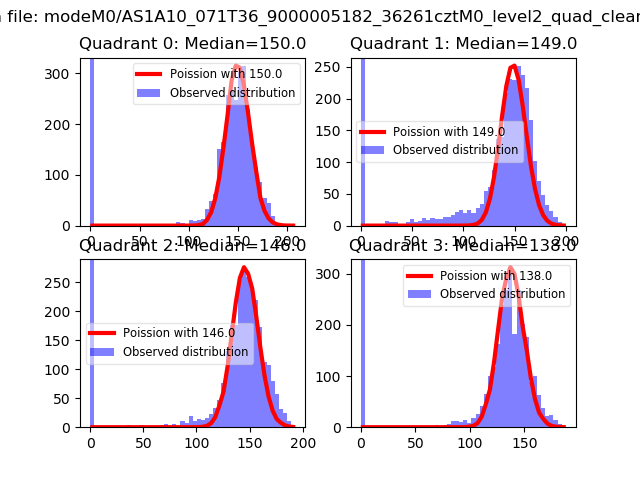 |
 |
| Quadrant-wise count rates Data is divided into 100 sec bins |
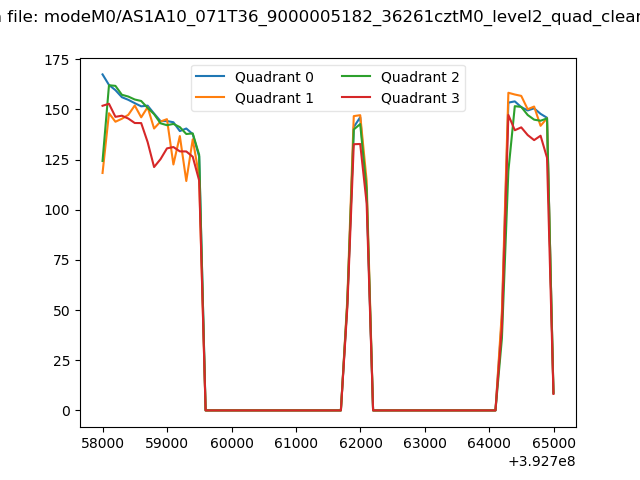 |
|
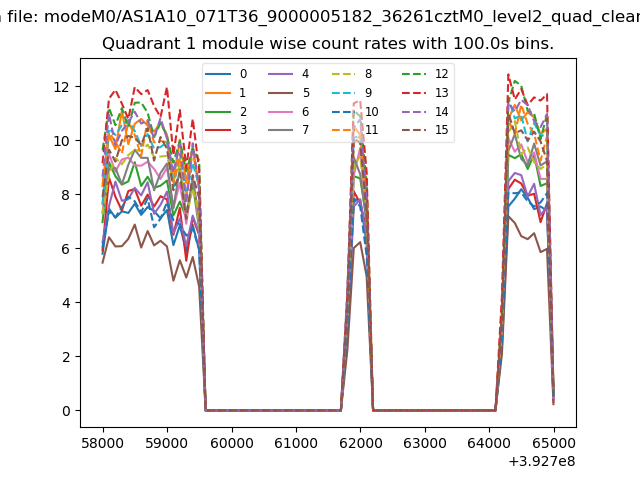
| Module-wise count rates for Quadrant A Data is divided into 100 sec bins |
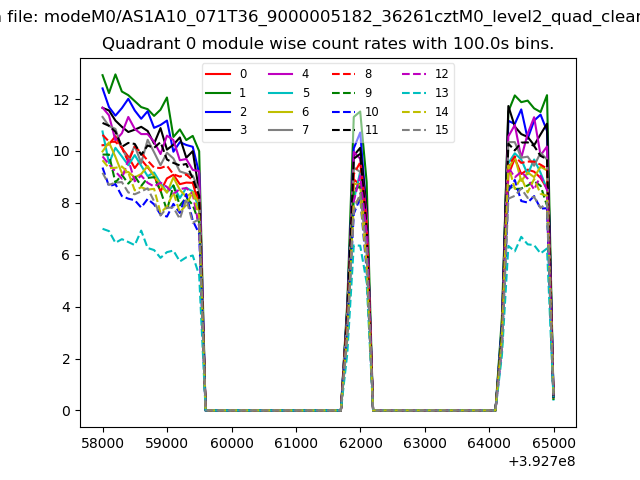 |
 |
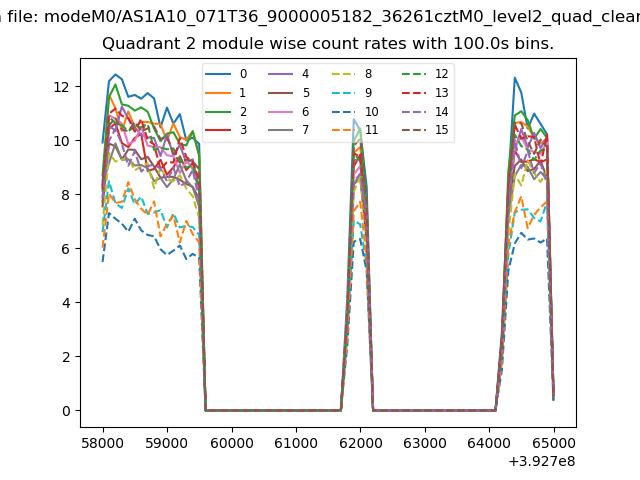
| Module-wise count rates for Quadrant B Data is divided into 100 sec bins |
 |
 |
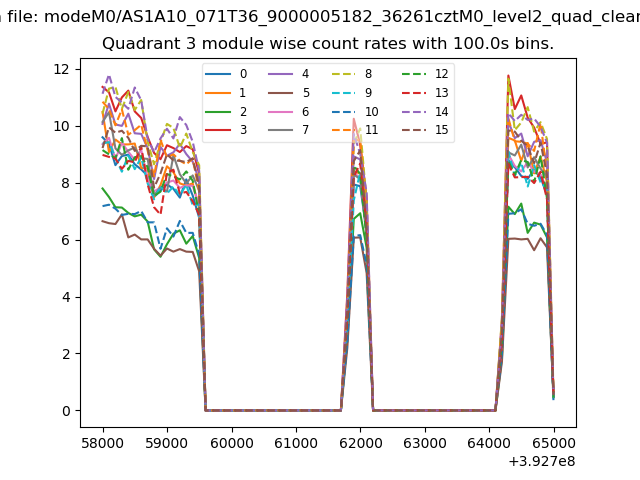
| Module-wise count rates for Quadrant C Data is divided into 100 sec bins |
 |
 |
| Module-wise count rates for Quadrant D Data is divided into 100 sec bins |
 |
 |
| Parameter | Plot |
|---|---|
| CZT HV Monitor | 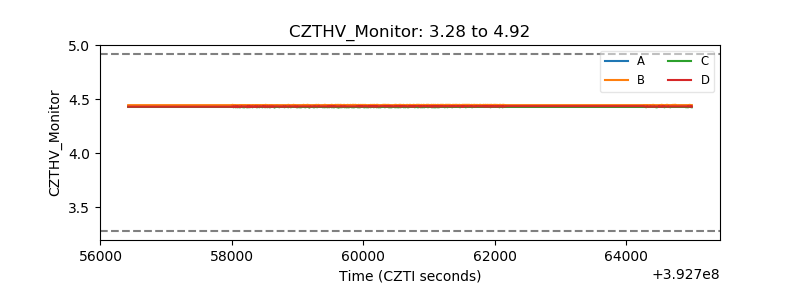 |
| D_VDD | 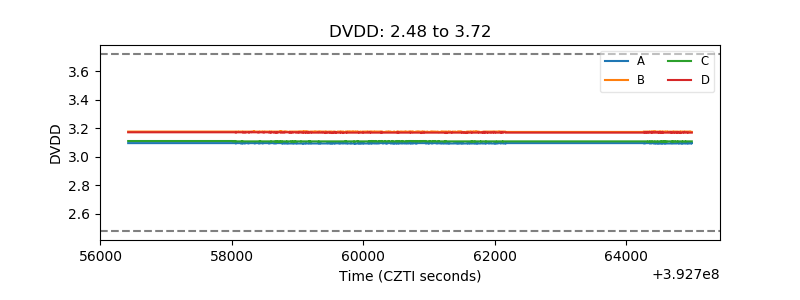 |
| Temperature 1 | 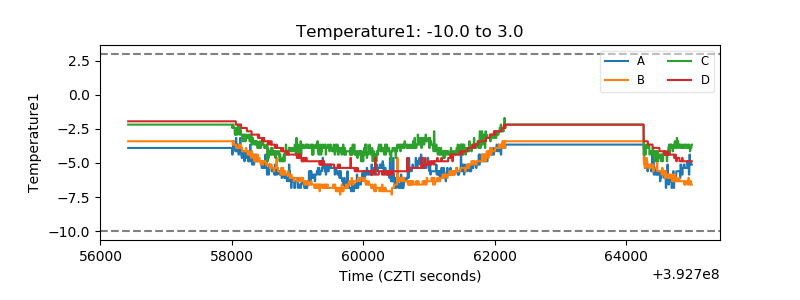 |
| Veto HV Monitor | 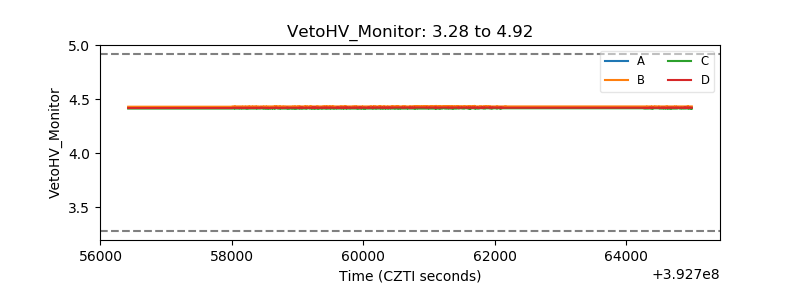 |
| Veto LLD | 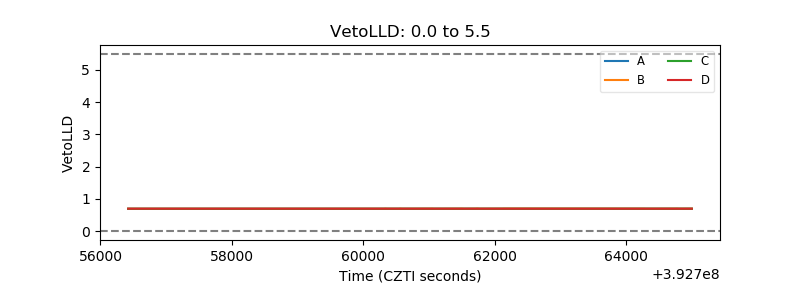 |
| Alpha Counter | 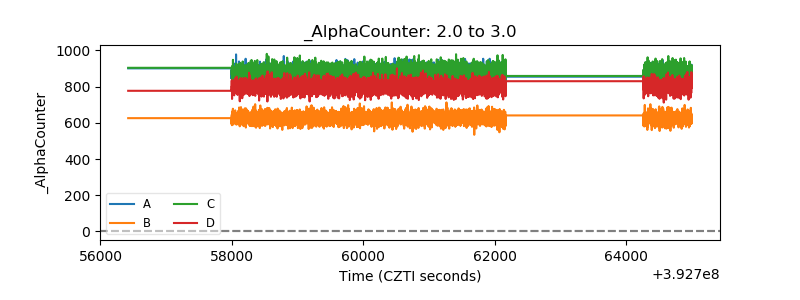 |
| _CPM_Rate | 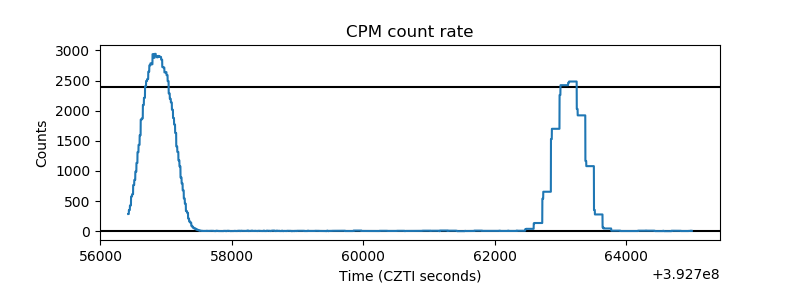 |
| CZT Counter | 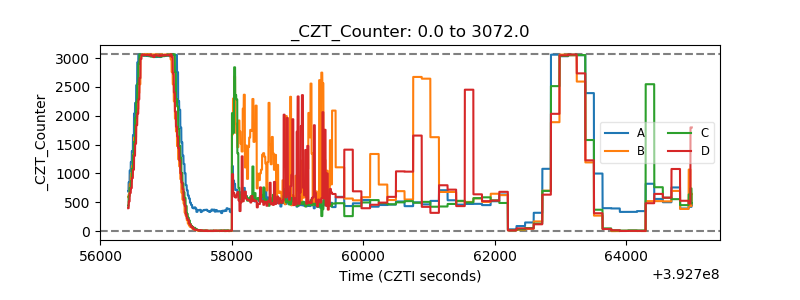 |
| +2.5 Volts monitor | 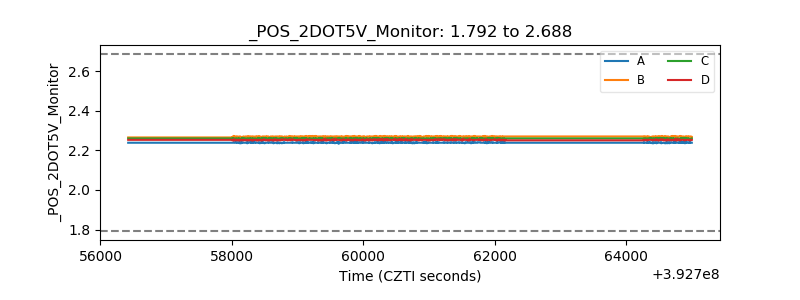 |
| +5 Volts monitor | 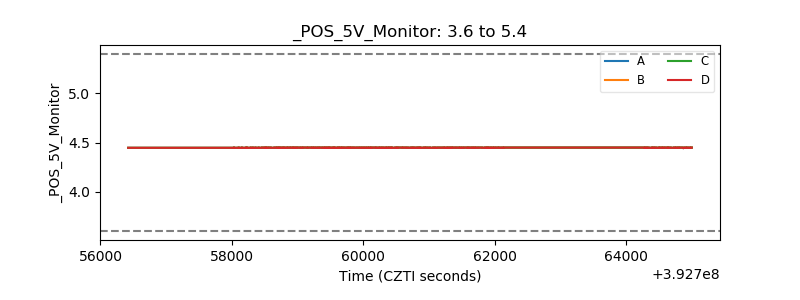 |
| _ROLL_ROT | 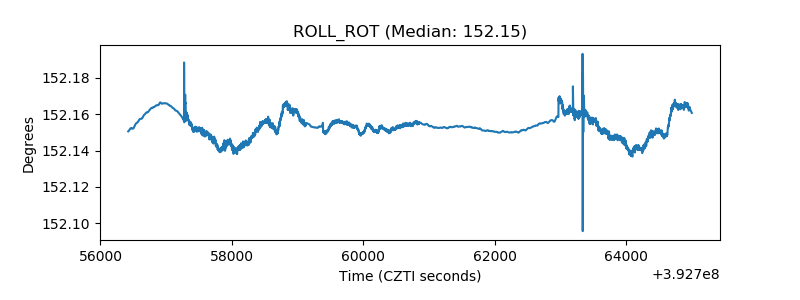 |
| _Roll_DEC | 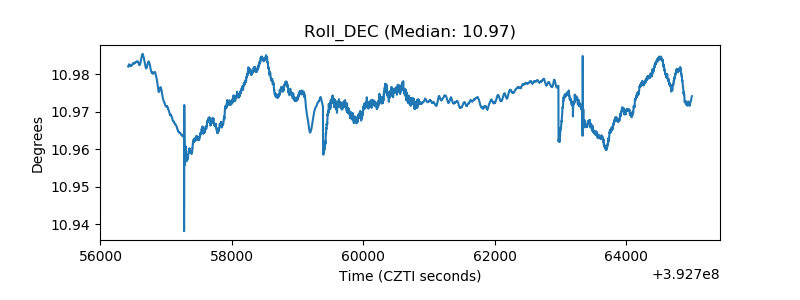 |
| _Roll_RA | 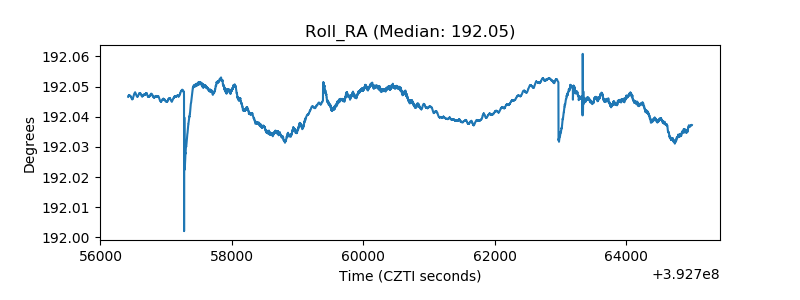 |
| Veto Counter | 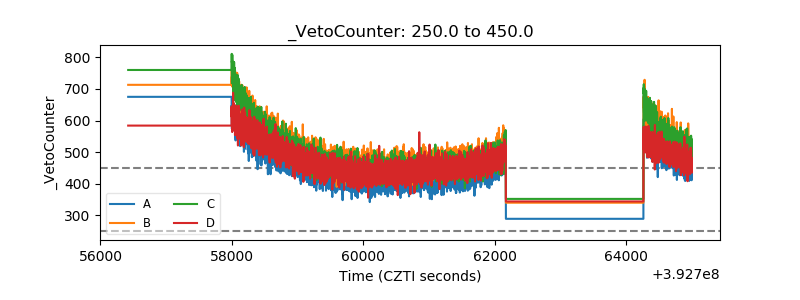 |