| Param | Original file | Final file |
|---|---|---|
| Filename | modeM0/AS1A10_071T37_9000005180_36251cztM0_level2.evt | modeM0/AS1A10_071T37_9000005180_36251cztM0_level2_quad_clean.evt |
| Size (bytes) | 604,584,000 | 65,188,800 |
| Size | 576.6 MB | 62.2 MB |
| Events in quadrant A | 2,822,466 | 410,999 |
| Events in quadrant B | 4,563,527 | 401,015 |
| Events in quadrant C | 3,470,586 | 405,069 |
| Events in quadrant D | 7,057,416 | 347,779 |
| Mode SS | |||
|---|---|---|---|
| Quadrant | BADHDUFLAG | Total packets | Discarded packets |
| A | 0 | 122 | 0 |
| B | 0 | 122 | 0 |
| C | 0 | 122 | 0 |
| D | 0 | 122 | 0 |
| Mode M9 | |||
|---|---|---|---|
| Quadrant | BADHDUFLAG | Total packets | Discarded packets |
| A | 0 | 30 | 0 |
| B | 0 | 30 | 0 |
| C | 0 | 30 | 0 |
| D | 0 | 30 | 0 |
| Mode M0 | |||
|---|---|---|---|
| Quadrant | BADHDUFLAG | Total packets | Discarded packets |
| A | 0 | 11972 | 3 |
| B | 0 | 17373 | 2 |
| C | 0 | 13710 | 2 |
| D | 0 | 24853 | 2 |
| Quadrant | Total seconds | Saturated seconds | Saturation percentage |
|---|---|---|---|
| A | 5842 | 6 | 0.102705% |
| B | 5842 | 484 | 8.284834% |
| C | 5842 | 134 | 2.293735% |
| D | 5842 | 1470 | 25.162616% |
Noise dominated data is calculated using 1-second bins in cleaned event files. If a bin has >2000 counts, and if more than 50% of those come from <1% of pixels, then it is considered to be noise-dominated and hence unusable.
| Quadrant | # 1 sec bins | Bins with >0 counts | Bins with >2000 counts | High rate bins dominated by noise | Noise dominated (total time) | Noise dominated (detector-on time) | Marked lightcurve |
|---|---|---|---|---|---|---|---|
| A | 8856 | 5844 | 0 | 0 | 0.00% | 0.00% | 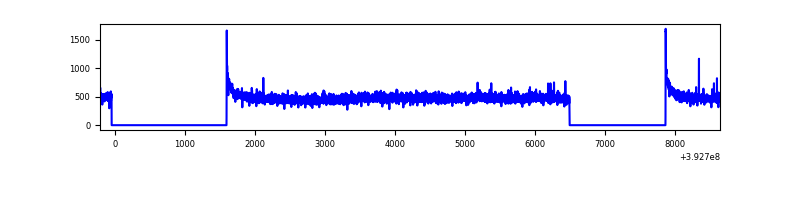 |
| B | 8856 | 5844 | 338 | 338 | 3.82% | 5.78% | 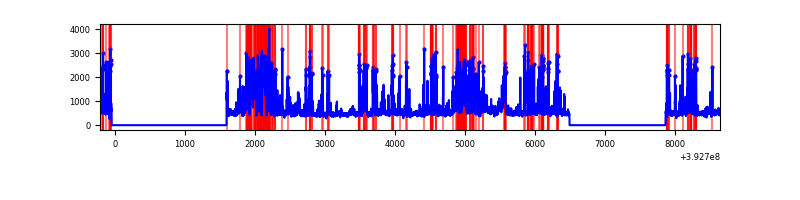 |
| C | 8856 | 5844 | 120 | 120 | 1.36% | 2.05% | 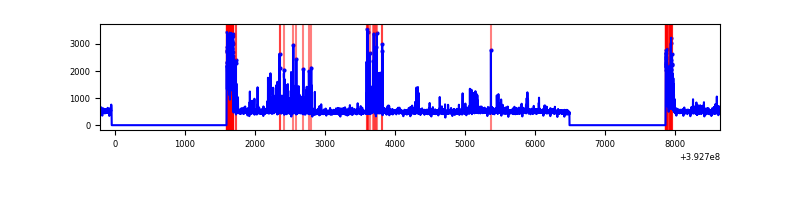 |
| D | 8856 | 5844 | 1387 | 1387 | 15.66% | 23.73% | 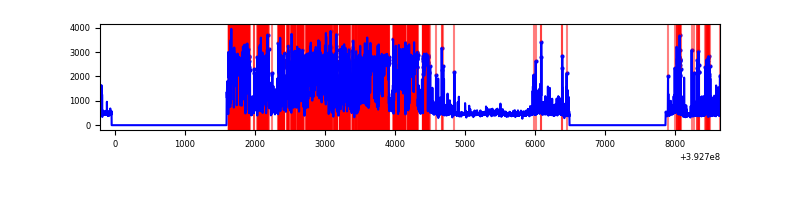 |
Top three noisy pixels from each quadrant. If the there are fewer than three noisy pixels in the level2.evt file, extra rows are filled as -1
| Pixel properties | Quadrant properties | ||||||
|---|---|---|---|---|---|---|---|
| Quadrant | DetID | PixID | Counts | Sigma | Mean | Median | Sigma |
| A | 10 | 83 | 181601 | 1306.17 | 677 | 663 | 138.5 |
| A | 13 | 6 | 11408 | 77.57 | 677 | 663 | 138.5 |
| A | 13 | 254 | 9804 | 65.99 | 677 | 663 | 138.5 |
| B | 5 | 172 | 1178745 | 9335.17 | 654 | 635 | 126.2 |
| B | 5 | 236 | 293912 | 2323.88 | 654 | 635 | 126.2 |
| B | 4 | 171 | 283035 | 2237.7 | 654 | 635 | 126.2 |
| C | 0 | 10 | 623900 | 4070.56 | 653 | 657 | 153.1 |
| C | 15 | 214 | 244812 | 1594.64 | 653 | 657 | 153.1 |
| C | 0 | 207 | 52051 | 335.67 | 653 | 657 | 153.1 |
| D | 12 | 227 | 2767307 | 19076.23 | 587 | 570 | 145.0 |
| D | 2 | 250 | 1324006 | 9124.89 | 587 | 570 | 145.0 |
| D | 12 | 6 | 463251 | 3190.12 | 587 | 570 | 145.0 |
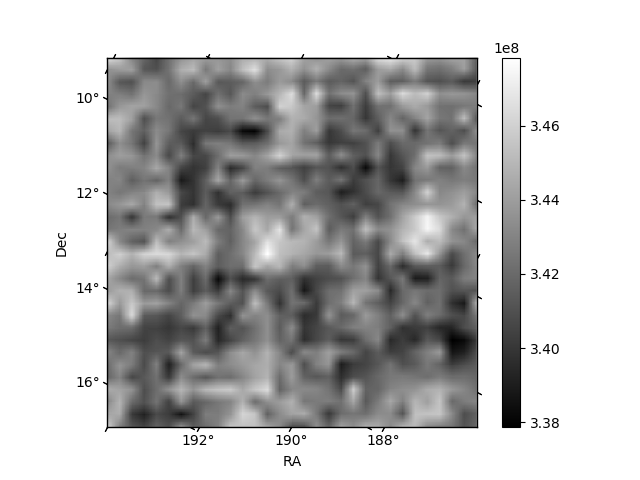
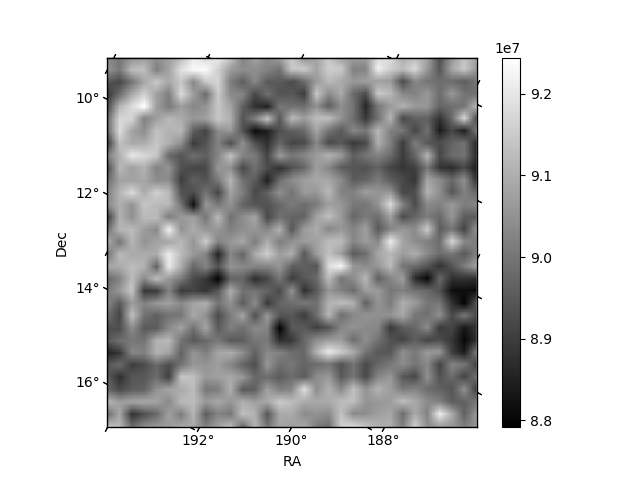
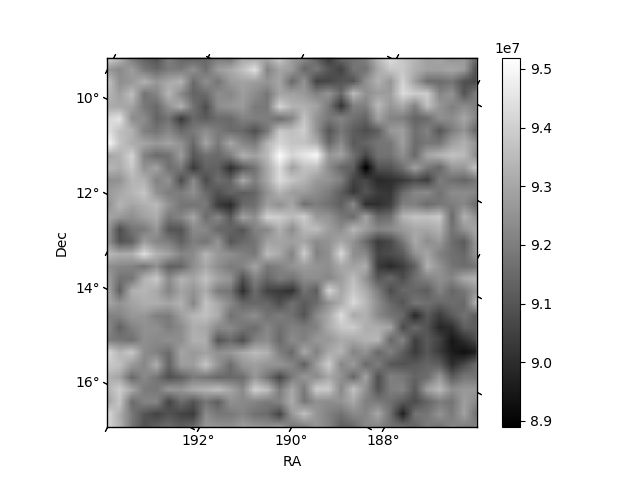
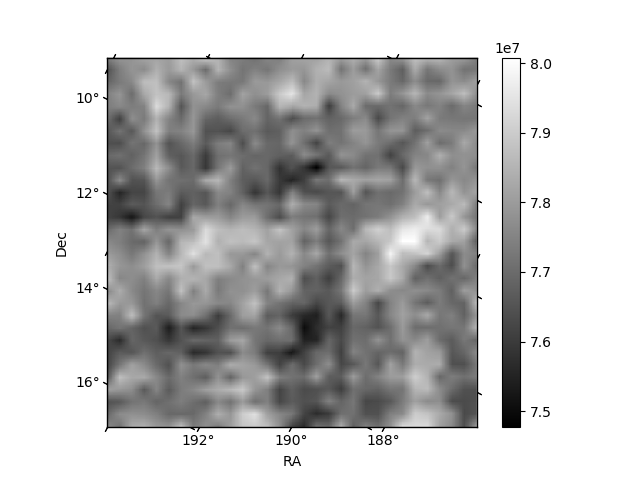
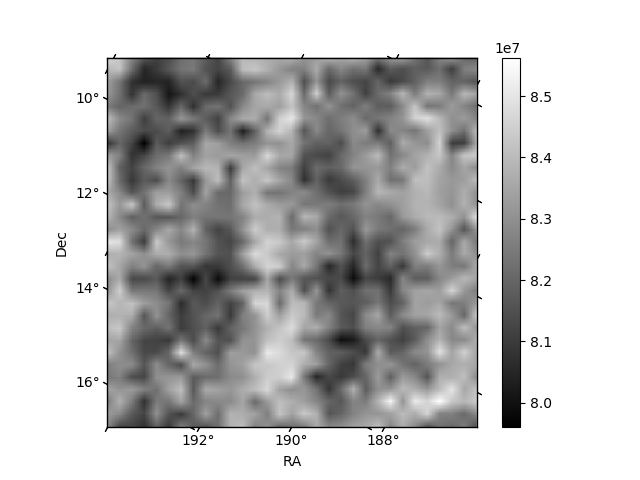
Histogram calculated using DETX and DETY for each event in the final _common_clean file
| Quadrant A | 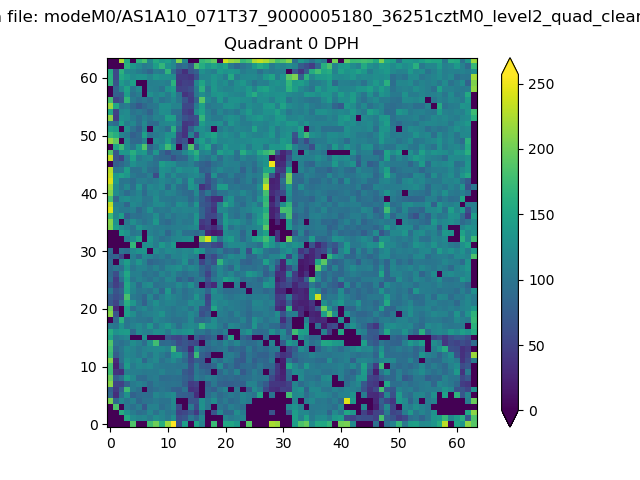 |
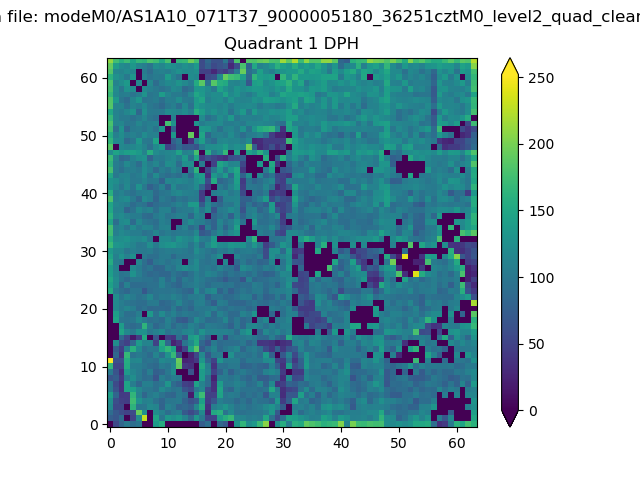 |
Quadrant B |
|---|---|---|---|
| Quadrant D | 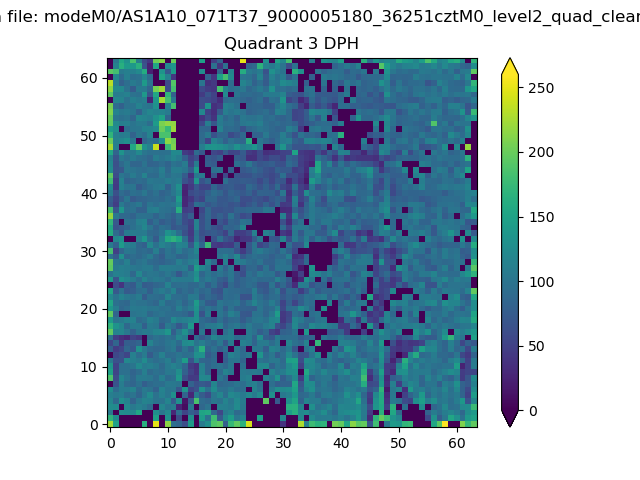 |
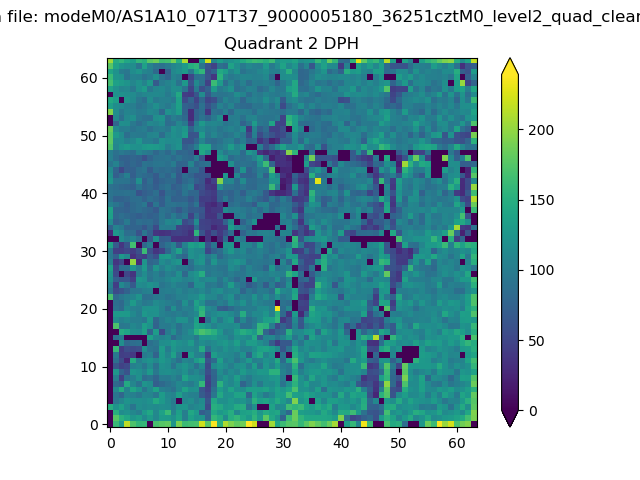 |
Quadrant C |
| Plot type | Count rate plots | Images |
|---|---|---|
| Comparison with Poisson distribution Blue bars denote a histogram of data divided into 1 sec bins. Red curve is a Poisson curve with rate = median count rate of data. |
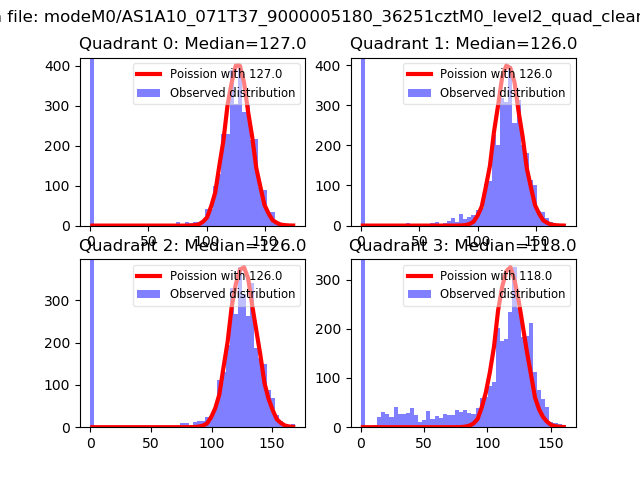 |
 |
| Quadrant-wise count rates Data is divided into 100 sec bins |
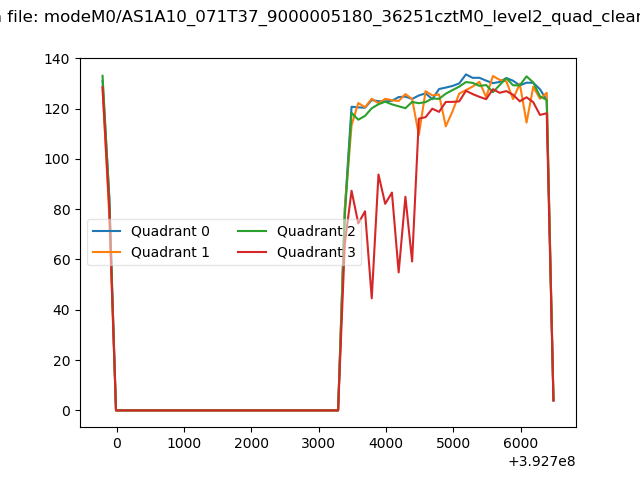 |
|
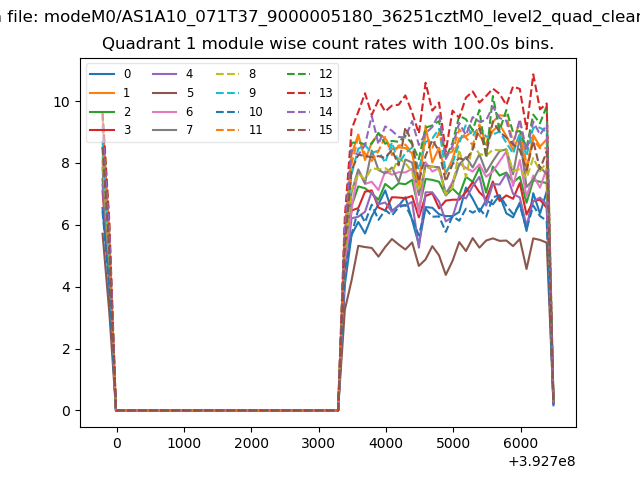
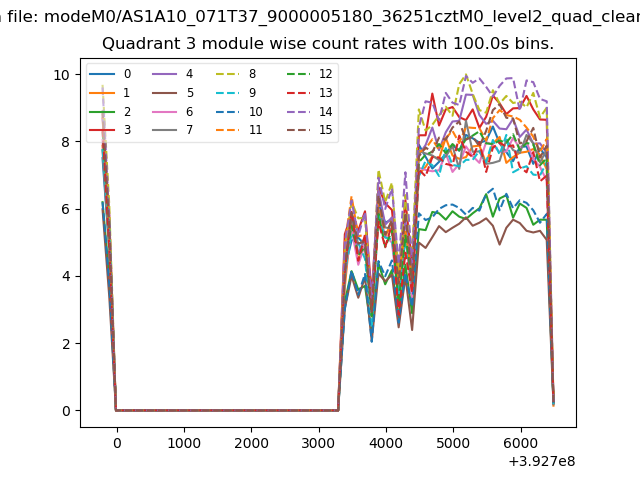
| Module-wise count rates for Quadrant A Data is divided into 100 sec bins |
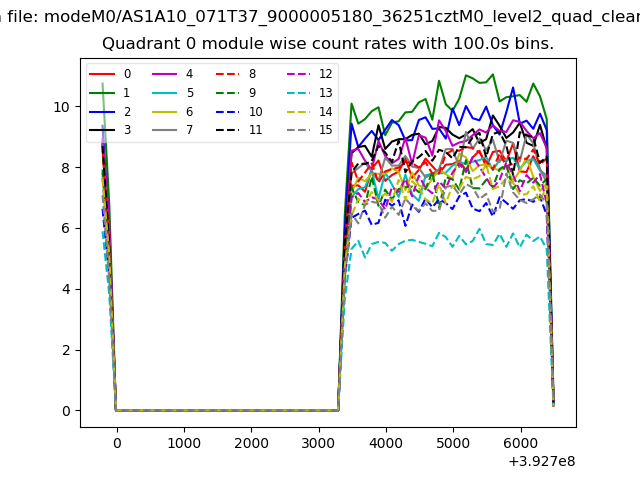 |
 |
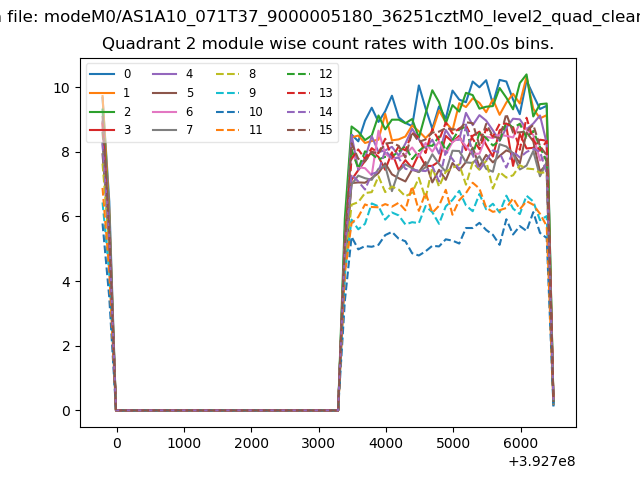
| Module-wise count rates for Quadrant B Data is divided into 100 sec bins |
 |
 |
| Module-wise count rates for Quadrant C Data is divided into 100 sec bins |
 |
 |
| Module-wise count rates for Quadrant D Data is divided into 100 sec bins |
 |
 |
| Parameter | Plot |
|---|---|
| CZT HV Monitor | 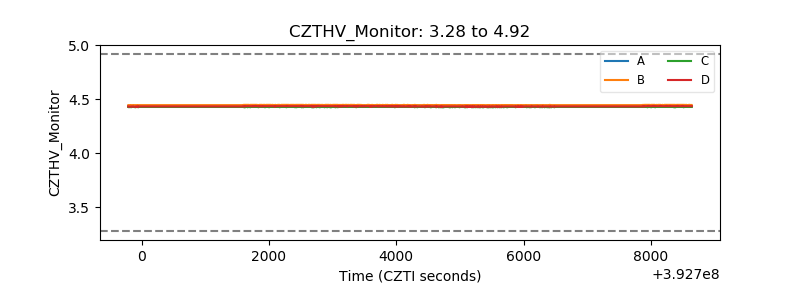 |
| D_VDD | 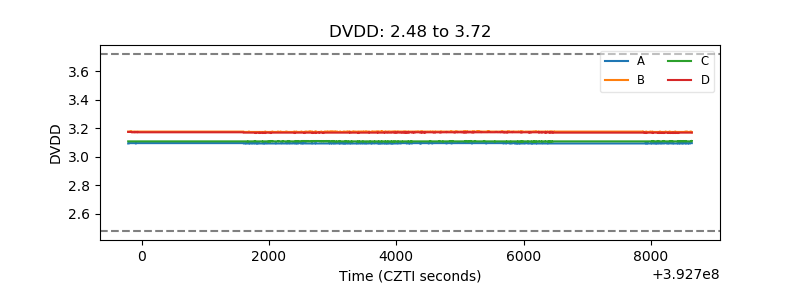 |
| Temperature 1 | 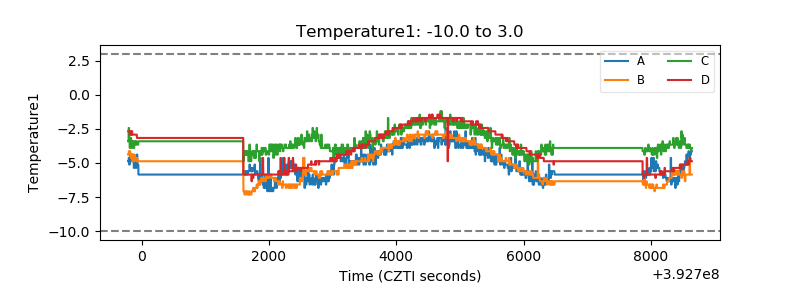 |
| Veto HV Monitor | 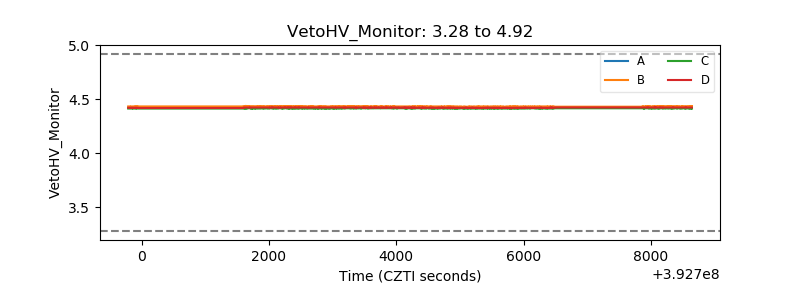 |
| Veto LLD | 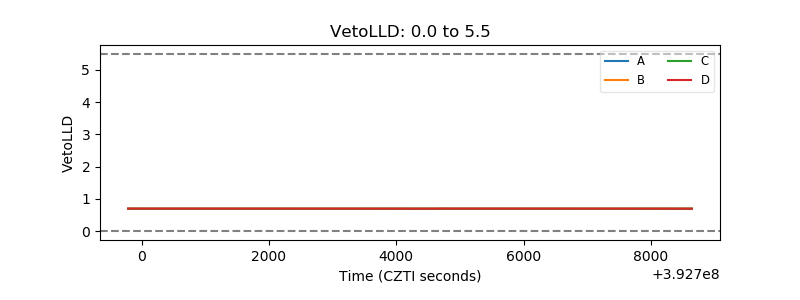 |
| Alpha Counter | 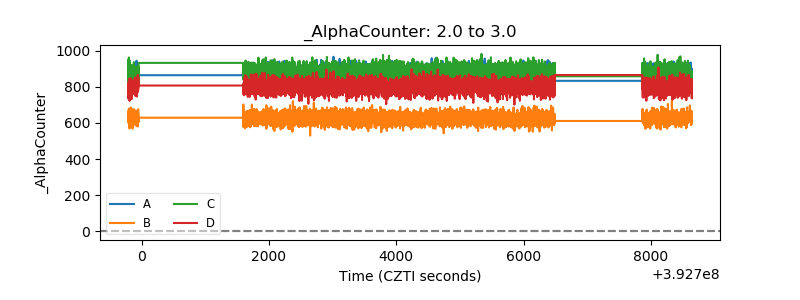 |
| _CPM_Rate | 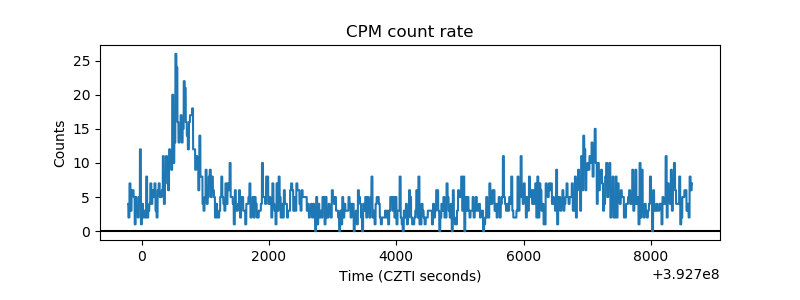 |
| CZT Counter | 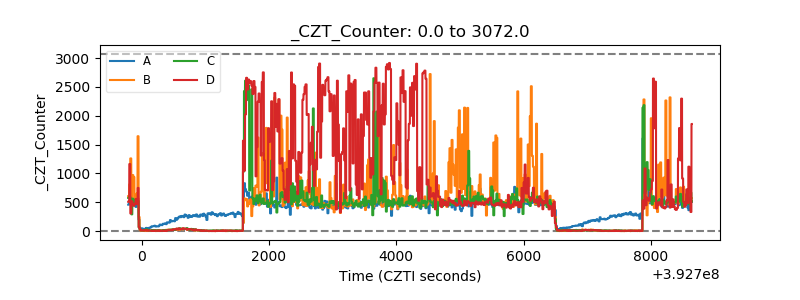 |
| +2.5 Volts monitor | 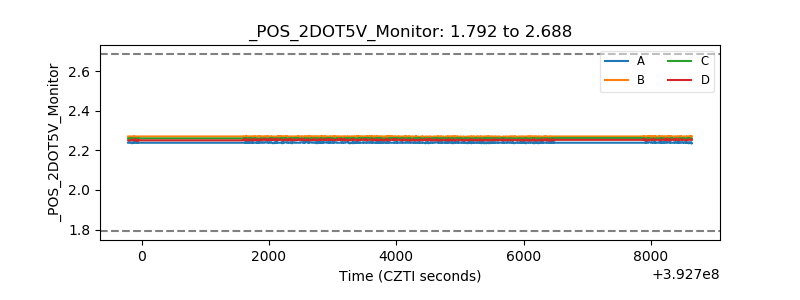 |
| +5 Volts monitor | 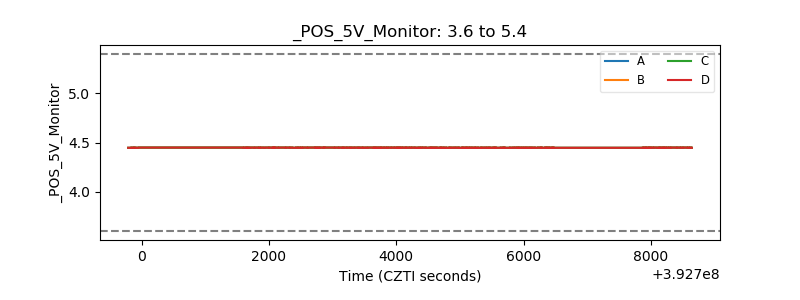 |
| _ROLL_ROT | 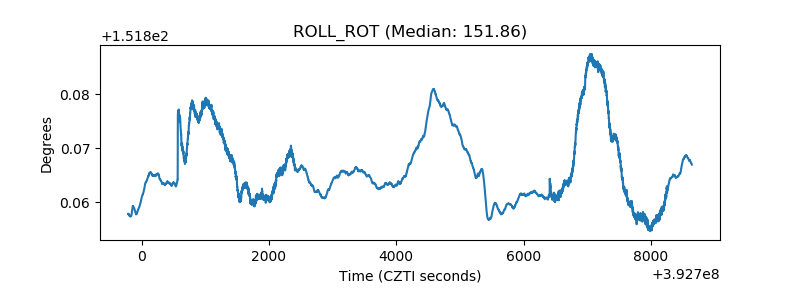 |
| _Roll_DEC | 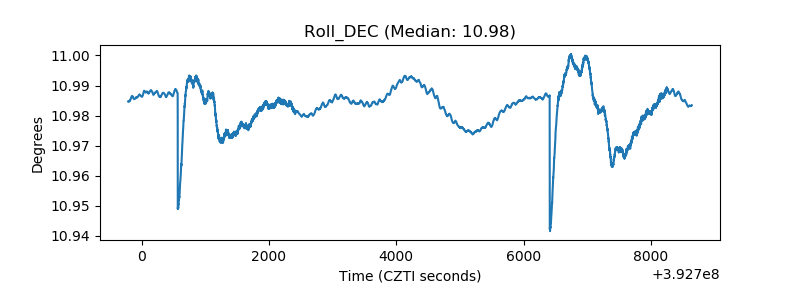 |
| _Roll_RA | 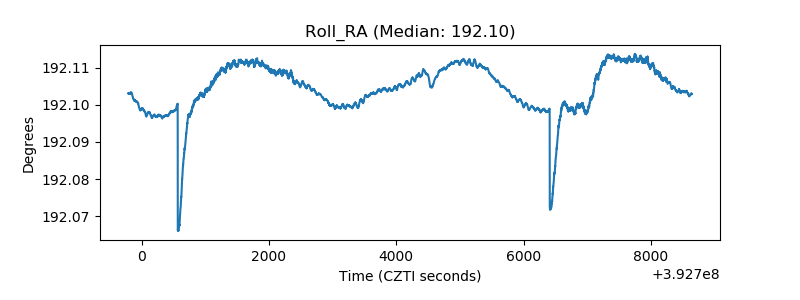 |
| Veto Counter | 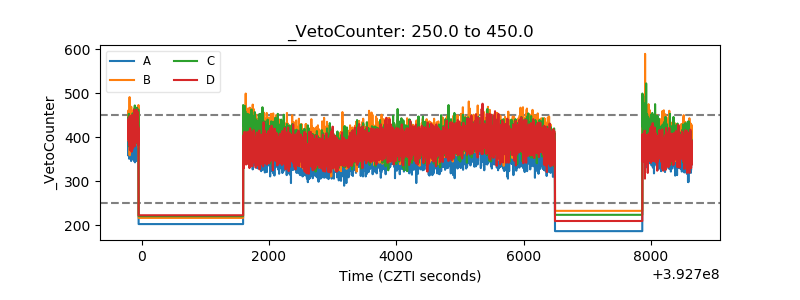 |