| Param | Original file | Final file |
|---|---|---|
| Filename | modeM0/AS1A10_071T37_9000005180_36246cztM0_level2.evt | modeM0/AS1A10_071T37_9000005180_36246cztM0_level2_quad_clean.evt |
| Size (bytes) | 275,803,200 | 30,539,520 |
| Size | 263.0 MB | 29.1 MB |
| Events in quadrant A | 1,772,514 | 173,276 |
| Events in quadrant B | 1,983,986 | 179,124 |
| Events in quadrant C | 1,874,408 | 171,394 |
| Events in quadrant D | 2,487,614 | 157,232 |
| Mode SS | |||
|---|---|---|---|
| Quadrant | BADHDUFLAG | Total packets | Discarded packets |
| A | 0 | 70 | 0 |
| B | 0 | 70 | 0 |
| C | 0 | 70 | 0 |
| D | 0 | 70 | 0 |
| Mode M9 | |||
|---|---|---|---|
| Quadrant | BADHDUFLAG | Total packets | Discarded packets |
| A | 0 | 20 | 0 |
| B | 0 | 20 | 0 |
| C | 0 | 20 | 0 |
| D | 0 | 20 | 0 |
| Mode M0 | |||
|---|---|---|---|
| Quadrant | BADHDUFLAG | Total packets | Discarded packets |
| A | 0 | 7305 | 2 |
| B | 0 | 7956 | 1 |
| C | 0 | 7524 | 1 |
| D | 0 | 9645 | 1 |
| Quadrant | Total seconds | Saturated seconds | Saturation percentage |
|---|---|---|---|
| A | 3430 | 9 | 0.262391% |
| B | 3430 | 43 | 1.253644% |
| C | 3430 | 23 | 0.670554% |
| D | 3430 | 141 | 4.110787% |
Noise dominated data is calculated using 1-second bins in cleaned event files. If a bin has >2000 counts, and if more than 50% of those come from <1% of pixels, then it is considered to be noise-dominated and hence unusable.
| Quadrant | # 1 sec bins | Bins with >0 counts | Bins with >2000 counts | High rate bins dominated by noise | Noise dominated (total time) | Noise dominated (detector-on time) | Marked lightcurve |
|---|---|---|---|---|---|---|---|
| A | 5493 | 3431 | 0 | 0 | 0.00% | 0.00% | 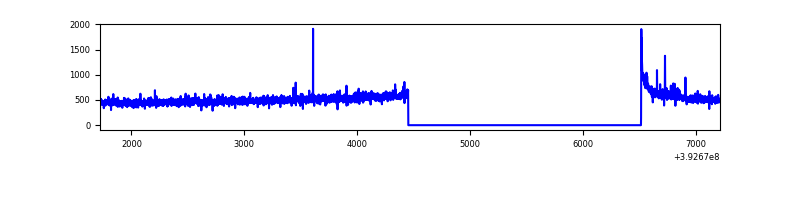 |
| B | 5493 | 3431 | 27 | 27 | 0.49% | 0.79% | 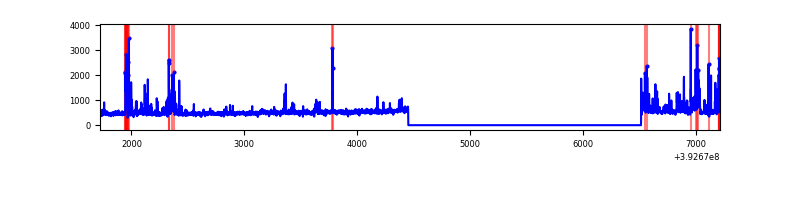 |
| C | 5493 | 3431 | 12 | 12 | 0.22% | 0.35% | 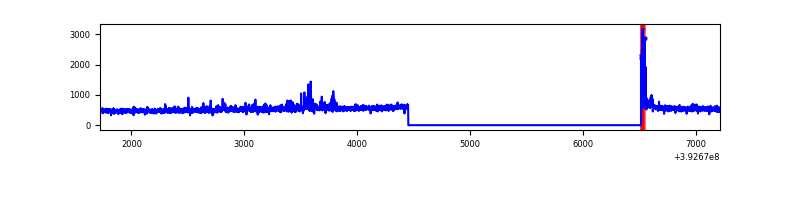 |
| D | 5493 | 3431 | 127 | 127 | 2.31% | 3.70% | 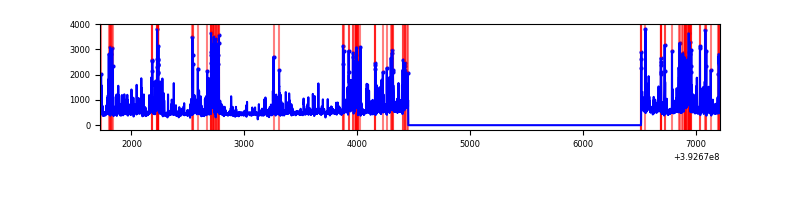 |
Top three noisy pixels from each quadrant. If the there are fewer than three noisy pixels in the level2.evt file, extra rows are filled as -1
| Pixel properties | Quadrant properties | ||||||
|---|---|---|---|---|---|---|---|
| Quadrant | DetID | PixID | Counts | Sigma | Mean | Median | Sigma |
| A | 10 | 83 | 97321 | 1115.26 | 428 | 421 | 86.9 |
| A | 9 | 143 | 10729 | 118.64 | 428 | 421 | 86.9 |
| A | 13 | 6 | 9243 | 101.54 | 428 | 421 | 86.9 |
| B | 5 | 236 | 156959 | 1888.15 | 428 | 419 | 82.9 |
| B | 5 | 172 | 104842 | 1259.53 | 428 | 419 | 82.9 |
| B | 8 | 128 | 22197 | 262.68 | 428 | 419 | 82.9 |
| C | 15 | 214 | 142315 | 1443.89 | 416 | 420 | 98.3 |
| C | 0 | 10 | 83740 | 847.84 | 416 | 420 | 98.3 |
| C | 0 | 207 | 23153 | 231.33 | 416 | 420 | 98.3 |
| D | 12 | 6 | 637260 | 6430.71 | 404 | 392 | 99.0 |
| D | 13 | 171 | 76271 | 766.18 | 404 | 392 | 99.0 |
| D | 13 | 249 | 54702 | 548.39 | 404 | 392 | 99.0 |
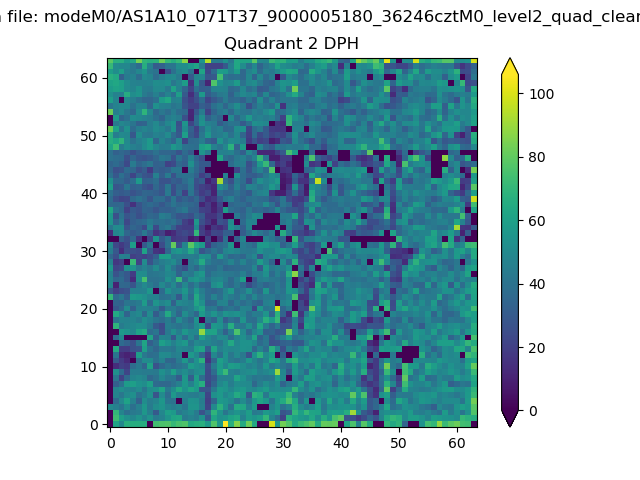
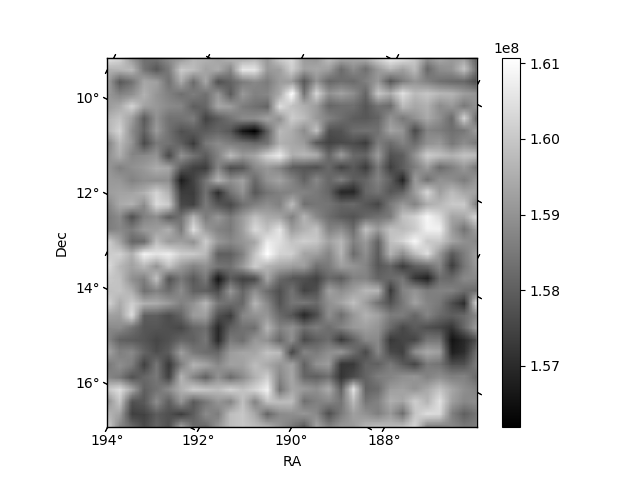
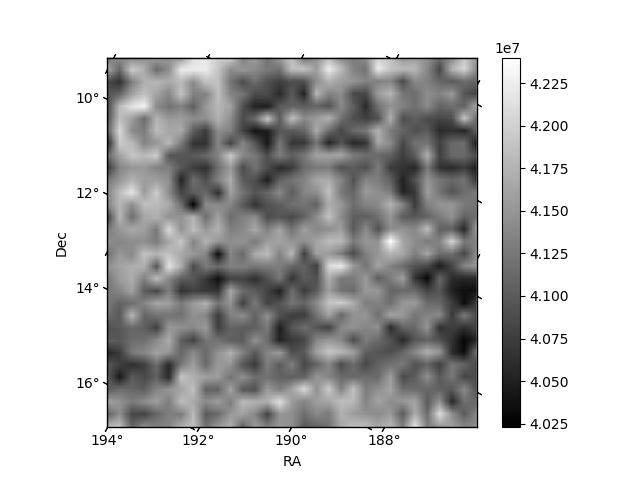
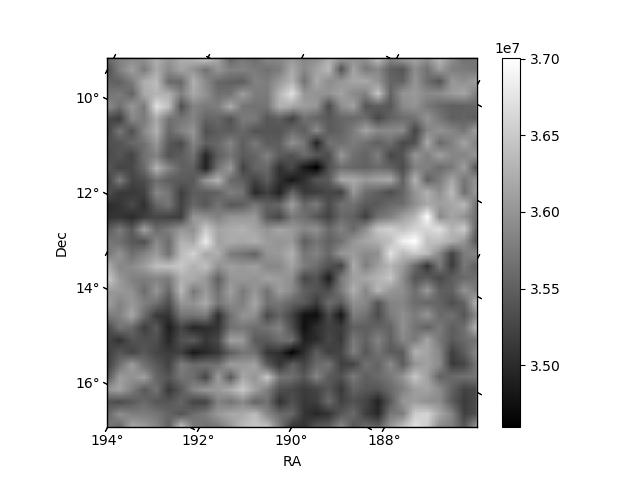
Histogram calculated using DETX and DETY for each event in the final _common_clean file
| Quadrant A | 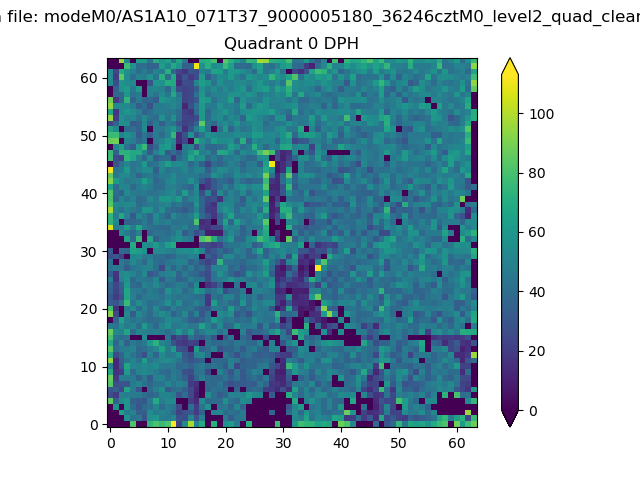 |
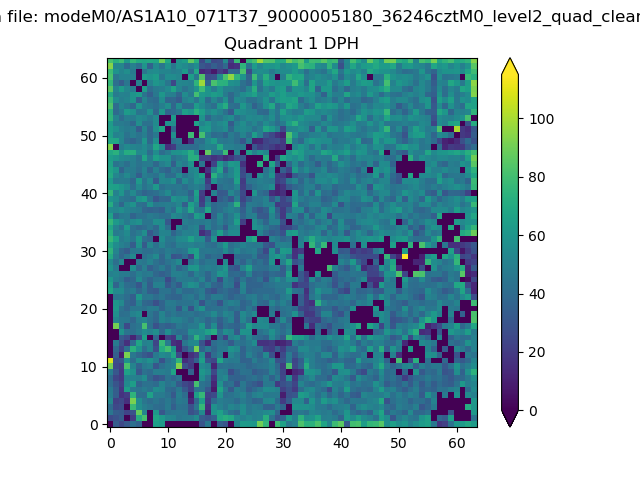 |
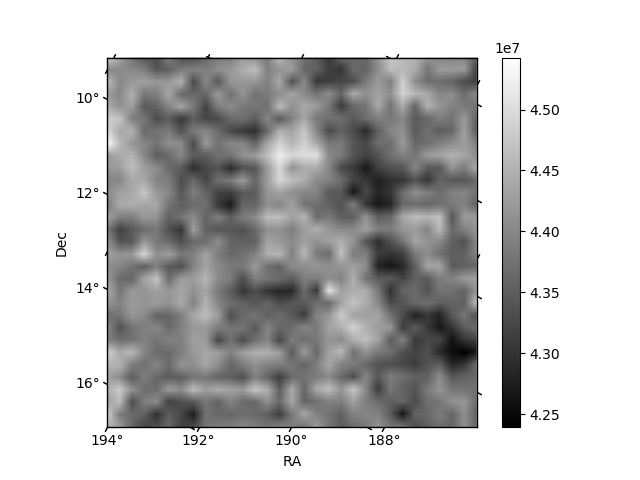
Quadrant B |
|---|---|---|---|
| Quadrant D | 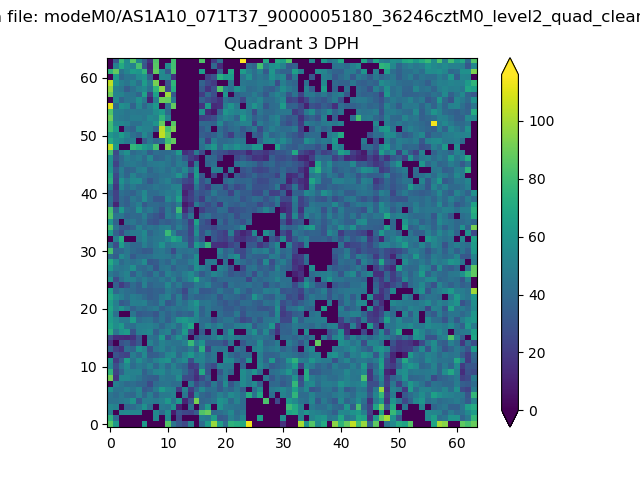 |
 |
Quadrant C |
| Plot type | Count rate plots | Images |
|---|---|---|
| Comparison with Poisson distribution Blue bars denote a histogram of data divided into 1 sec bins. Red curve is a Poisson curve with rate = median count rate of data. |
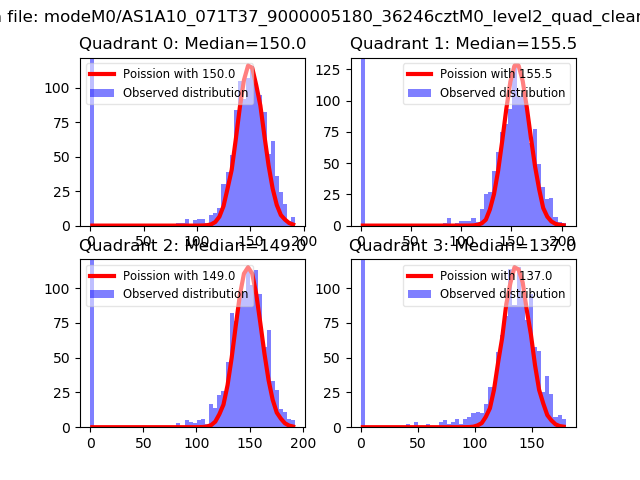 |
 |
| Quadrant-wise count rates Data is divided into 100 sec bins |
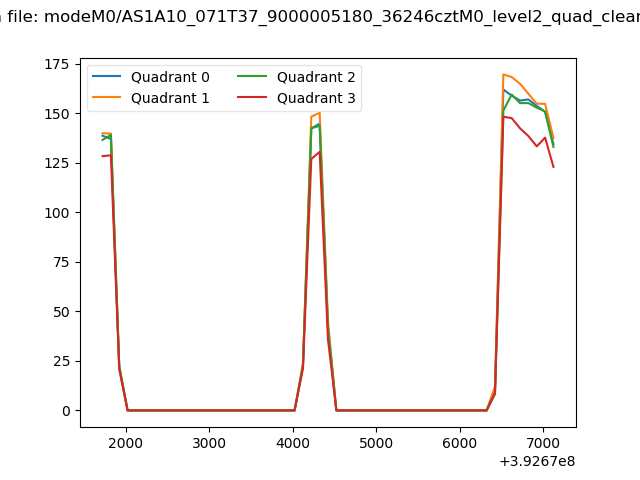 |
|
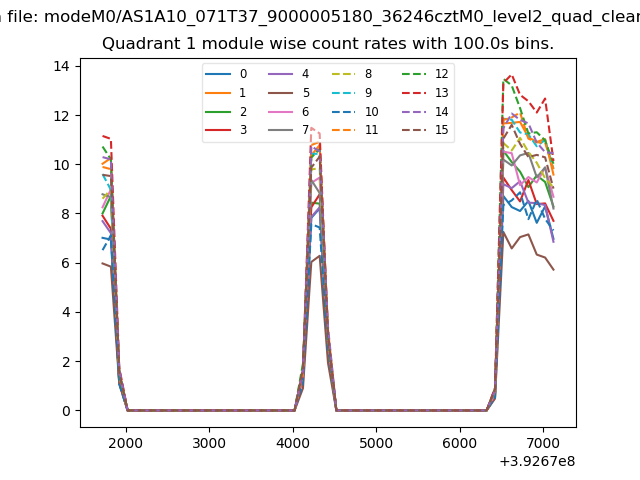
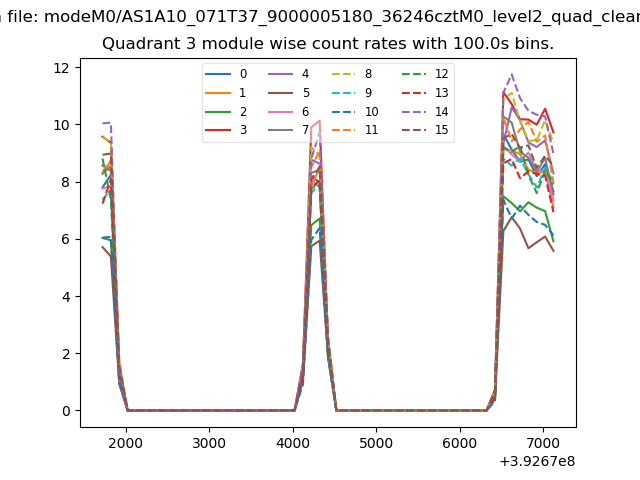
| Module-wise count rates for Quadrant A Data is divided into 100 sec bins |
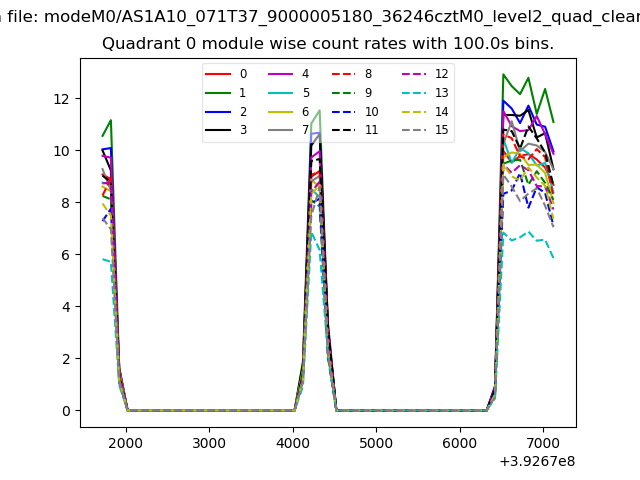 |
 |
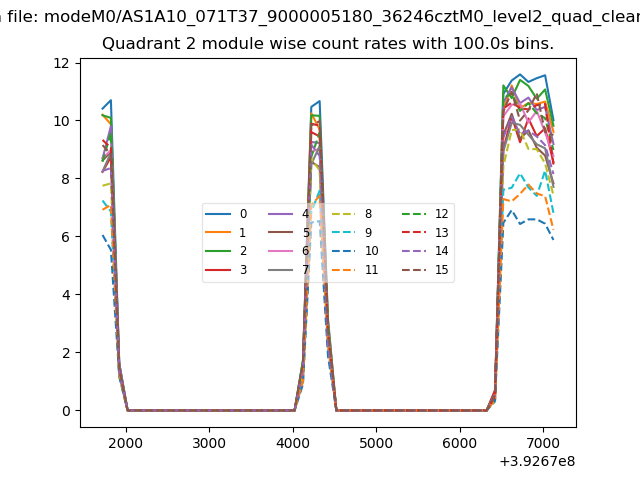
| Module-wise count rates for Quadrant B Data is divided into 100 sec bins |
 |
 |
| Module-wise count rates for Quadrant C Data is divided into 100 sec bins |
 |
 |
| Module-wise count rates for Quadrant D Data is divided into 100 sec bins |
 |
 |
| Parameter | Plot |
|---|---|
| CZT HV Monitor | 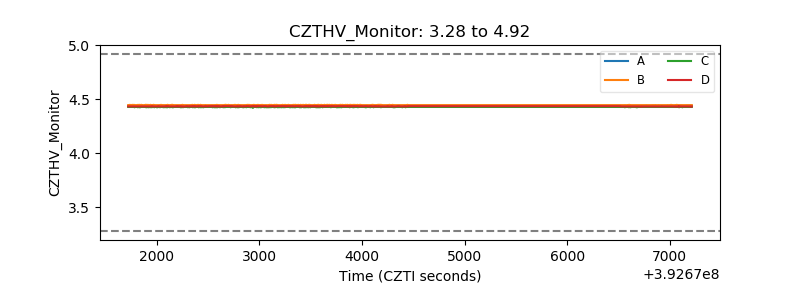 |
| D_VDD | 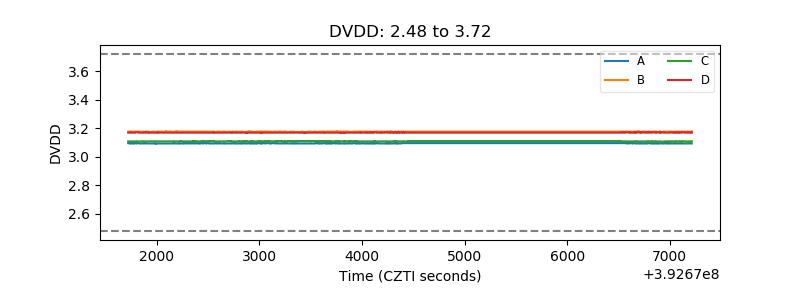 |
| Temperature 1 | 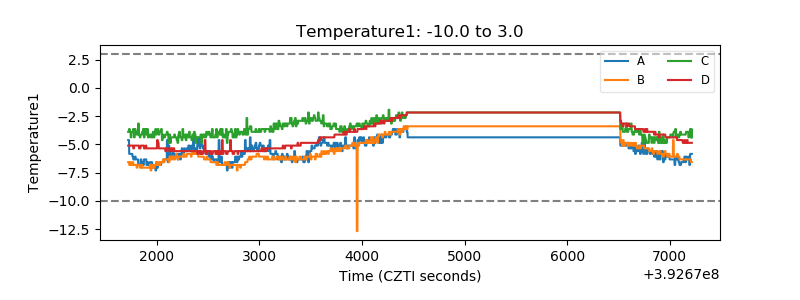 |
| Veto HV Monitor | 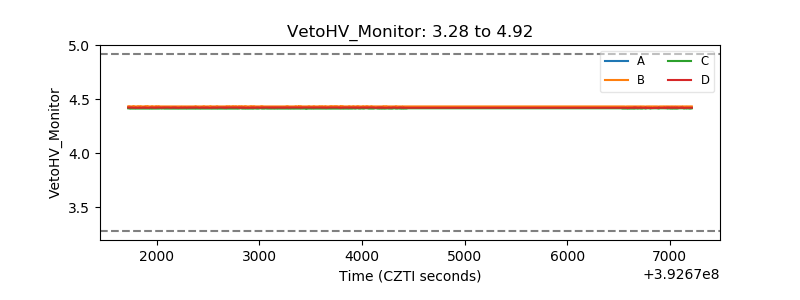 |
| Veto LLD | 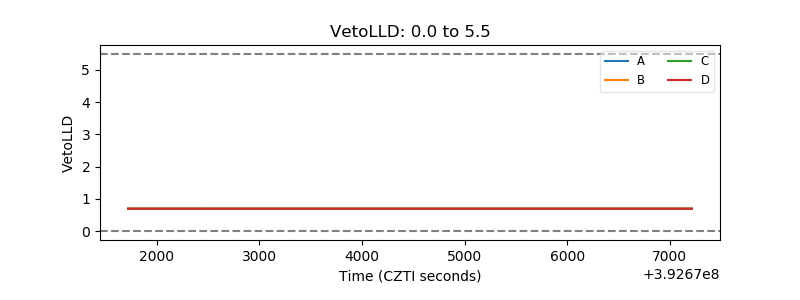 |
| Alpha Counter | 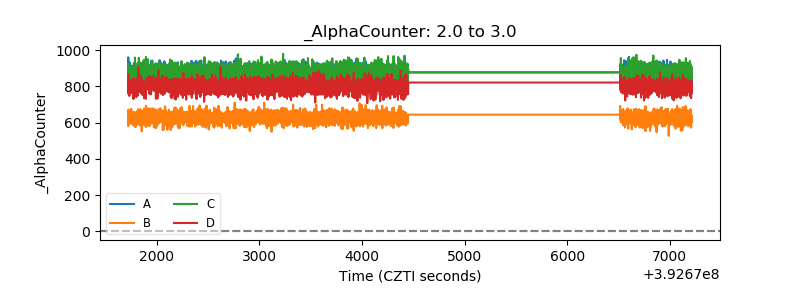 |
| _CPM_Rate | 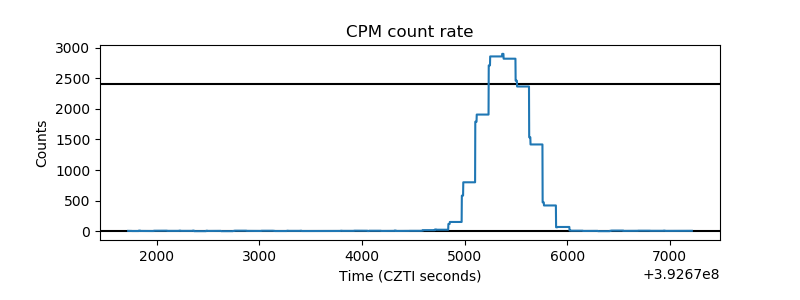 |
| CZT Counter | 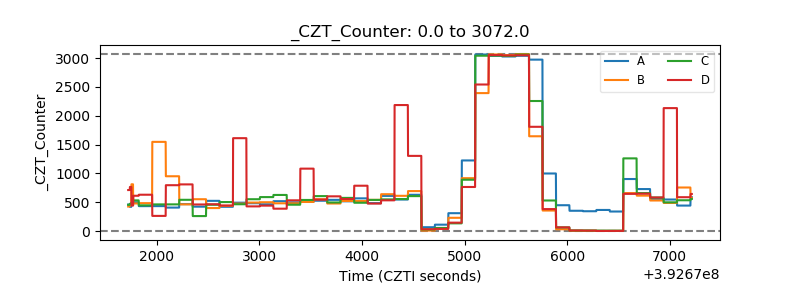 |
| +2.5 Volts monitor | 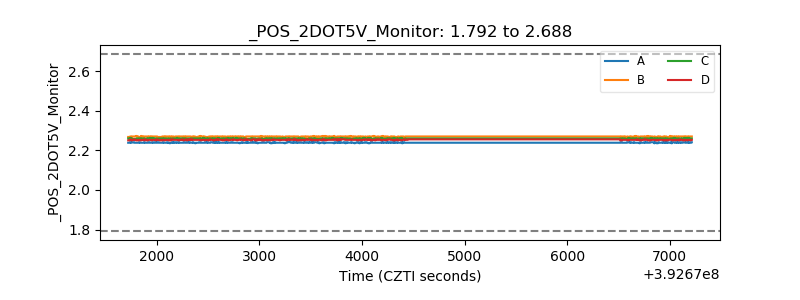 |
| +5 Volts monitor | 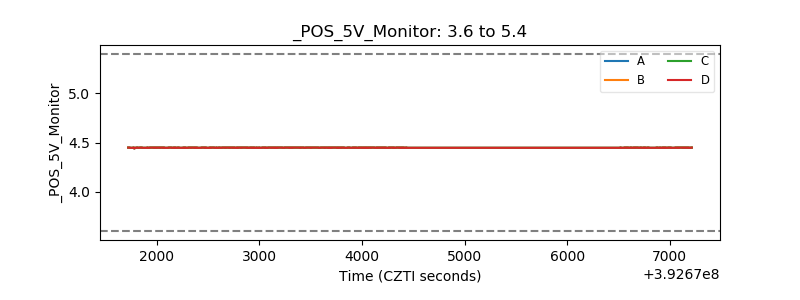 |
| _ROLL_ROT | 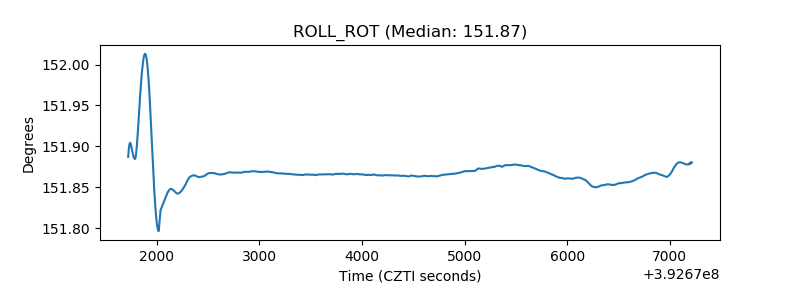 |
| _Roll_DEC |  |
| _Roll_RA | 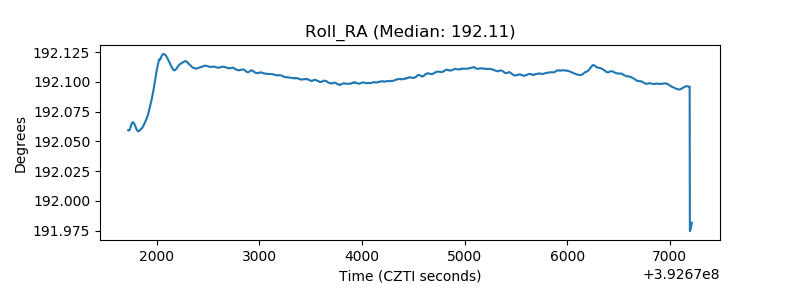 |
| Veto Counter | 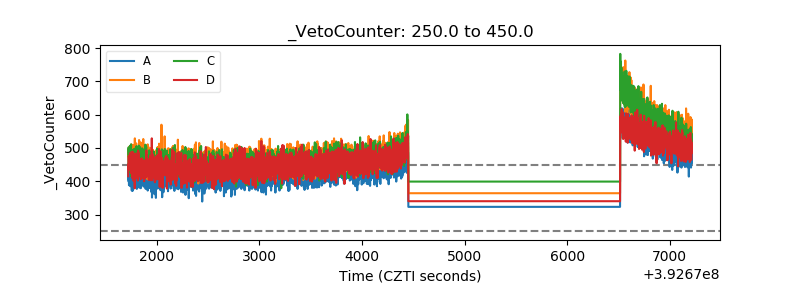 |