| Param | Original file | Final file |
|---|---|---|
| Filename | modeM0/AS1A10_071T37_9000005180cztM0_level2_bc.evt | modeM0/AS1A10_071T37_9000005180cztM0_level2_quad_clean.evt |
| Size (bytes) | 2,650,855,680 | 688,708,800 |
| Size | 2.5 GB | 656.8 MB |
| Events in quadrant A | 12,565,726 | 4,422,095 |
| Events in quadrant B | 22,767,416 | 4,262,475 |
| Events in quadrant C | 16,640,079 | 4,332,389 |
| Events in quadrant D | 24,523,190 | 4,026,563 |
| Mode SS | |||
|---|---|---|---|
| Quadrant | BADHDUFLAG | Total packets | Discarded packets |
| A | 0 | 1138 | 0 |
| B | 0 | 1138 | 0 |
| C | 0 | 1138 | 0 |
| D | 0 | 1138 | 0 |
| Mode M9 | |||
|---|---|---|---|
| Quadrant | BADHDUFLAG | Total packets | Discarded packets |
| A | 0 | 202 | 0 |
| B | 0 | 202 | 0 |
| C | 0 | 202 | 0 |
| D | 0 | 202 | 0 |
| Mode M0 | |||
|---|---|---|---|
| Quadrant | BADHDUFLAG | Total packets | Discarded packets |
| A | 0 | 114659 | 0 |
| B | 0 | 162906 | 0 |
| C | 0 | 126729 | 0 |
| D | 0 | 161261 | 0 |
| Quadrant | Total seconds | Saturated seconds | Saturation percentage |
|---|---|---|---|
| A | 55607 | 99 | 0.178035% |
| B | 55607 | 4676 | 8.409013% |
| C | 55607 | 958 | 1.722805% |
| D | 55607 | 3556 | 6.394878% |
Noise dominated data is calculated using 1-second bins in cleaned event files. If a bin has >2000 counts, and if more than 50% of those come from <1% of pixels, then it is considered to be noise-dominated and hence unusable.
| Quadrant | # 1 sec bins | Bins with >0 counts | Bins with >2000 counts | High rate bins dominated by noise | Noise dominated (total time) | Noise dominated (detector-on time) | Marked lightcurve |
|---|---|---|---|---|---|---|---|
| A | 75980 | 55619 | 2 | 2 | 0.00% | 0.00% | 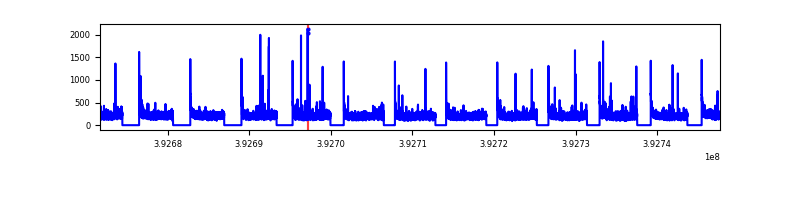 |
| B | 75980 | 55601 | 182 | 182 | 0.24% | 0.33% | 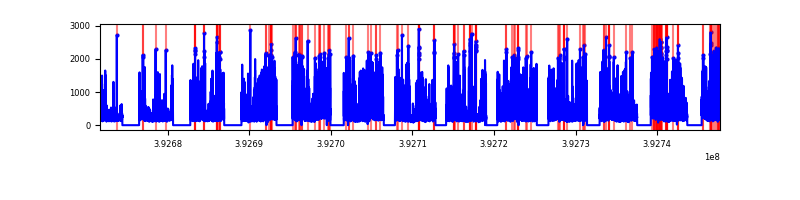 |
| C | 75980 | 55607 | 191 | 191 | 0.25% | 0.34% | 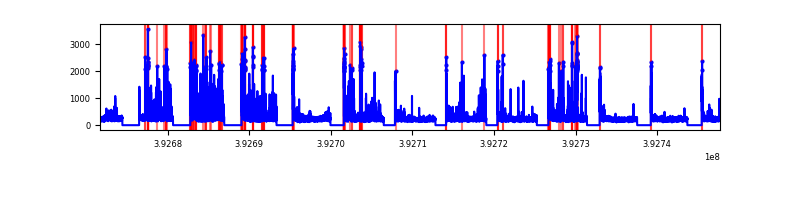 |
| D | 75980 | 55605 | 900 | 900 | 1.18% | 1.62% | 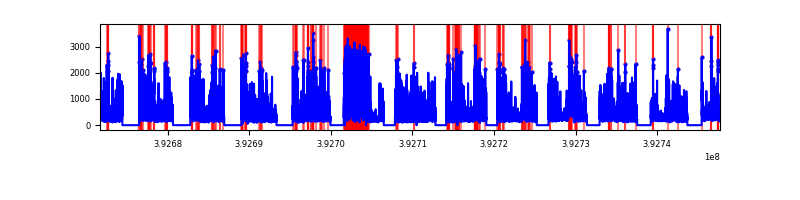 |
Top three noisy pixels from each quadrant. If the there are fewer than three noisy pixels in the level2.evt file, extra rows are filled as -1
| Pixel properties | Quadrant properties | ||||||
|---|---|---|---|---|---|---|---|
| Quadrant | DetID | PixID | Counts | Sigma | Mean | Median | Sigma |
| A | 10 | 83 | 1371967 | 2163.58 | 2836 | 2782 | 632.8 |
| A | 9 | 143 | 139830 | 216.56 | 2836 | 2782 | 632.8 |
| A | 13 | 254 | 89997 | 137.82 | 2836 | 2782 | 632.8 |
| B | 5 | 172 | 6127013 | 11285.04 | 2756 | 2701 | 542.7 |
| B | 5 | 236 | 2992373 | 5508.96 | 2756 | 2701 | 542.7 |
| B | 4 | 171 | 1829155 | 3365.54 | 2756 | 2701 | 542.7 |
| C | 15 | 214 | 2174930 | 3435.59 | 2757 | 2731 | 632.3 |
| C | 0 | 207 | 2027347 | 3202.17 | 2757 | 2731 | 632.3 |
| C | 0 | 10 | 1597625 | 2522.51 | 2757 | 2731 | 632.3 |
| D | 12 | 6 | 5080647 | 7898.93 | 2700 | 2616 | 642.9 |
| D | 12 | 227 | 2858616 | 4442.54 | 2700 | 2616 | 642.9 |
| D | 2 | 250 | 1510786 | 2345.98 | 2700 | 2616 | 642.9 |
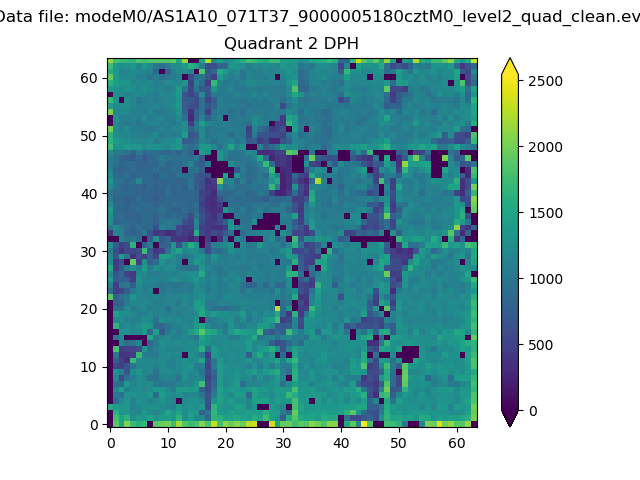
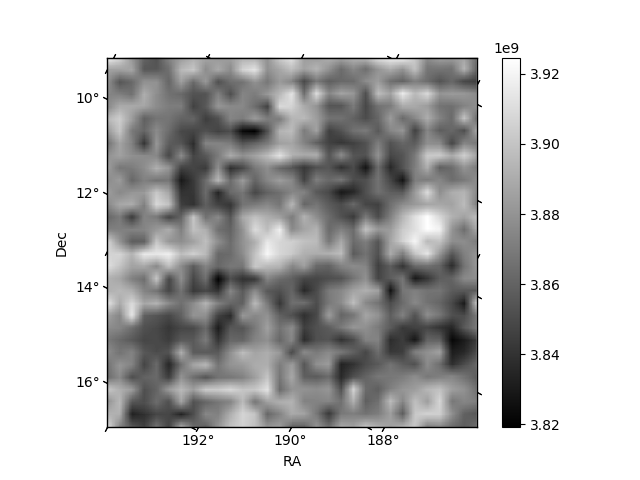
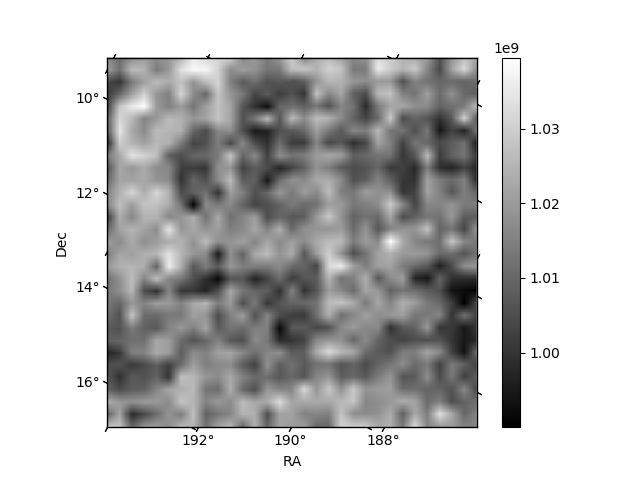
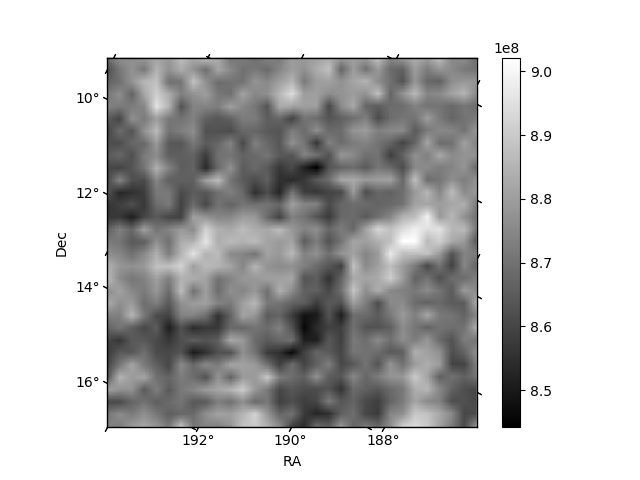
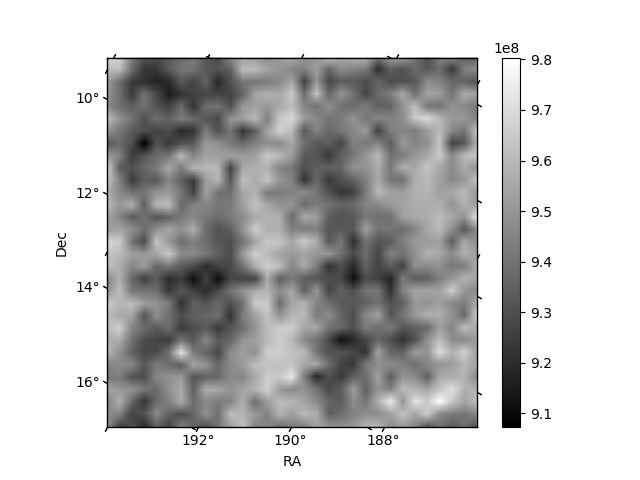
Histogram calculated using DETX and DETY for each event in the final _common_clean file
| Quadrant A | 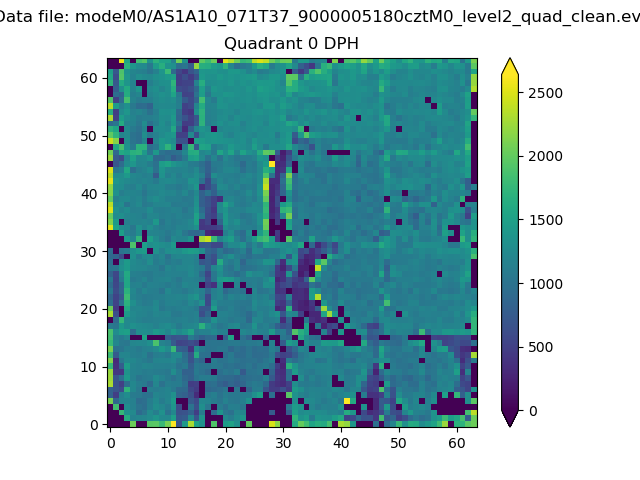 |
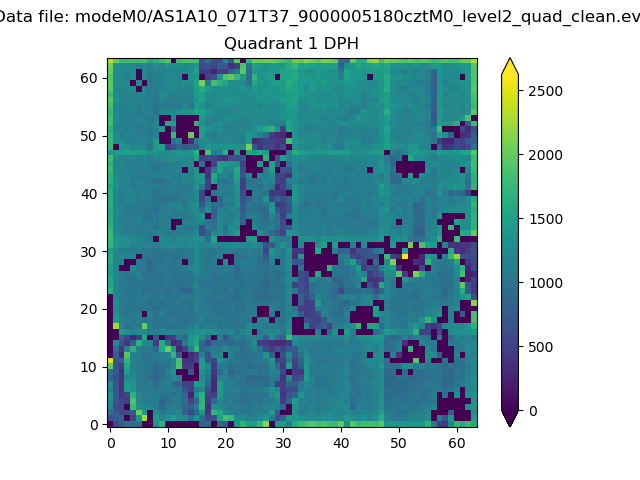 |
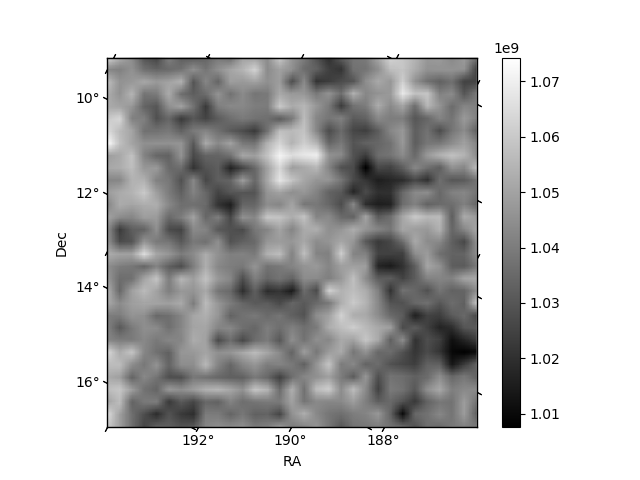
Quadrant B |
|---|---|---|---|
| Quadrant D | 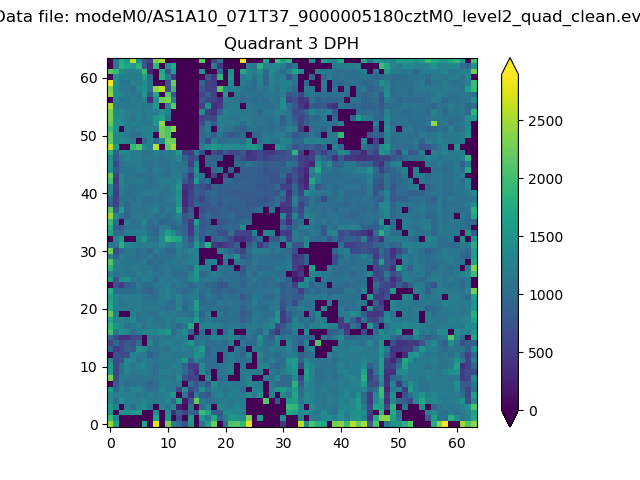 |
 |
Quadrant C |
| Plot type | Count rate plots | Images |
|---|---|---|
| Comparison with Poisson distribution Blue bars denote a histogram of data divided into 1 sec bins. Red curve is a Poisson curve with rate = median count rate of data. |
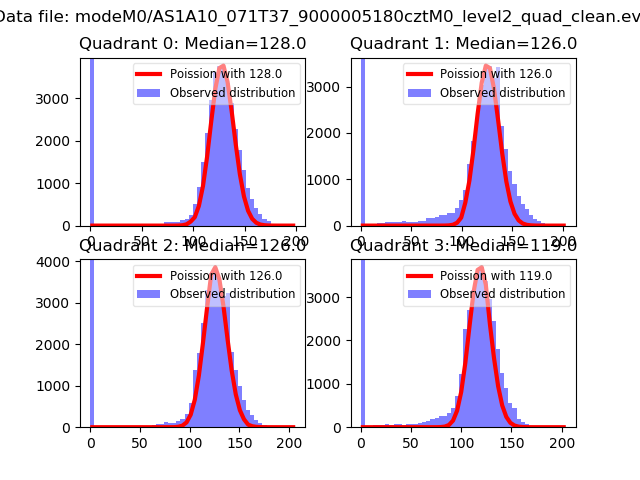 |
 |
| Quadrant-wise count rates Data is divided into 100 sec bins |
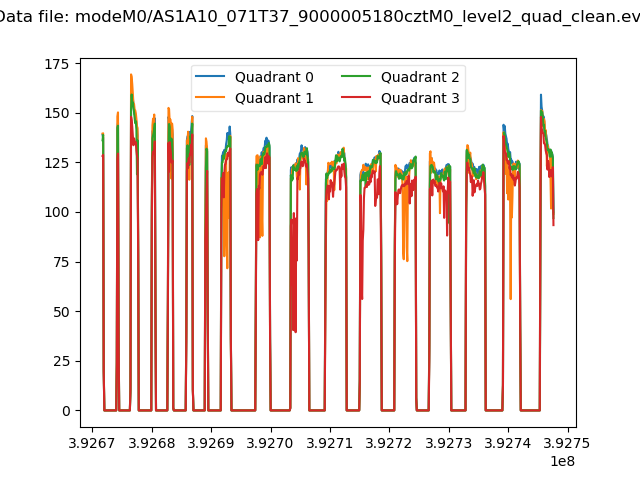 |
|
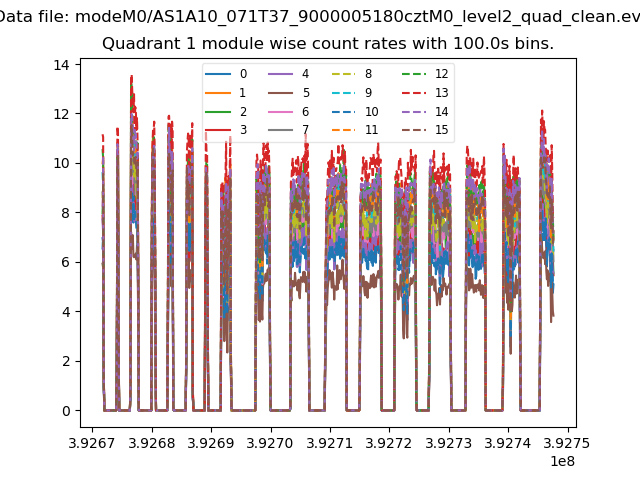
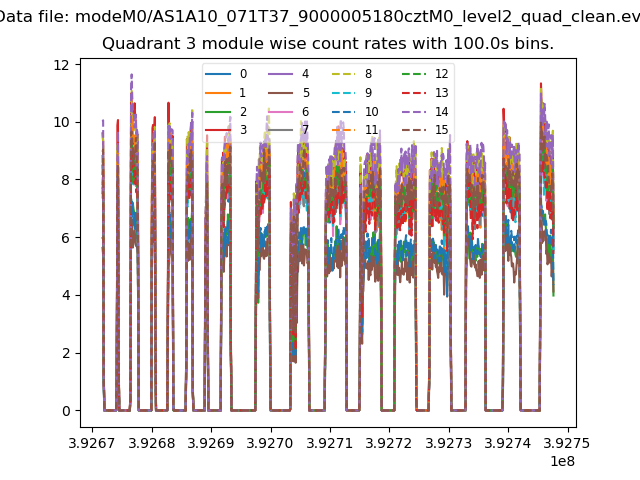
| Module-wise count rates for Quadrant A Data is divided into 100 sec bins |
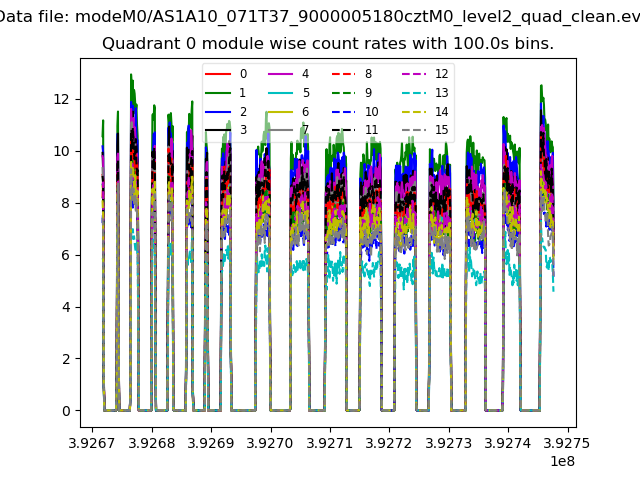 |
 |
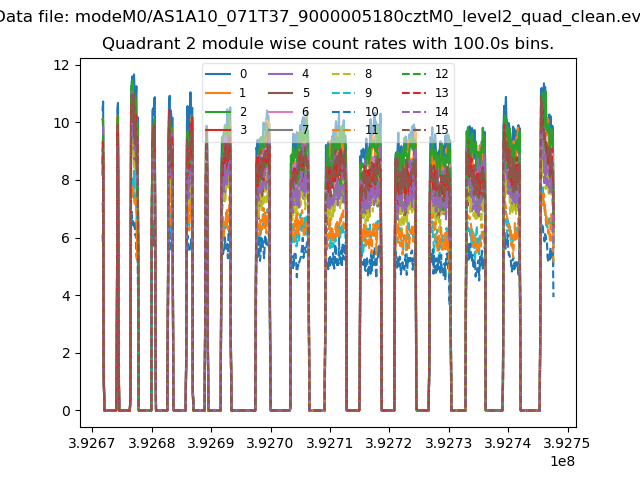
| Module-wise count rates for Quadrant B Data is divided into 100 sec bins |
 |
 |
| Module-wise count rates for Quadrant C Data is divided into 100 sec bins |
 |
 |
| Module-wise count rates for Quadrant D Data is divided into 100 sec bins |
 |
 |
| Parameter | Plot |
|---|---|
| CZT HV Monitor | 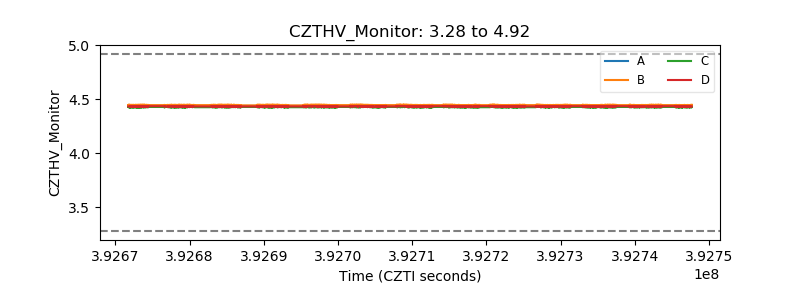 |
| D_VDD | 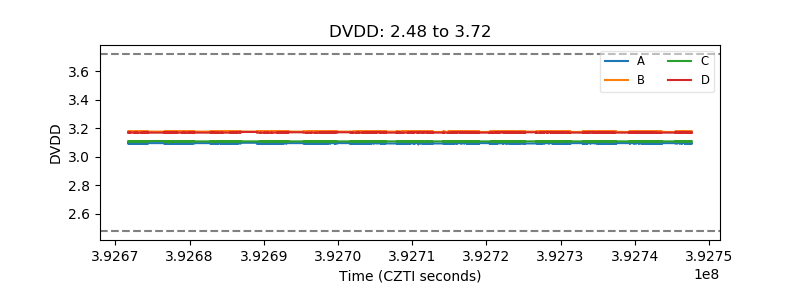 |
| Temperature 1 | 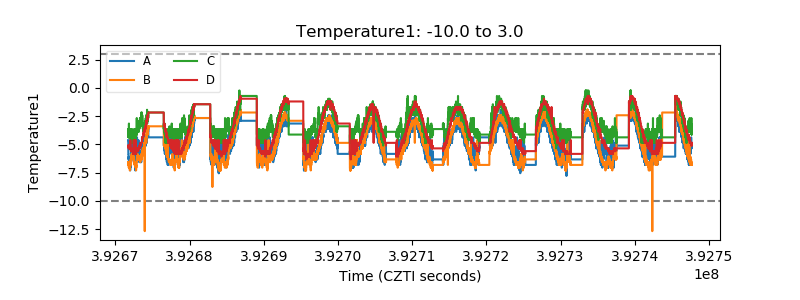 |
| Veto HV Monitor | 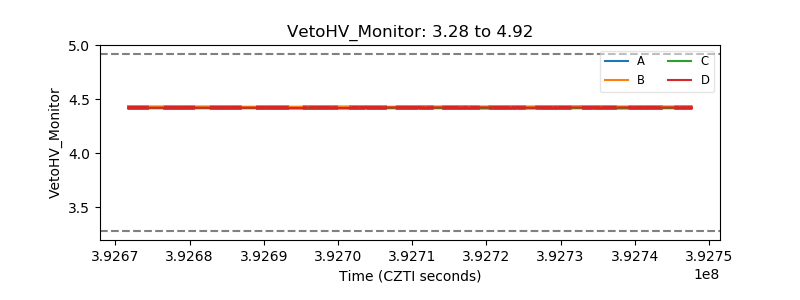 |
| Veto LLD | 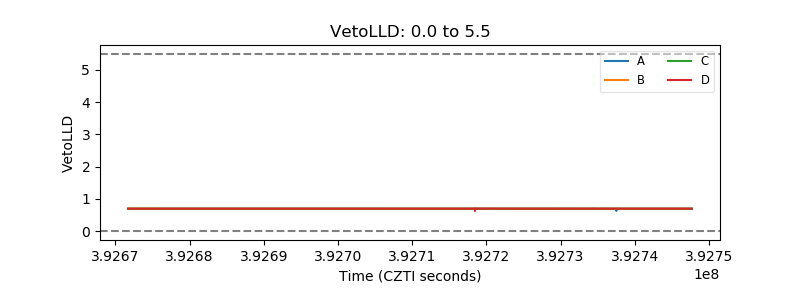 |
| Alpha Counter | 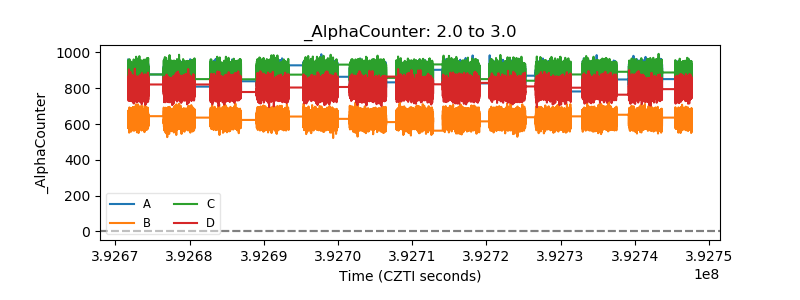 |
| _CPM_Rate | 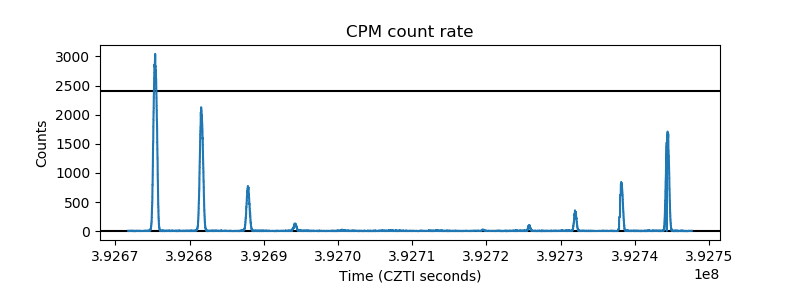 |
| CZT Counter | 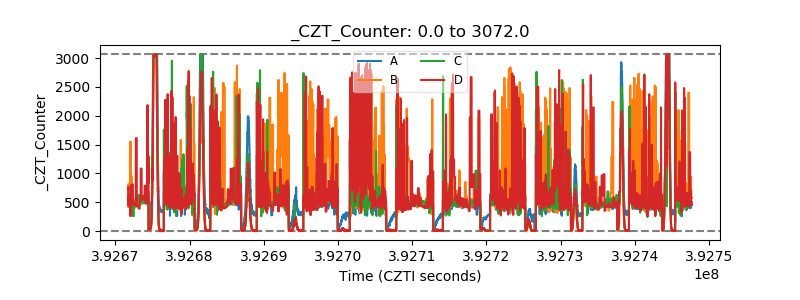 |
| +2.5 Volts monitor | 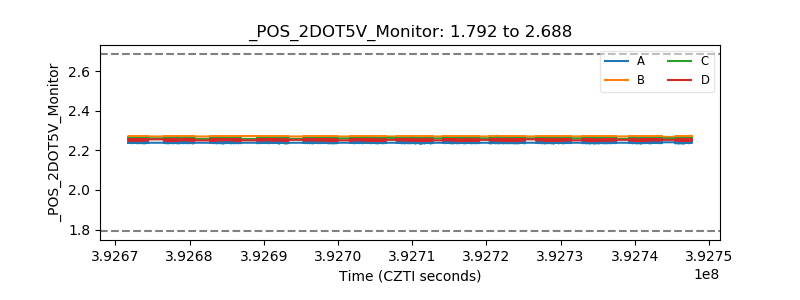 |
| +5 Volts monitor | 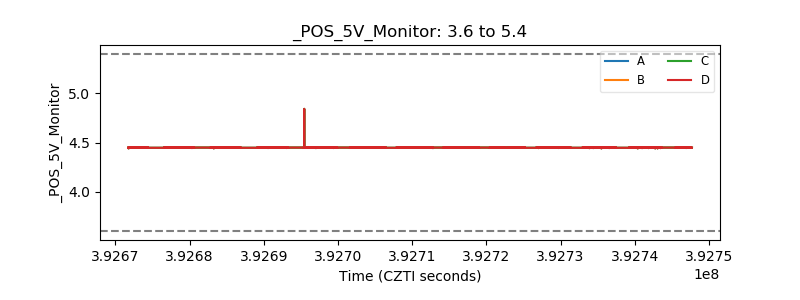 |
| _ROLL_ROT | 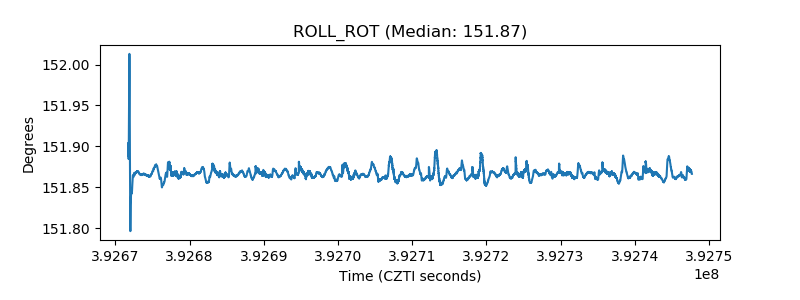 |
| _Roll_DEC | 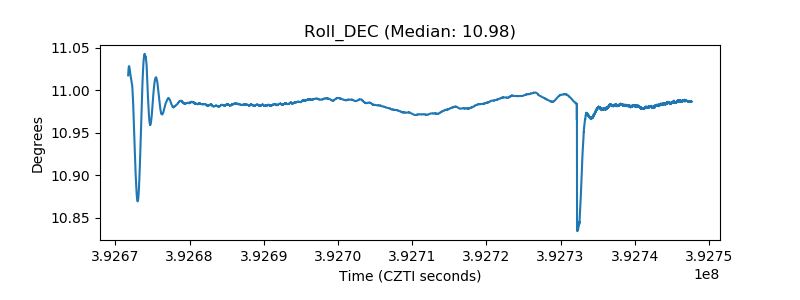 |
| _Roll_RA | 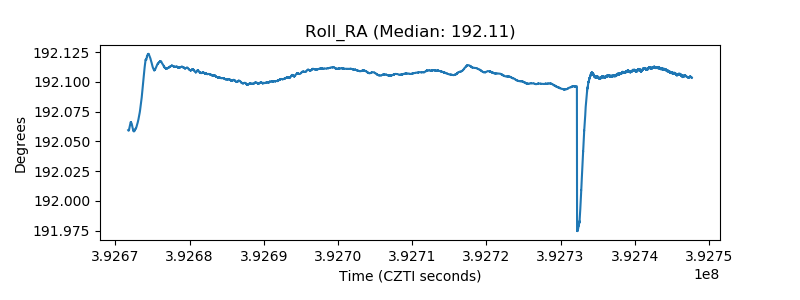 |
| Veto Counter | 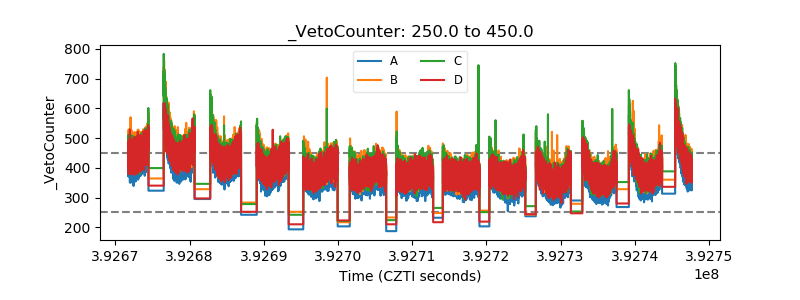 |