| Param | Original file | Final file |
|---|---|---|
| Filename | modeM0/AS1A10_071T34_9000005178_36245cztM0_level2.evt | modeM0/AS1A10_071T34_9000005178_36245cztM0_level2_quad_clean.evt |
| Size (bytes) | 473,402,880 | 67,348,800 |
| Size | 451.5 MB | 64.2 MB |
| Events in quadrant A | 2,630,302 | 431,704 |
| Events in quadrant B | 4,177,199 | 429,350 |
| Events in quadrant C | 3,092,843 | 426,059 |
| Events in quadrant D | 4,088,012 | 391,945 |
| Mode SS | |||
|---|---|---|---|
| Quadrant | BADHDUFLAG | Total packets | Discarded packets |
| A | 0 | 104 | 0 |
| B | 0 | 104 | 0 |
| C | 0 | 104 | 0 |
| D | 0 | 104 | 0 |
| Mode M9 | |||
|---|---|---|---|
| Quadrant | BADHDUFLAG | Total packets | Discarded packets |
| A | 0 | 24 | 0 |
| B | 0 | 24 | 0 |
| C | 0 | 24 | 0 |
| D | 0 | 25 | 0 |
| Mode M0 | |||
|---|---|---|---|
| Quadrant | BADHDUFLAG | Total packets | Discarded packets |
| A | 0 | 10960 | 3 |
| B | 0 | 15795 | 2 |
| C | 0 | 12229 | 2 |
| D | 0 | 15514 | 2 |
| Quadrant | Total seconds | Saturated seconds | Saturation percentage |
|---|---|---|---|
| A | 5140 | 9 | 0.175097% |
| B | 5140 | 721 | 14.027237% |
| C | 5140 | 100 | 1.945525% |
| D | 5140 | 324 | 6.303502% |
Noise dominated data is calculated using 1-second bins in cleaned event files. If a bin has >2000 counts, and if more than 50% of those come from <1% of pixels, then it is considered to be noise-dominated and hence unusable.
| Quadrant | # 1 sec bins | Bins with >0 counts | Bins with >2000 counts | High rate bins dominated by noise | Noise dominated (total time) | Noise dominated (detector-on time) | Marked lightcurve |
|---|---|---|---|---|---|---|---|
| A | 7113 | 5141 | 1 | 1 | 0.01% | 0.02% | 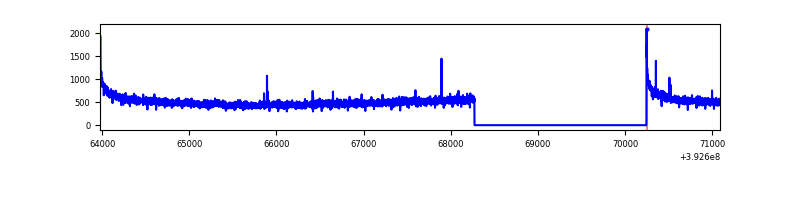 |
| B | 7113 | 5140 | 488 | 488 | 6.86% | 9.49% | 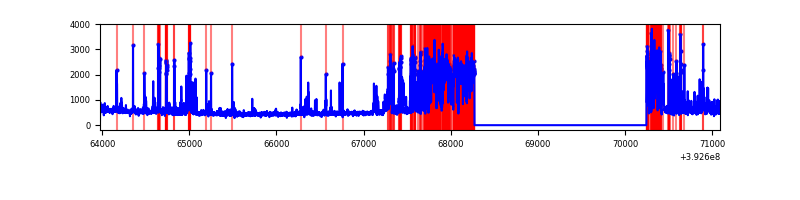 |
| C | 7113 | 5141 | 83 | 83 | 1.17% | 1.61% | 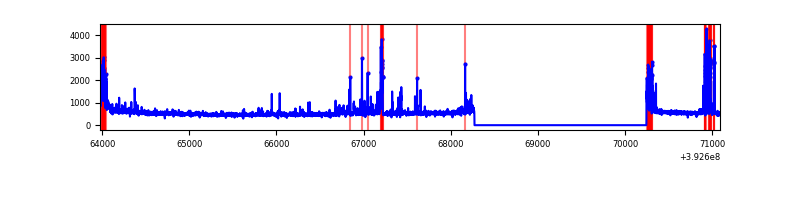 |
| D | 7113 | 5141 | 328 | 328 | 4.61% | 6.38% | 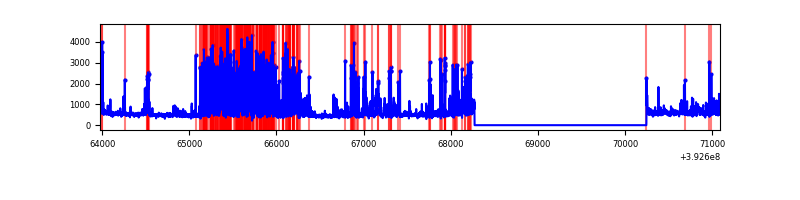 |
Top three noisy pixels from each quadrant. If the there are fewer than three noisy pixels in the level2.evt file, extra rows are filled as -1
| Pixel properties | Quadrant properties | ||||||
|---|---|---|---|---|---|---|---|
| Quadrant | DetID | PixID | Counts | Sigma | Mean | Median | Sigma |
| A | 10 | 83 | 179651 | 1425.44 | 630 | 621 | 125.6 |
| A | 9 | 143 | 8696 | 64.29 | 630 | 621 | 125.6 |
| A | 13 | 254 | 7616 | 55.69 | 630 | 621 | 125.6 |
| B | 5 | 236 | 1470167 | 13266.28 | 588 | 575 | 110.8 |
| B | 5 | 172 | 227976 | 2052.79 | 588 | 575 | 110.8 |
| B | 8 | 128 | 108336 | 972.78 | 588 | 575 | 110.8 |
| C | 0 | 207 | 269960 | 1894.65 | 611 | 616 | 142.2 |
| C | 0 | 10 | 220679 | 1547.99 | 611 | 616 | 142.2 |
| C | 15 | 214 | 214981 | 1507.91 | 611 | 616 | 142.2 |
| D | 12 | 6 | 1335831 | 9224.78 | 597 | 581 | 144.7 |
| D | 12 | 235 | 90628 | 622.1 | 597 | 581 | 144.7 |
| D | 2 | 153 | 90231 | 619.36 | 597 | 581 | 144.7 |
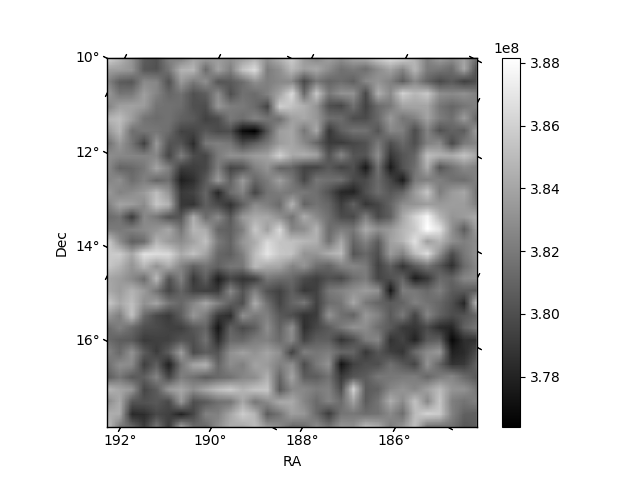
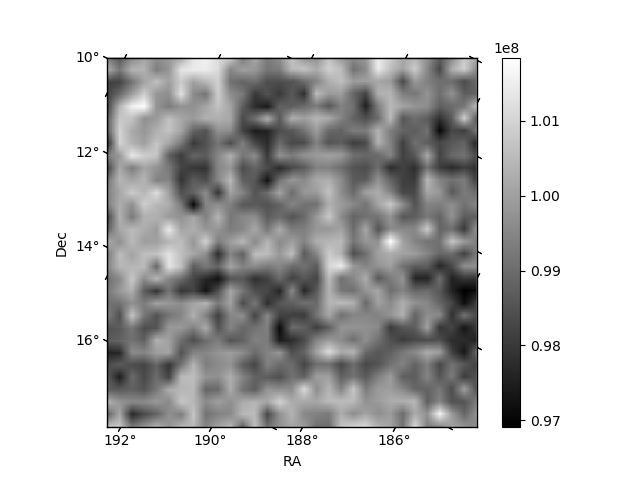
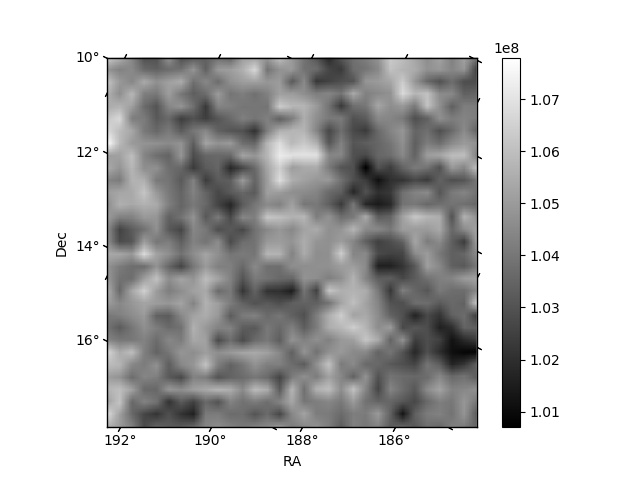
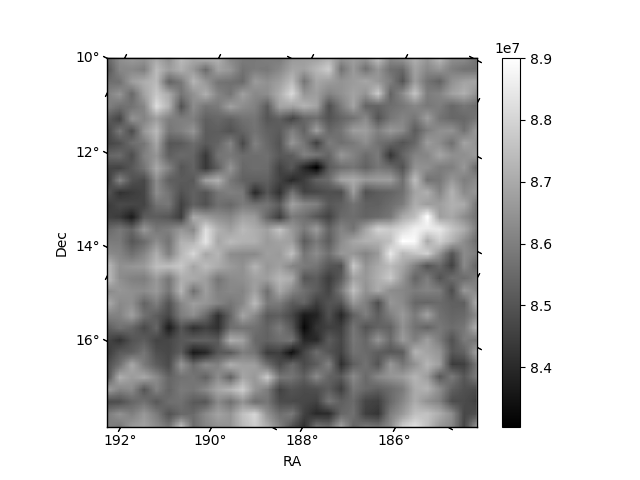
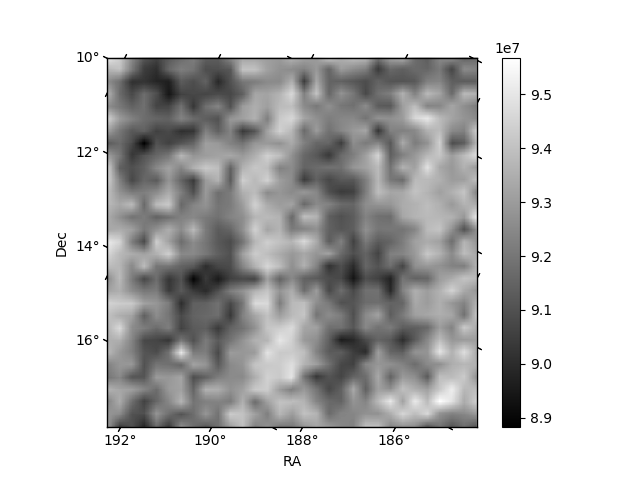
Histogram calculated using DETX and DETY for each event in the final _common_clean file
| Quadrant A | 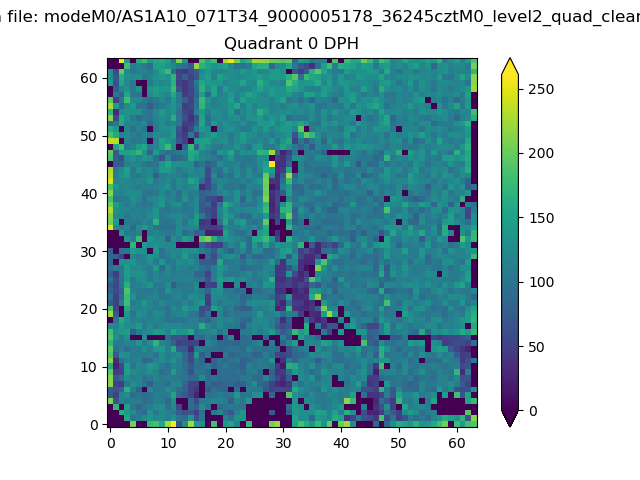 |
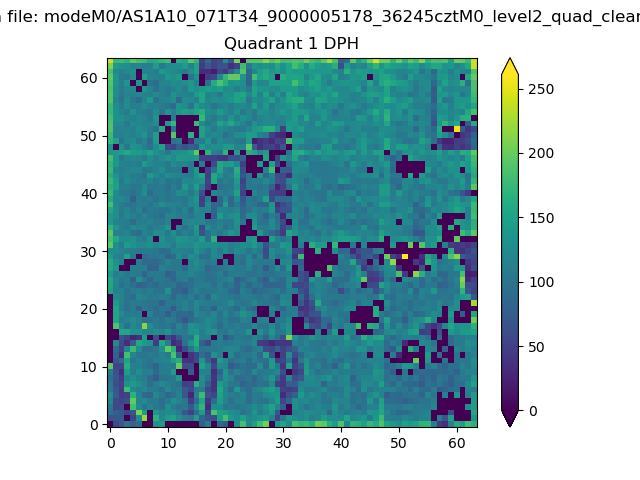 |
Quadrant B |
|---|---|---|---|
| Quadrant D | 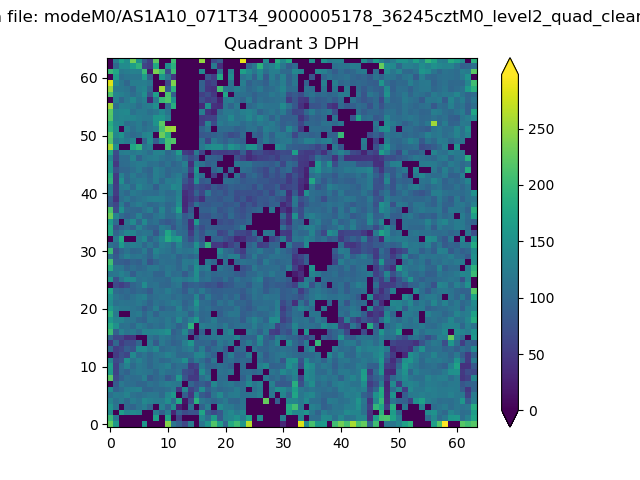 |
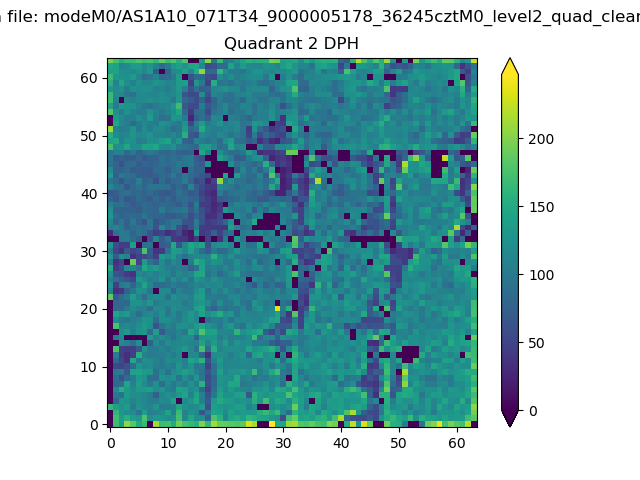 |
Quadrant C |
| Plot type | Count rate plots | Images |
|---|---|---|
| Comparison with Poisson distribution Blue bars denote a histogram of data divided into 1 sec bins. Red curve is a Poisson curve with rate = median count rate of data. |
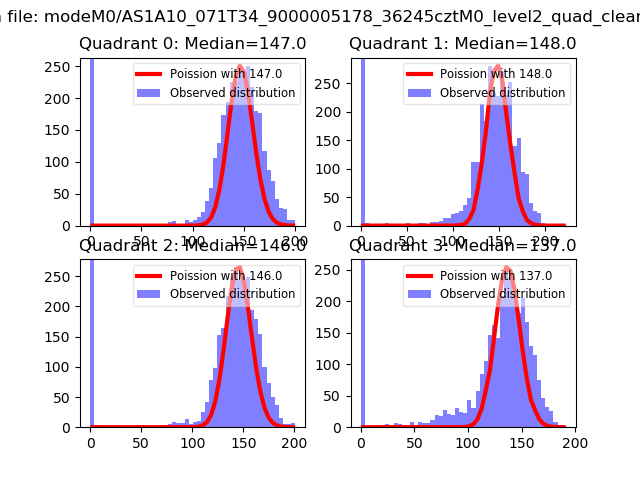 |
 |
| Quadrant-wise count rates Data is divided into 100 sec bins |
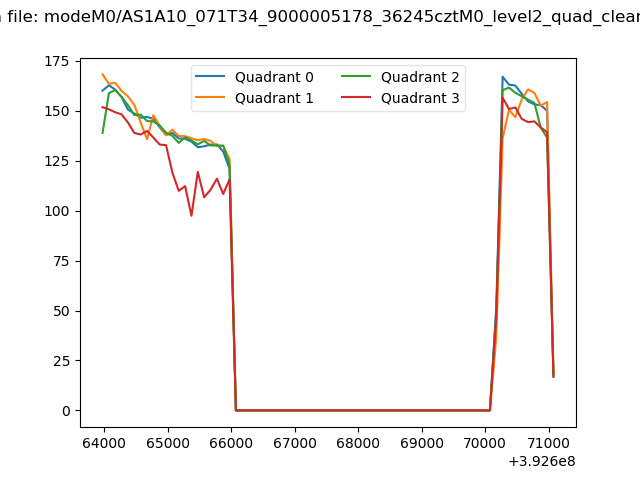 |
|
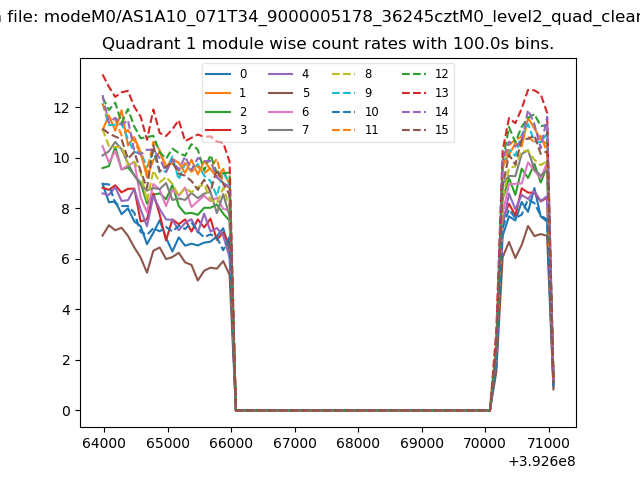
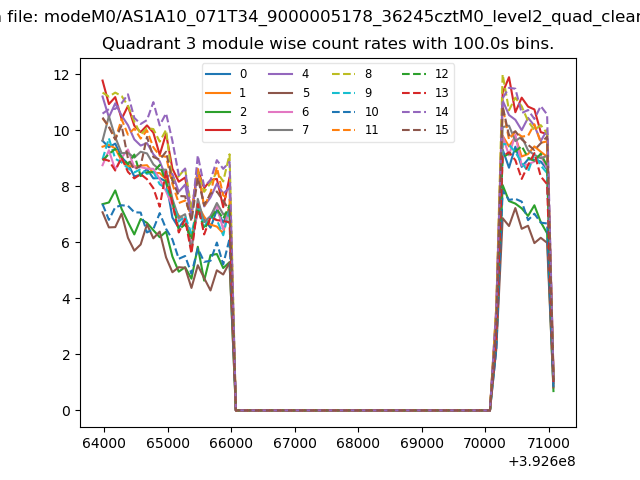
| Module-wise count rates for Quadrant A Data is divided into 100 sec bins |
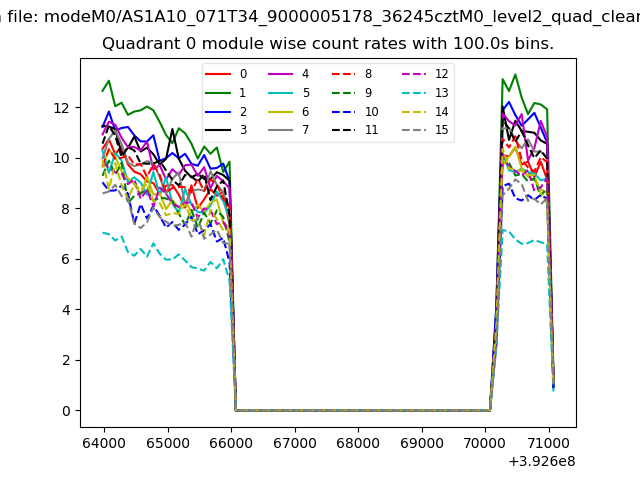 |
 |
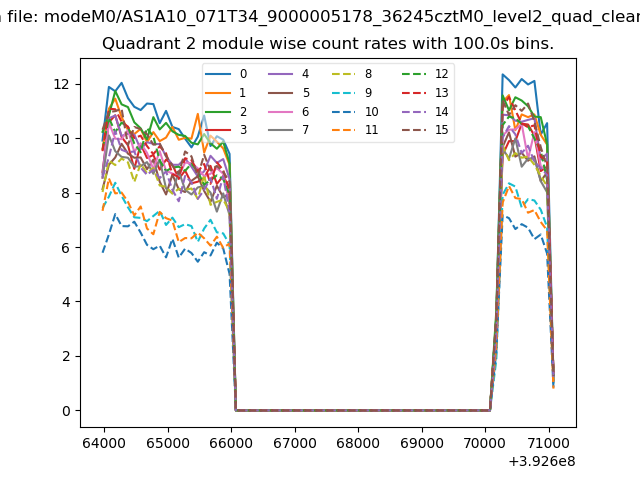
| Module-wise count rates for Quadrant B Data is divided into 100 sec bins |
 |
 |
| Module-wise count rates for Quadrant C Data is divided into 100 sec bins |
 |
 |
| Module-wise count rates for Quadrant D Data is divided into 100 sec bins |
 |
 |
| Parameter | Plot |
|---|---|
| CZT HV Monitor | 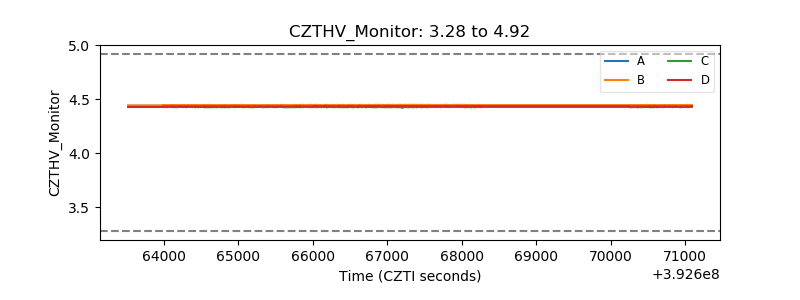 |
| D_VDD | 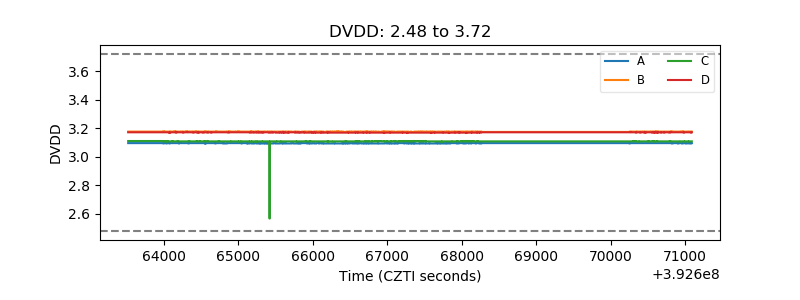 |
| Temperature 1 | 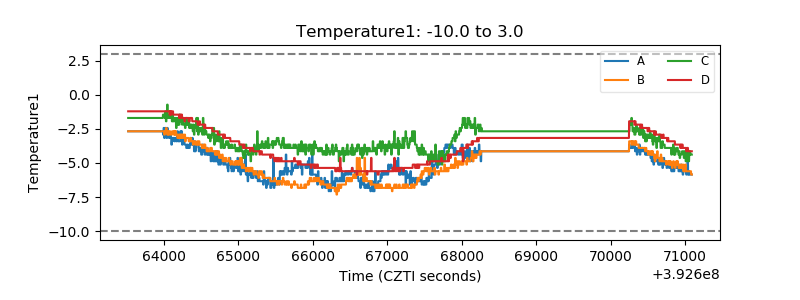 |
| Veto HV Monitor |  |
| Veto LLD | 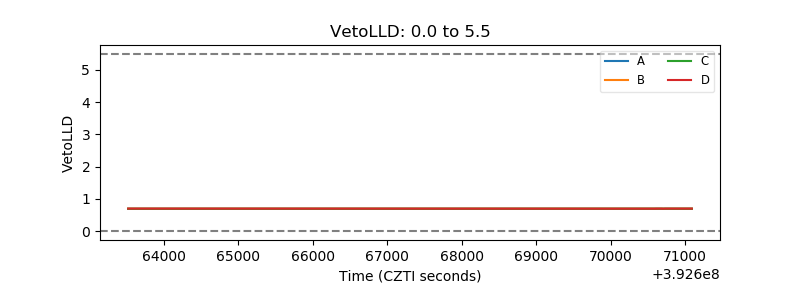 |
| Alpha Counter | 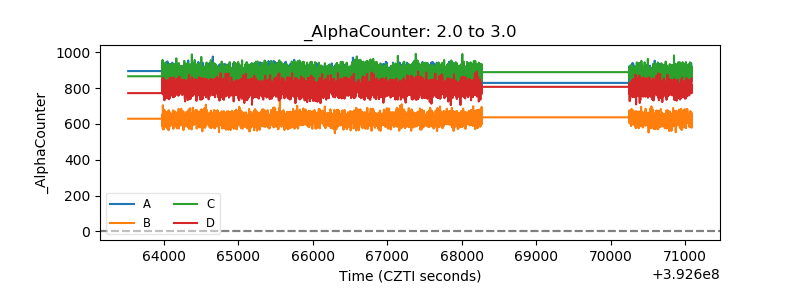 |
| _CPM_Rate | 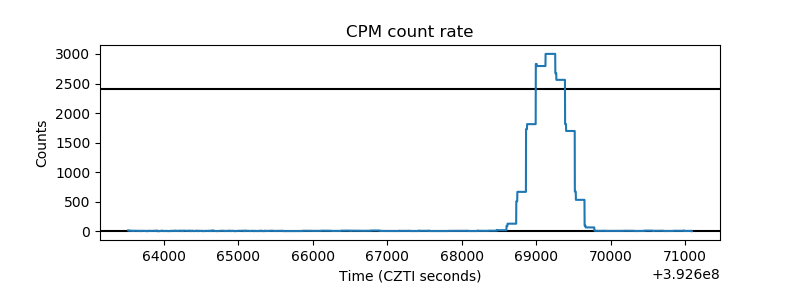 |
| CZT Counter | 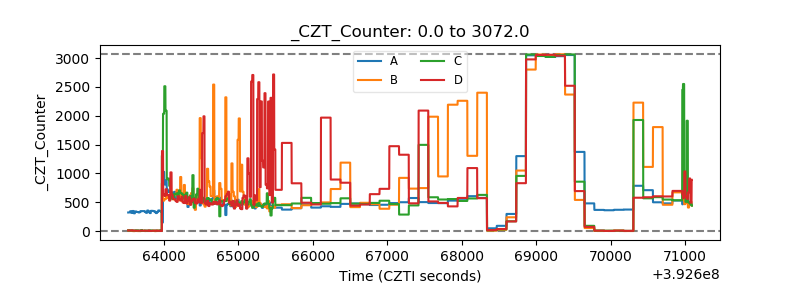 |
| +2.5 Volts monitor | 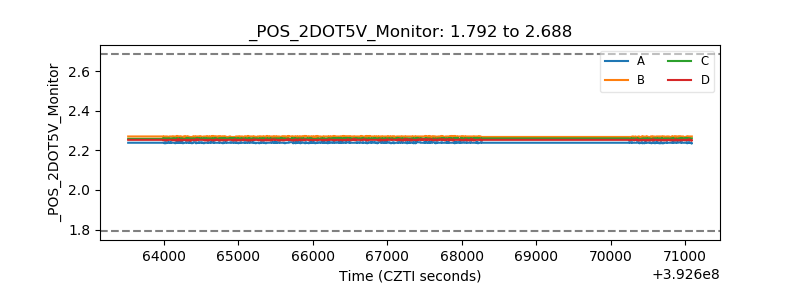 |
| +5 Volts monitor | 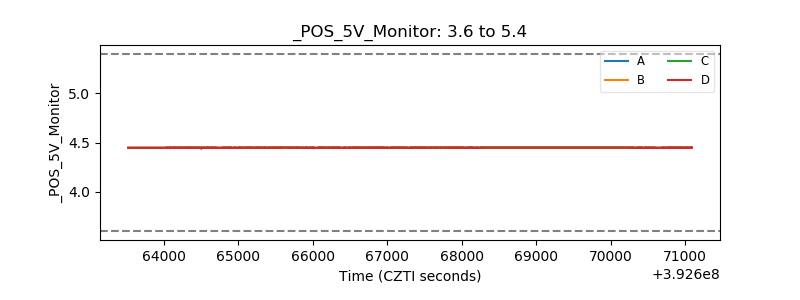 |
| _ROLL_ROT | 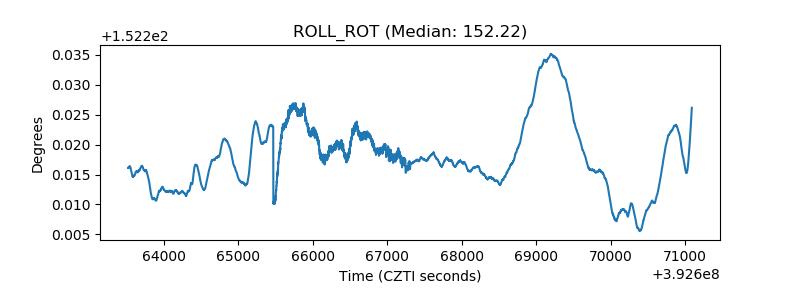 |
| _Roll_DEC | 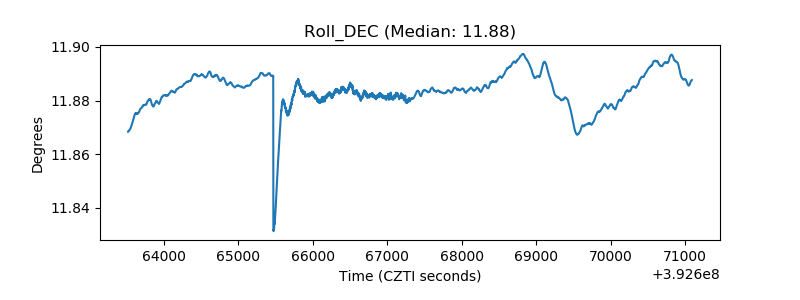 |
| _Roll_RA | 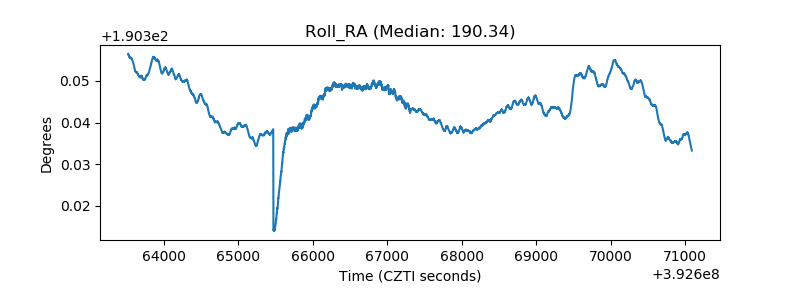 |
| Veto Counter | 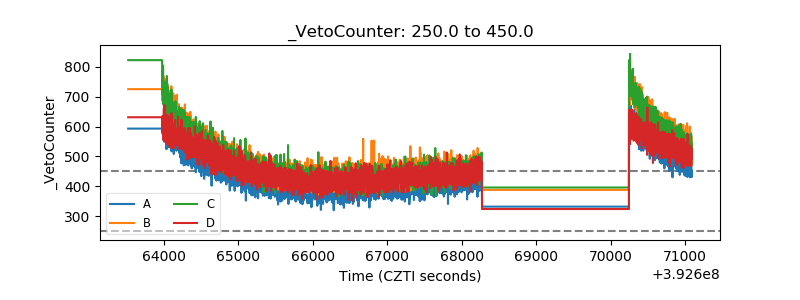 |