| Param | Original file | Final file |
|---|---|---|
| Filename | modeM0/AS1A10_071T34_9000005178cztM0_level2_bc.evt | modeM0/AS1A10_071T34_9000005178cztM0_level2_quad_clean.evt |
| Size (bytes) | 1,818,630,720 | 542,266,560 |
| Size | 1.7 GB | 517.1 MB |
| Events in quadrant A | 9,136,061 | 3,515,392 |
| Events in quadrant B | 11,965,149 | 3,515,146 |
| Events in quadrant C | 10,721,128 | 3,481,437 |
| Events in quadrant D | 20,521,393 | 3,157,176 |
| Mode SS | |||
|---|---|---|---|
| Quadrant | BADHDUFLAG | Total packets | Discarded packets |
| A | 0 | 822 | 0 |
| B | 0 | 822 | 0 |
| C | 0 | 822 | 0 |
| D | 0 | 822 | 0 |
| Mode M9 | |||
|---|---|---|---|
| Quadrant | BADHDUFLAG | Total packets | Discarded packets |
| A | 0 | 139 | 0 |
| B | 0 | 139 | 0 |
| C | 0 | 139 | 0 |
| D | 0 | 139 | 0 |
| Mode M0 | |||
|---|---|---|---|
| Quadrant | BADHDUFLAG | Total packets | Discarded packets |
| A | 0 | 83156 | 0 |
| B | 0 | 97465 | 0 |
| C | 0 | 86096 | 0 |
| D | 0 | 125878 | 0 |
| Quadrant | Total seconds | Saturated seconds | Saturation percentage |
|---|---|---|---|
| A | 40121 | 88 | 0.219337% |
| B | 40121 | 1445 | 3.601605% |
| C | 40121 | 259 | 0.645547% |
| D | 40121 | 3304 | 8.235089% |
Noise dominated data is calculated using 1-second bins in cleaned event files. If a bin has >2000 counts, and if more than 50% of those come from <1% of pixels, then it is considered to be noise-dominated and hence unusable.
| Quadrant | # 1 sec bins | Bins with >0 counts | Bins with >2000 counts | High rate bins dominated by noise | Noise dominated (total time) | Noise dominated (detector-on time) | Marked lightcurve |
|---|---|---|---|---|---|---|---|
| A | 54095 | 40130 | 9 | 9 | 0.02% | 0.02% | 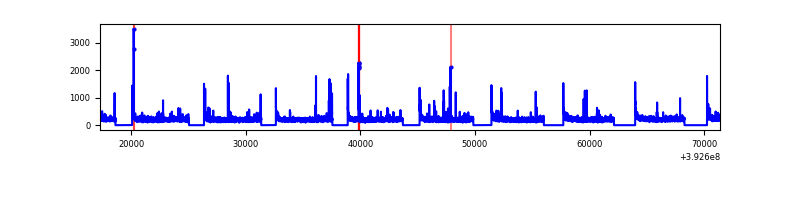 |
| B | 54095 | 40116 | 64 | 64 | 0.12% | 0.16% | 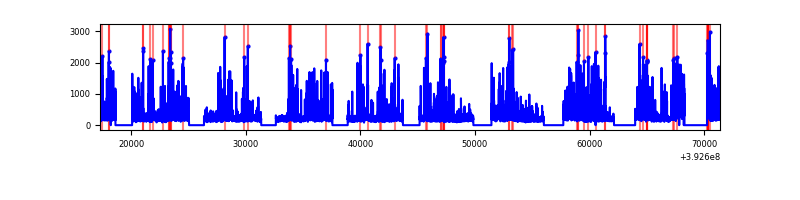 |
| C | 54095 | 40122 | 25 | 25 | 0.05% | 0.06% | 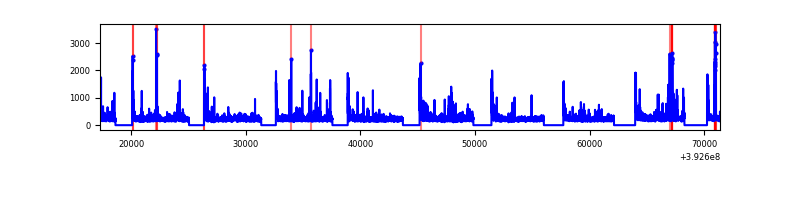 |
| D | 54095 | 40118 | 1123 | 1123 | 2.08% | 2.80% | 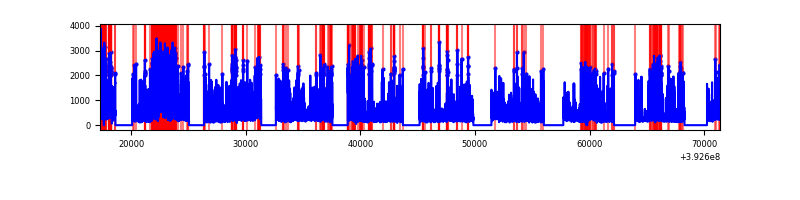 |
Top three noisy pixels from each quadrant. If the there are fewer than three noisy pixels in the level2.evt file, extra rows are filled as -1
| Pixel properties | Quadrant properties | ||||||
|---|---|---|---|---|---|---|---|
| Quadrant | DetID | PixID | Counts | Sigma | Mean | Median | Sigma |
| A | 10 | 83 | 1037367 | 2279.63 | 2033 | 1998 | 454.2 |
| A | 9 | 143 | 142384 | 309.1 | 2033 | 1998 | 454.2 |
| A | 13 | 254 | 66542 | 142.11 | 2033 | 1998 | 454.2 |
| B | 5 | 172 | 1865678 | 4629.8 | 2019 | 1974 | 402.5 |
| B | 5 | 236 | 1341571 | 3327.82 | 2019 | 1974 | 402.5 |
| B | 0 | 190 | 203530 | 500.7 | 2019 | 1974 | 402.5 |
| C | 15 | 214 | 1567472 | 3400.87 | 1996 | 1974 | 460.3 |
| C | 0 | 10 | 866048 | 1877.11 | 1996 | 1974 | 460.3 |
| C | 0 | 207 | 351334 | 758.95 | 1996 | 1974 | 460.3 |
| D | 12 | 227 | 3912169 | 8446.16 | 1938 | 1877 | 463.0 |
| D | 12 | 6 | 3852457 | 8317.18 | 1938 | 1877 | 463.0 |
| D | 12 | 235 | 1688821 | 3643.77 | 1938 | 1877 | 463.0 |
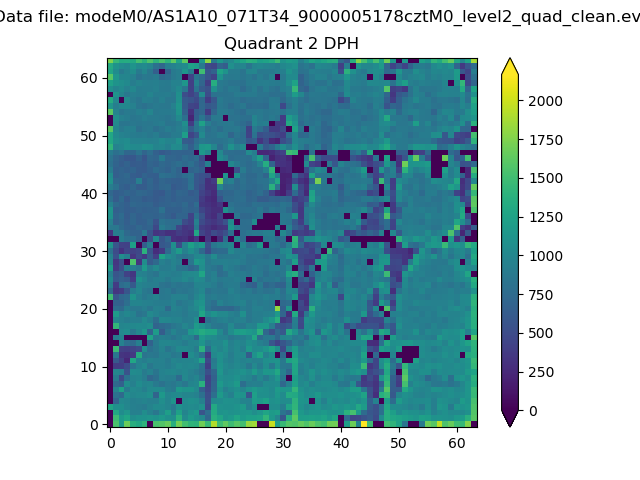
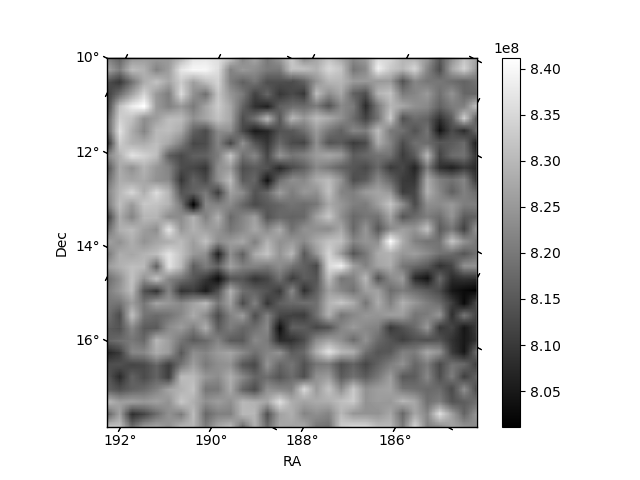
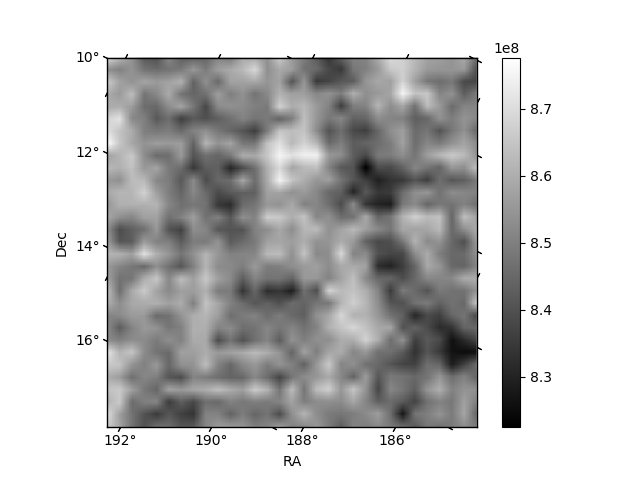
Histogram calculated using DETX and DETY for each event in the final _common_clean file
| Quadrant A | 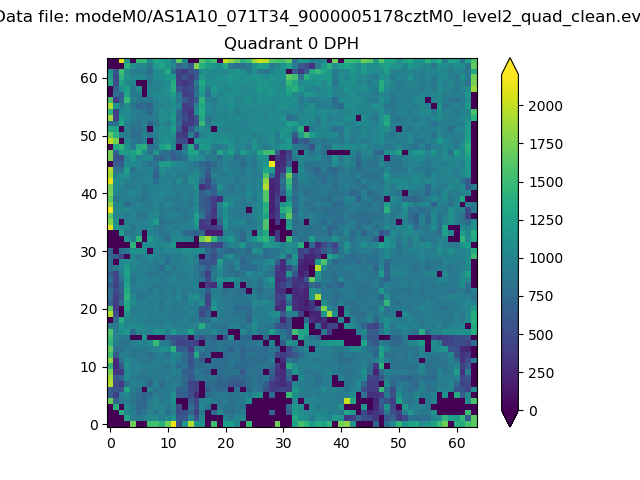 |
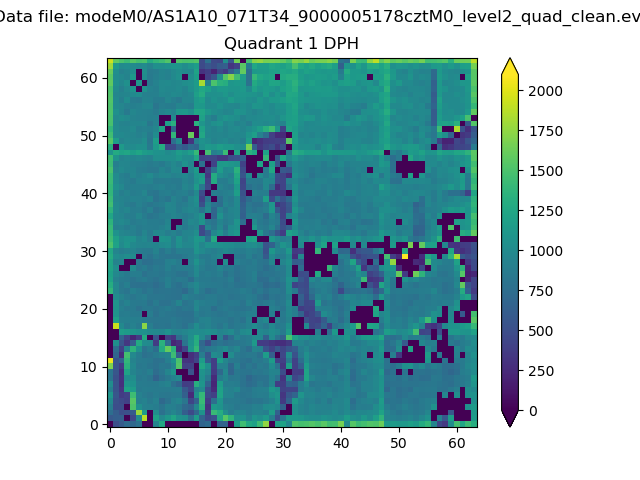 |
Quadrant B |
|---|---|---|---|
| Quadrant D | 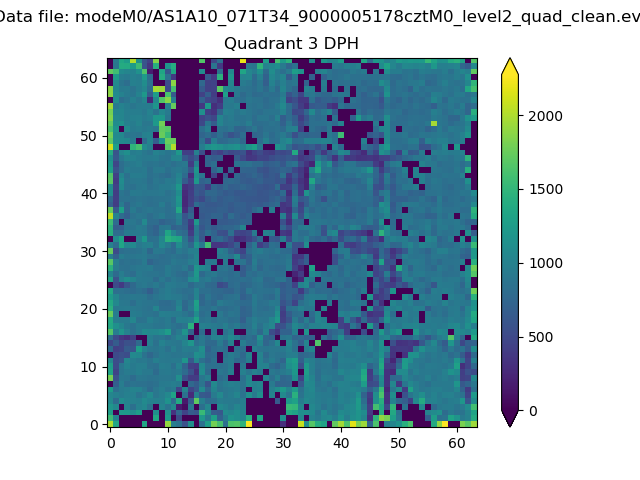 |
 |
Quadrant C |
| Plot type | Count rate plots | Images |
|---|---|---|
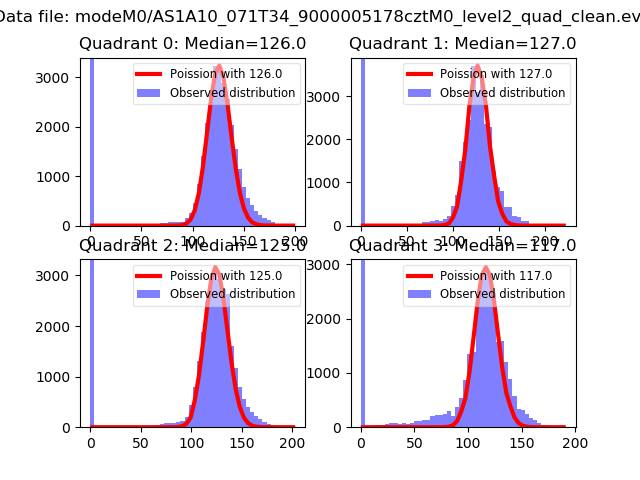
| Comparison with Poisson distribution Blue bars denote a histogram of data divided into 1 sec bins. Red curve is a Poisson curve with rate = median count rate of data. |
 |
 |
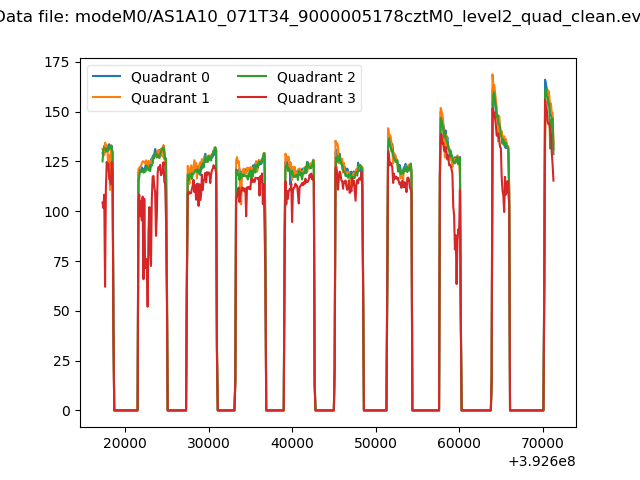
| Quadrant-wise count rates Data is divided into 100 sec bins |
 |
|
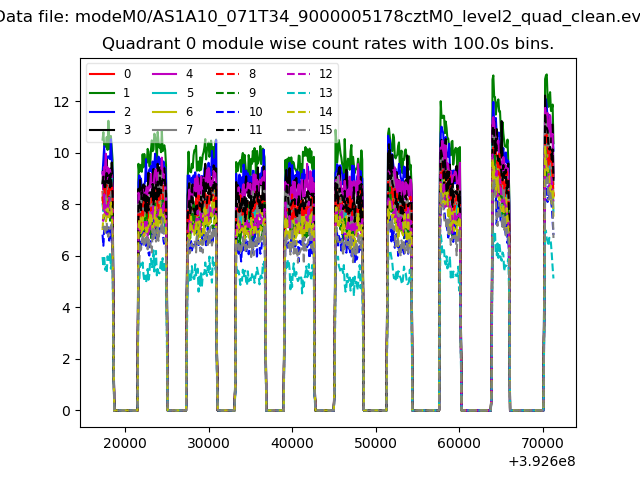
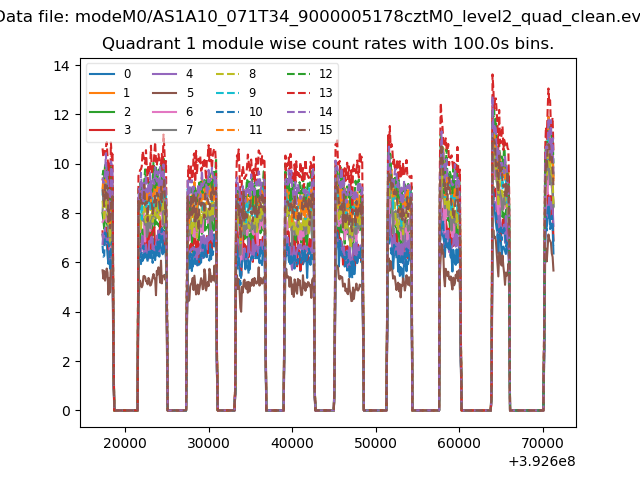
| Module-wise count rates for Quadrant A Data is divided into 100 sec bins |
 |
 |
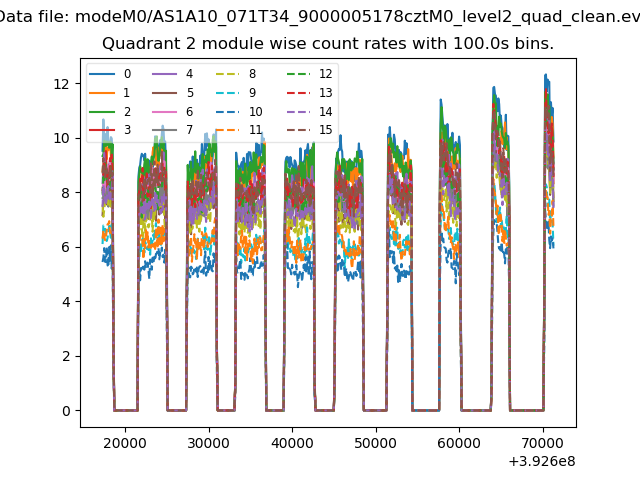
| Module-wise count rates for Quadrant B Data is divided into 100 sec bins |
 |
 |
| Module-wise count rates for Quadrant C Data is divided into 100 sec bins |
 |
 |
| Module-wise count rates for Quadrant D Data is divided into 100 sec bins |
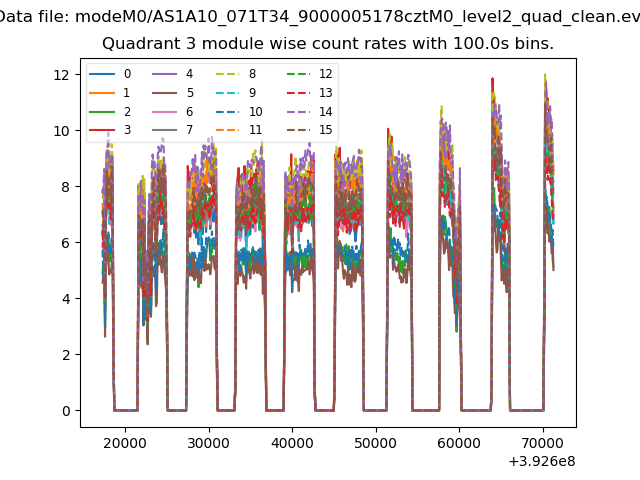 |
 |
| Parameter | Plot |
|---|---|
| CZT HV Monitor | 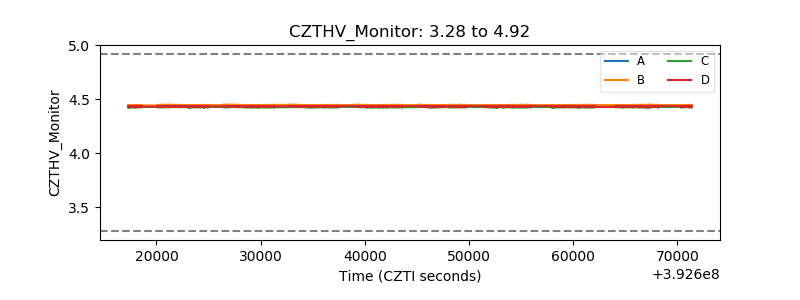 |
| D_VDD | 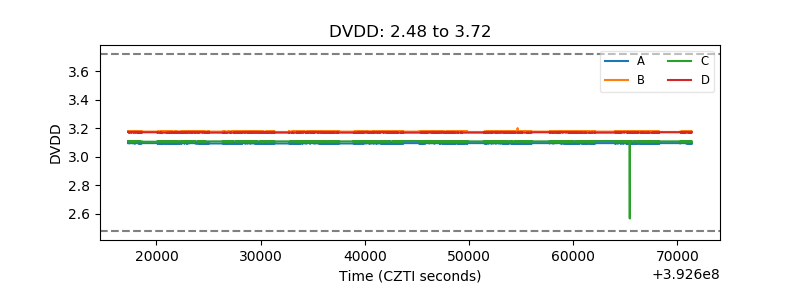 |
| Temperature 1 | 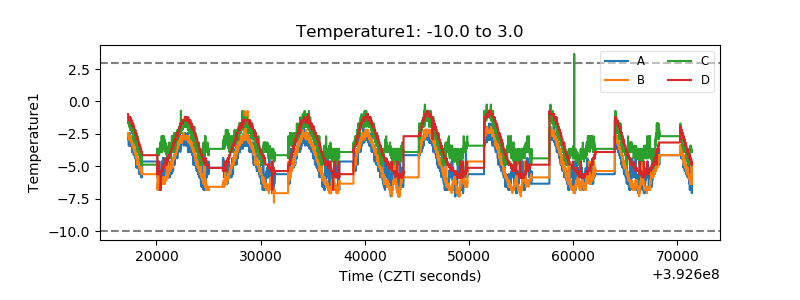 |
| Veto HV Monitor | 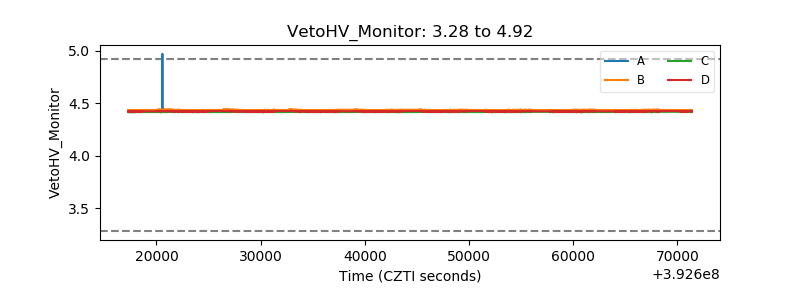 |
| Veto LLD | 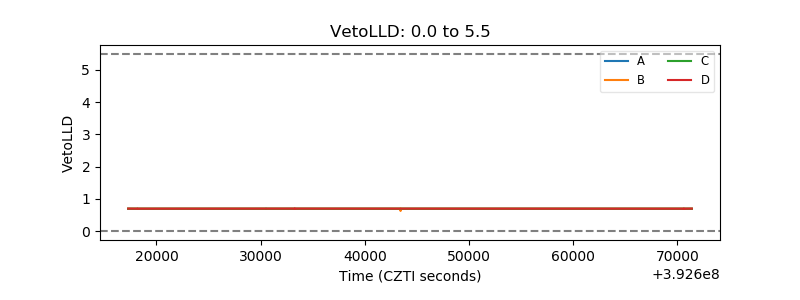 |
| Alpha Counter | 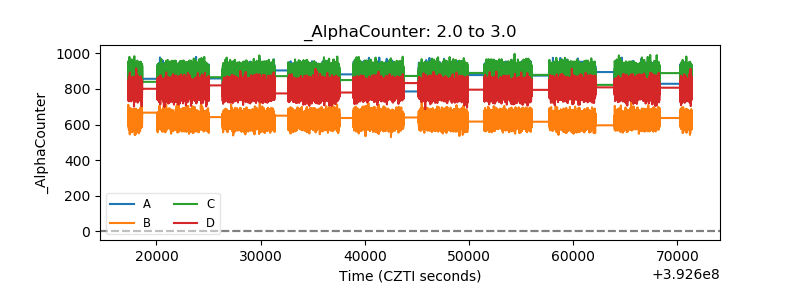 |
| _CPM_Rate | 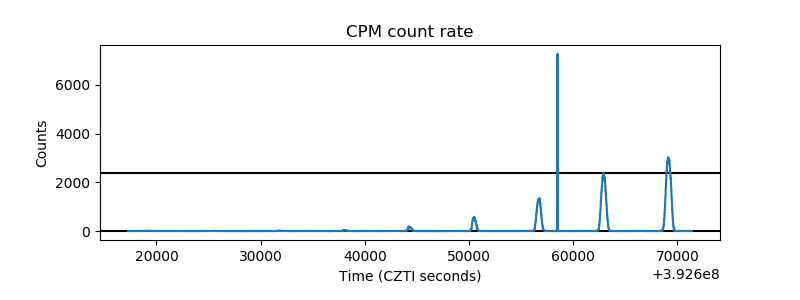 |
| CZT Counter | 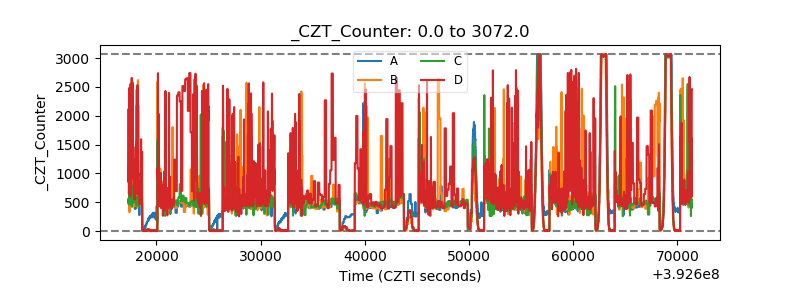 |
| +2.5 Volts monitor | 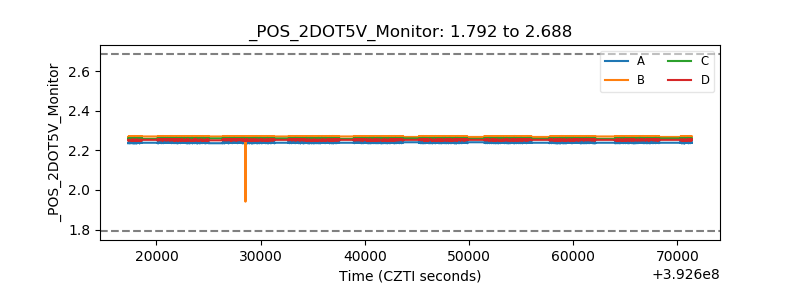 |
| +5 Volts monitor | 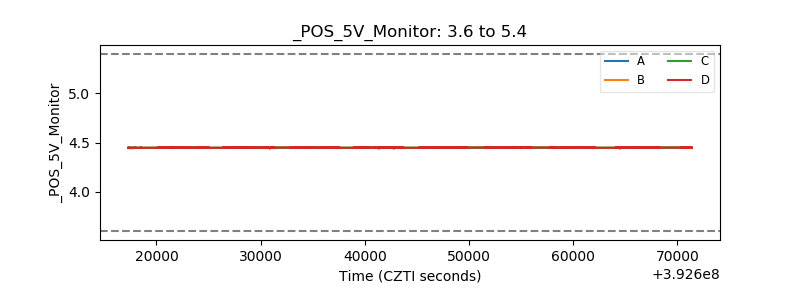 |
| _ROLL_ROT | 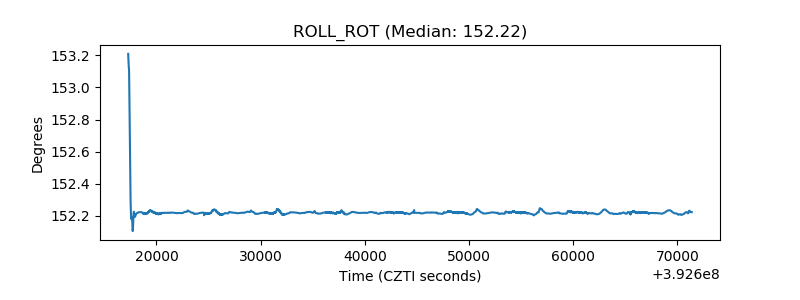 |
| _Roll_DEC | 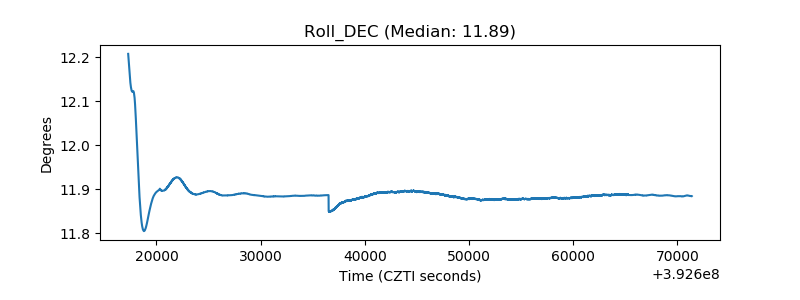 |
| _Roll_RA | 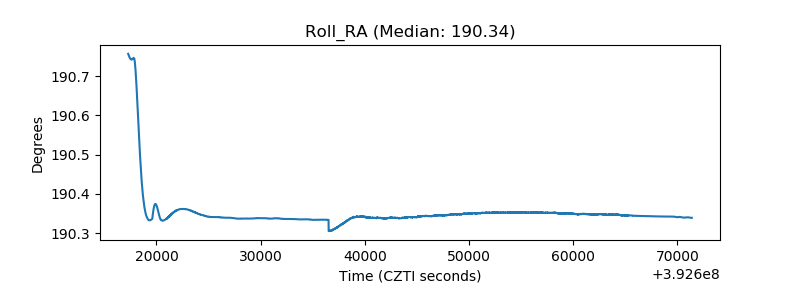 |
| Veto Counter | 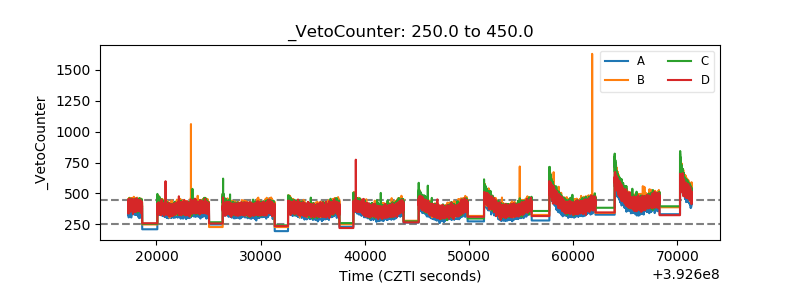 |