| Param | Original file | Final file |
|---|---|---|
| Filename | modeM0/AS1A11_080T02_9000005176_36231cztM0_level2.evt | modeM0/AS1A11_080T02_9000005176_36231cztM0_level2_quad_clean.evt |
| Size (bytes) | 567,011,520 | 64,733,760 |
| Size | 540.7 MB | 61.7 MB |
| Events in quadrant A | 2,710,551 | 429,063 |
| Events in quadrant B | 3,539,367 | 436,551 |
| Events in quadrant C | 2,889,802 | 418,519 |
| Events in quadrant D | 7,691,395 | 322,472 |
| Mode M9 | |||
|---|---|---|---|
| Quadrant | BADHDUFLAG | Total packets | Discarded packets |
| A | 0 | 28 | 0 |
| B | 0 | 28 | 0 |
| C | 0 | 28 | 0 |
| D | 0 | 29 | 0 |
| Mode M0 | |||
|---|---|---|---|
| Quadrant | BADHDUFLAG | Total packets | Discarded packets |
| A | 0 | 11108 | 3 |
| B | 0 | 13733 | 2 |
| C | 0 | 11441 | 2 |
| D | 0 | 26319 | 2 |
| Mode SS | |||
|---|---|---|---|
| Quadrant | BADHDUFLAG | Total packets | Discarded packets |
| A | 0 | 104 | 0 |
| B | 0 | 104 | 0 |
| C | 0 | 104 | 0 |
| D | 0 | 104 | 0 |
| Quadrant | Total seconds | Saturated seconds | Saturation percentage |
|---|---|---|---|
| A | 5029 | 27 | 0.536886% |
| B | 5029 | 214 | 4.255319% |
| C | 5029 | 139 | 2.763969% |
| D | 5029 | 1708 | 33.963015% |
Noise dominated data is calculated using 1-second bins in cleaned event files. If a bin has >2000 counts, and if more than 50% of those come from <1% of pixels, then it is considered to be noise-dominated and hence unusable.
| Quadrant | # 1 sec bins | Bins with >0 counts | Bins with >2000 counts | High rate bins dominated by noise | Noise dominated (total time) | Noise dominated (detector-on time) | Marked lightcurve |
|---|---|---|---|---|---|---|---|
| A | 7062 | 5030 | 17 | 17 | 0.24% | 0.34% | 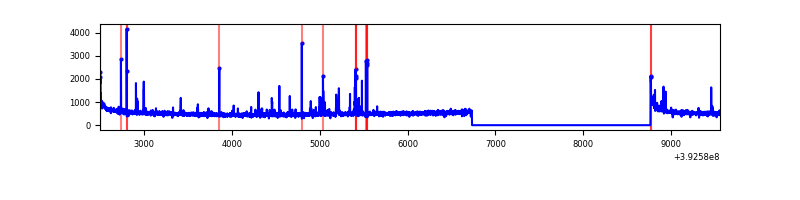 |
| B | 7061 | 5029 | 144 | 144 | 2.04% | 2.86% | 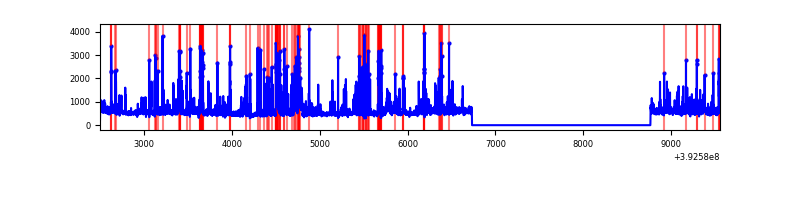 |
| C | 7062 | 5030 | 102 | 102 | 1.44% | 2.03% | 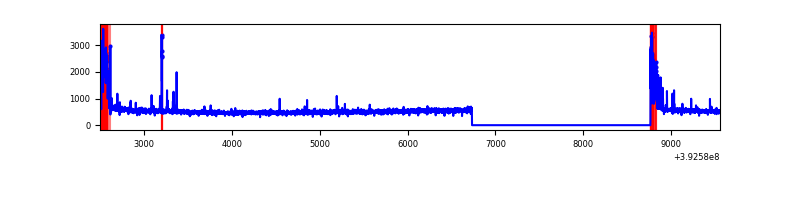 |
| D | 7061 | 5028 | 1648 | 1648 | 23.34% | 32.78% |  |
Top three noisy pixels from each quadrant. If the there are fewer than three noisy pixels in the level2.evt file, extra rows are filled as -1
| Pixel properties | Quadrant properties | ||||||
|---|---|---|---|---|---|---|---|
| Quadrant | DetID | PixID | Counts | Sigma | Mean | Median | Sigma |
| A | 10 | 83 | 178854 | 1454.54 | 609 | 598 | 122.6 |
| A | 7 | 16 | 100579 | 815.83 | 609 | 598 | 122.6 |
| A | 9 | 143 | 40301 | 323.97 | 609 | 598 | 122.6 |
| B | 5 | 172 | 449341 | 3938.94 | 606 | 591 | 113.9 |
| B | 5 | 236 | 418740 | 3670.34 | 606 | 591 | 113.9 |
| B | 4 | 232 | 122795 | 1072.65 | 606 | 591 | 113.9 |
| C | 0 | 10 | 358740 | 2588.36 | 594 | 599 | 138.4 |
| C | 15 | 214 | 208935 | 1505.69 | 594 | 599 | 138.4 |
| C | 12 | 250 | 7294 | 48.39 | 594 | 599 | 138.4 |
| D | 12 | 227 | 3699277 | 29749.98 | 500 | 486 | 124.3 |
| D | 12 | 6 | 1077004 | 8658.61 | 500 | 486 | 124.3 |
| D | 2 | 250 | 453800 | 3646.08 | 500 | 486 | 124.3 |
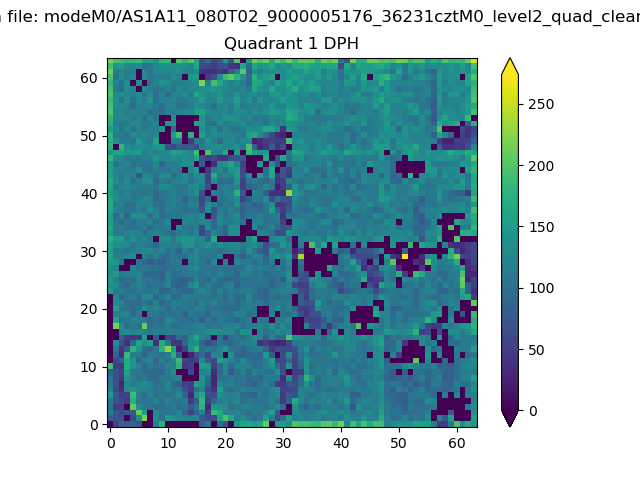
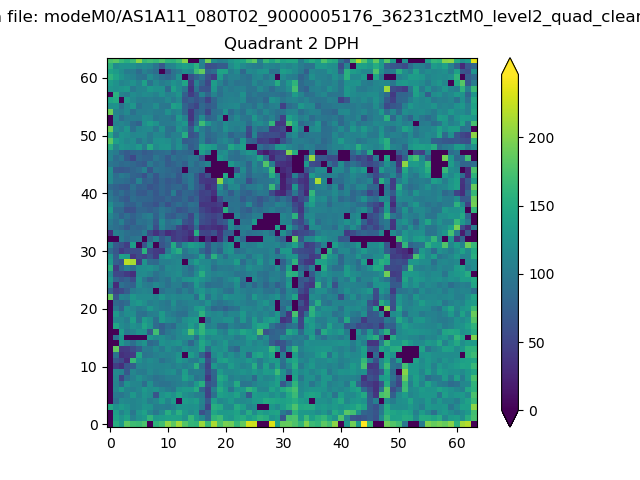
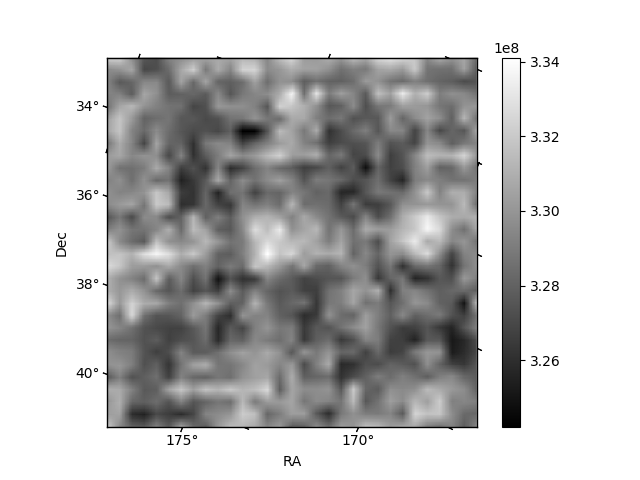
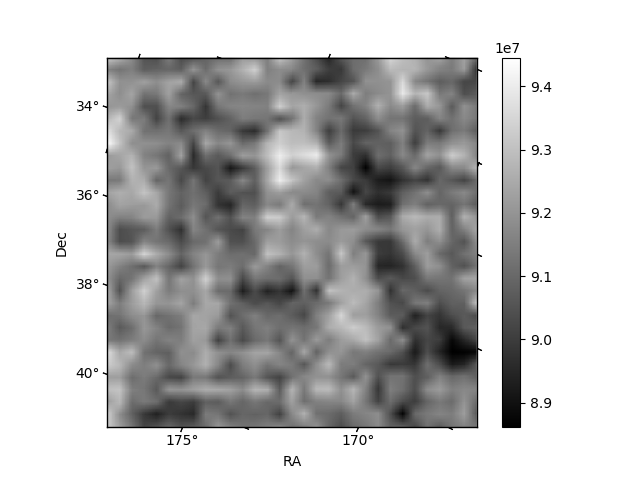
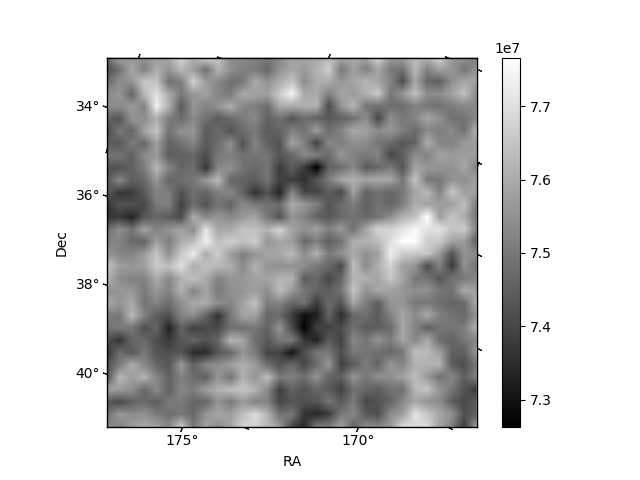
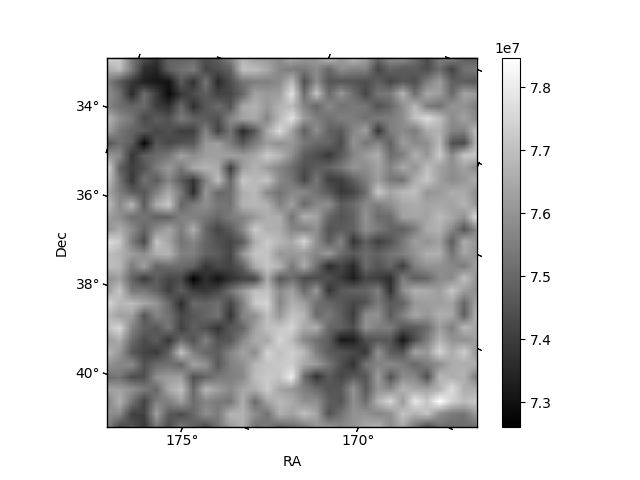
Histogram calculated using DETX and DETY for each event in the final _common_clean file
| Quadrant A | 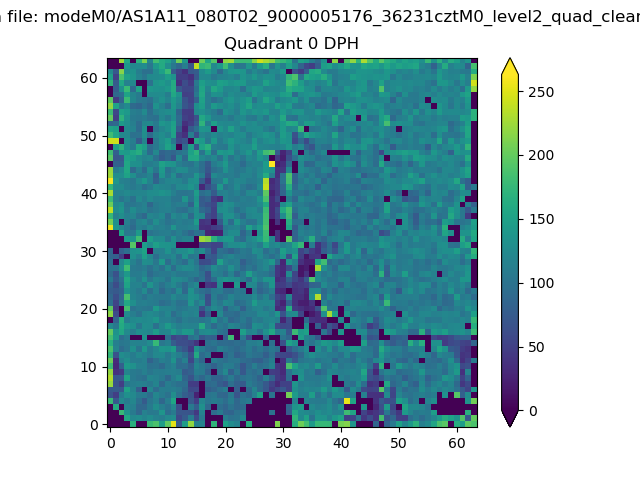 |
 |
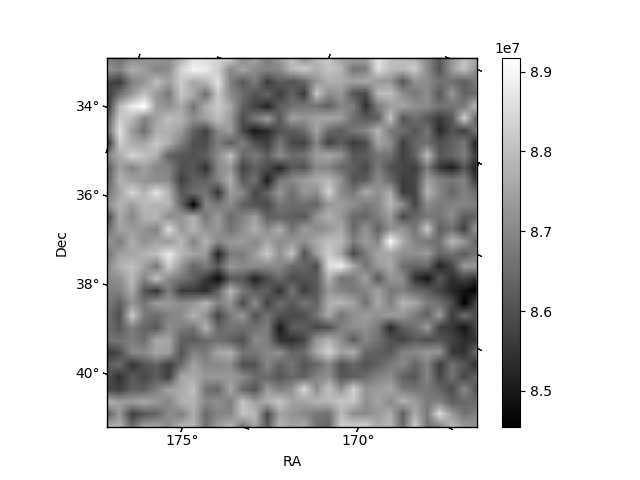
Quadrant B |
|---|---|---|---|
| Quadrant D | 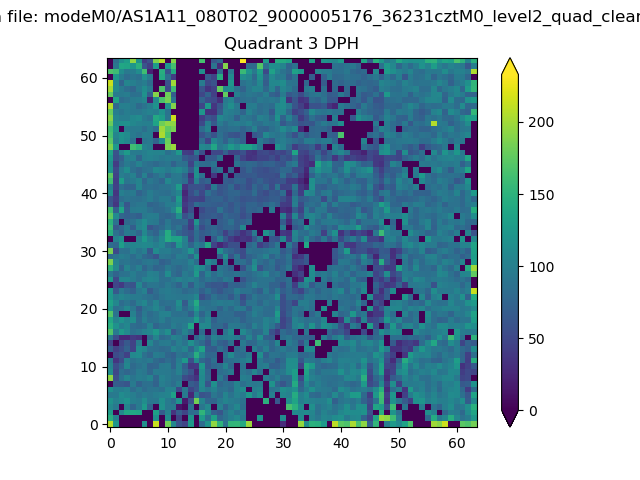 |
 |
Quadrant C |
| Plot type | Count rate plots | Images |
|---|---|---|
| Comparison with Poisson distribution Blue bars denote a histogram of data divided into 1 sec bins. Red curve is a Poisson curve with rate = median count rate of data. |
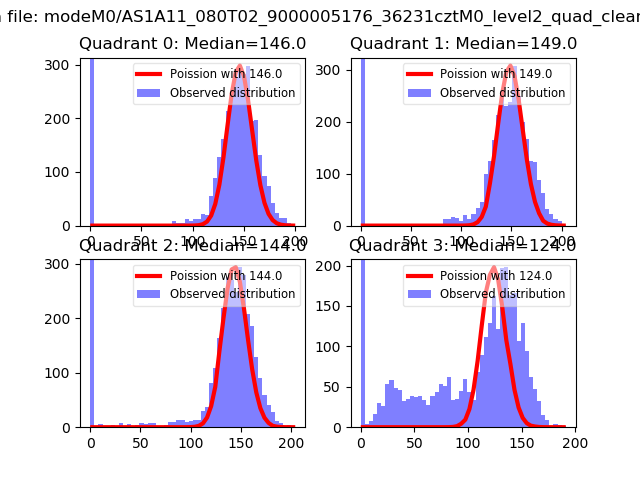 |
 |
| Quadrant-wise count rates Data is divided into 100 sec bins |
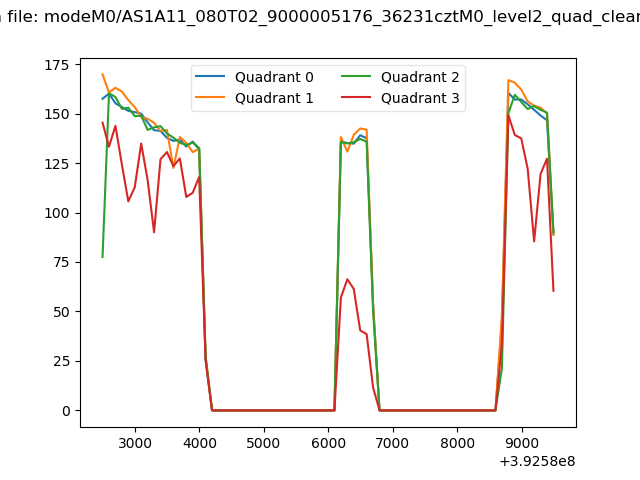 |
|
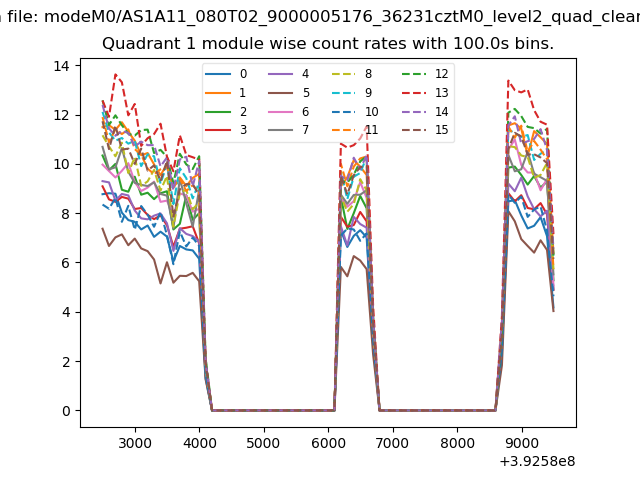
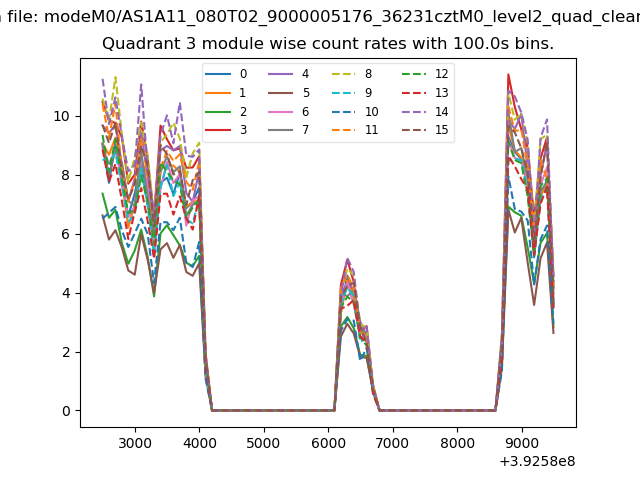
| Module-wise count rates for Quadrant A Data is divided into 100 sec bins |
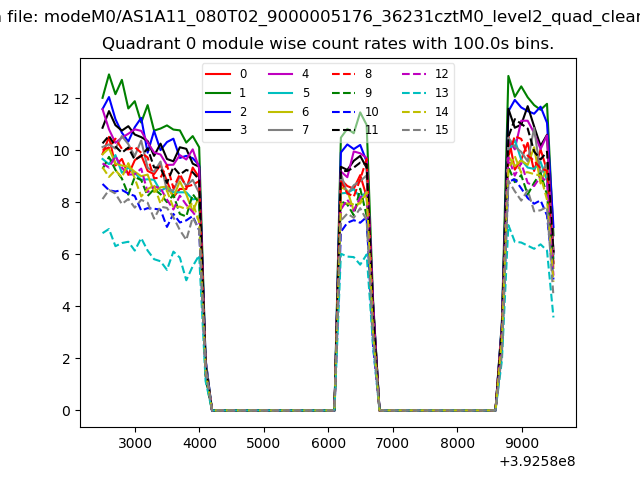 |
 |
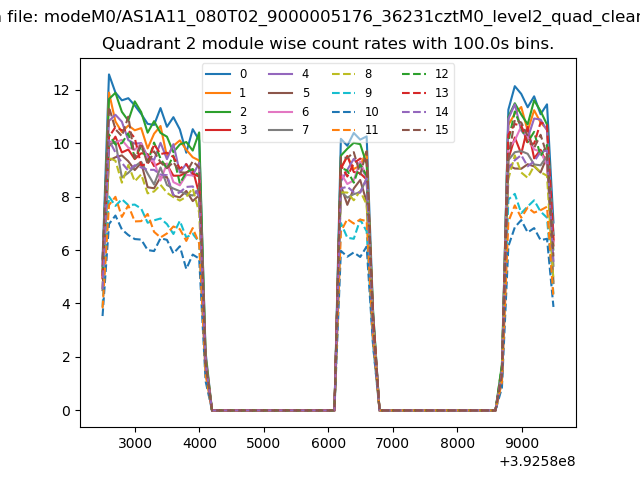
| Module-wise count rates for Quadrant B Data is divided into 100 sec bins |
 |
 |
| Module-wise count rates for Quadrant C Data is divided into 100 sec bins |
 |
 |
| Module-wise count rates for Quadrant D Data is divided into 100 sec bins |
 |
 |
| Parameter | Plot |
|---|---|
| CZT HV Monitor | 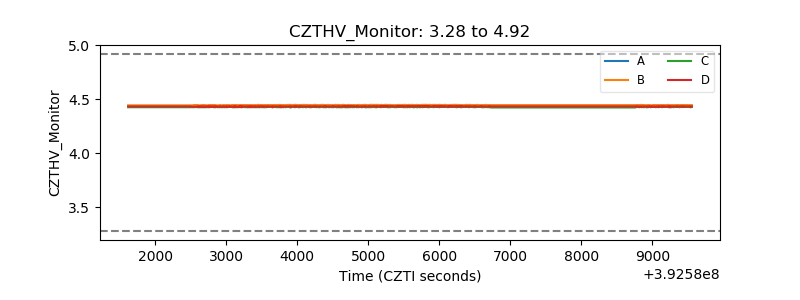 |
| D_VDD | 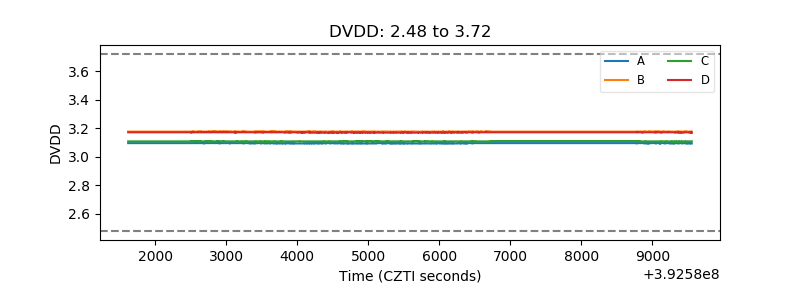 |
| Temperature 1 | 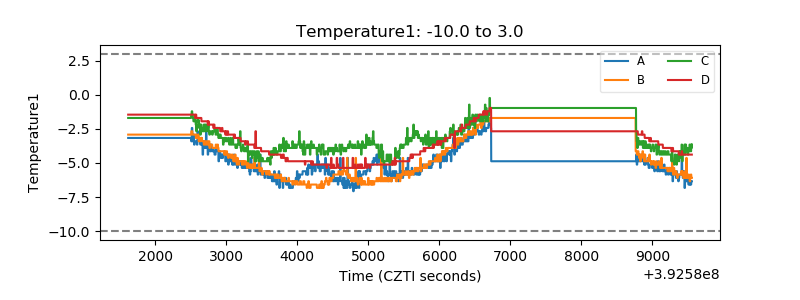 |
| Veto HV Monitor | 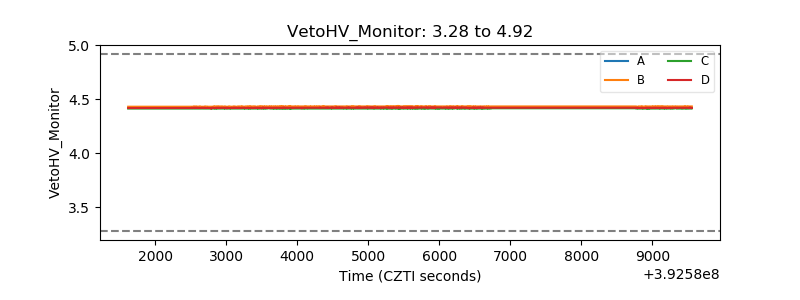 |
| Veto LLD | 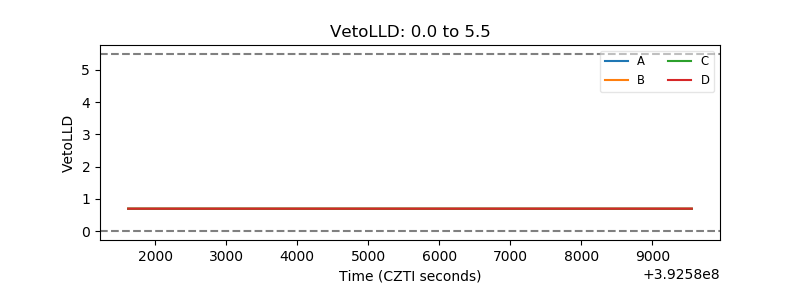 |
| Alpha Counter | 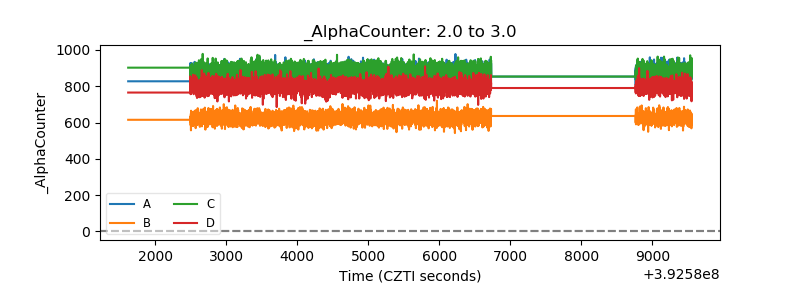 |
| _CPM_Rate | 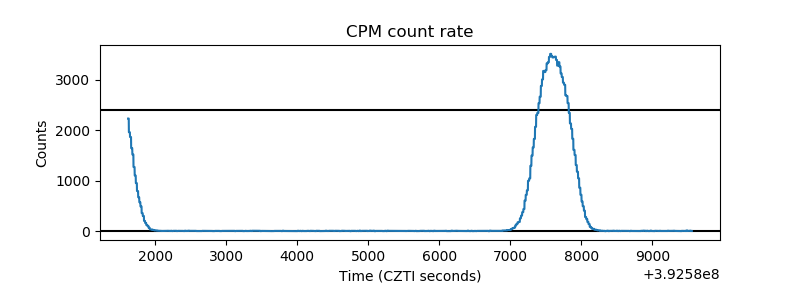 |
| CZT Counter | 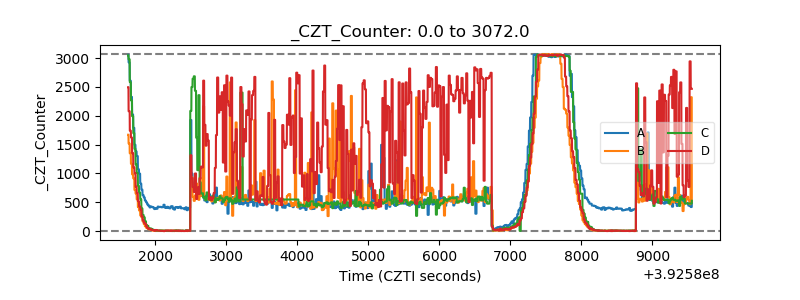 |
| +2.5 Volts monitor | 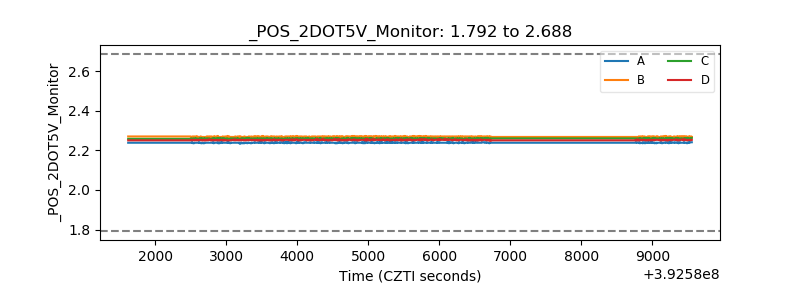 |
| +5 Volts monitor | 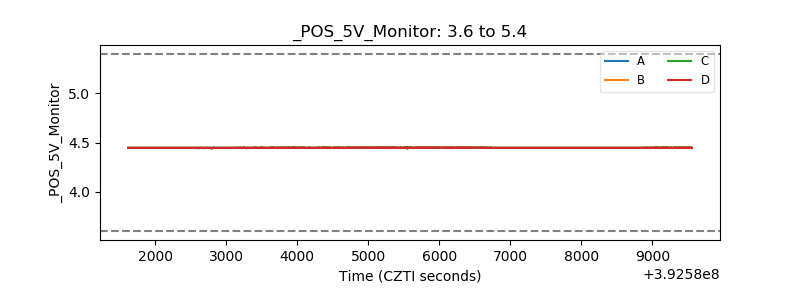 |
| _ROLL_ROT | 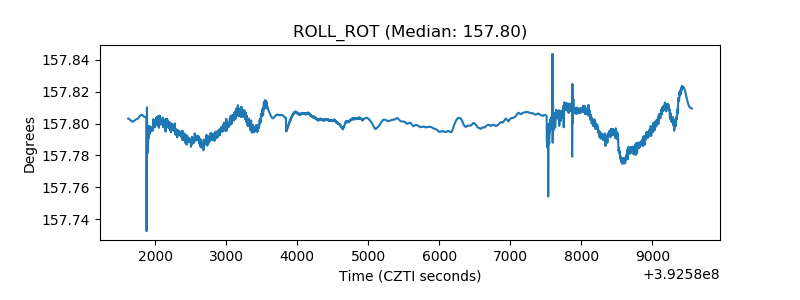 |
| _Roll_DEC | 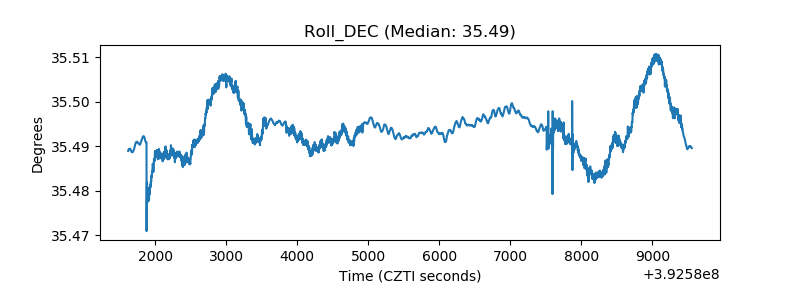 |
| _Roll_RA | 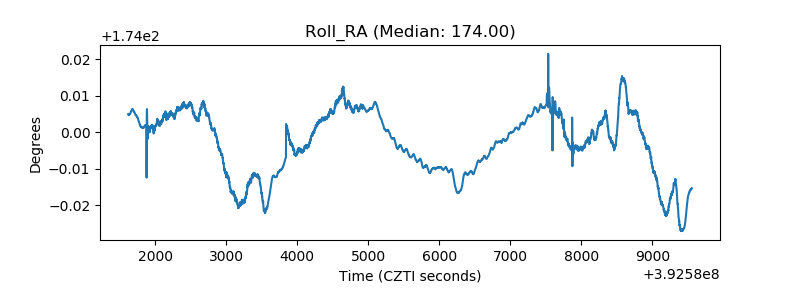 |
| Veto Counter | 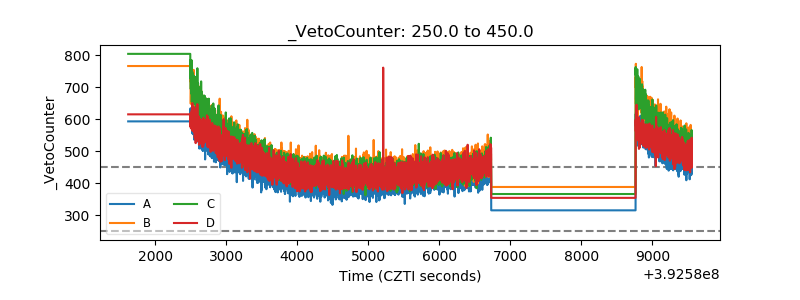 |