| Param | Original file | Final file |
|---|---|---|
| Filename | modeM0/AS1A11_080T02_9000005176_36230cztM0_level2.evt | modeM0/AS1A11_080T02_9000005176_36230cztM0_level2_quad_clean.evt |
| Size (bytes) | 596,088,000 | 65,102,400 |
| Size | 568.5 MB | 62.1 MB |
| Events in quadrant A | 2,763,727 | 437,919 |
| Events in quadrant B | 3,898,980 | 424,051 |
| Events in quadrant C | 2,965,650 | 422,944 |
| Events in quadrant D | 8,074,156 | 323,260 |
| Mode M9 | |||
|---|---|---|---|
| Quadrant | BADHDUFLAG | Total packets | Discarded packets |
| A | 0 | 19 | 0 |
| B | 0 | 19 | 0 |
| C | 0 | 19 | 0 |
| D | 0 | 20 | 0 |
| Mode M0 | |||
|---|---|---|---|
| Quadrant | BADHDUFLAG | Total packets | Discarded packets |
| A | 0 | 11524 | 3 |
| B | 0 | 14962 | 2 |
| C | 0 | 11870 | 2 |
| D | 0 | 27544 | 2 |
| Mode SS | |||
|---|---|---|---|
| Quadrant | BADHDUFLAG | Total packets | Discarded packets |
| A | 0 | 104 | 0 |
| B | 0 | 104 | 0 |
| C | 0 | 104 | 0 |
| D | 0 | 104 | 0 |
| Quadrant | Total seconds | Saturated seconds | Saturation percentage |
|---|---|---|---|
| A | 5177 | 44 | 0.849913% |
| B | 5177 | 346 | 6.683407% |
| C | 5177 | 147 | 2.839482% |
| D | 5177 | 1817 | 35.097547% |
Noise dominated data is calculated using 1-second bins in cleaned event files. If a bin has >2000 counts, and if more than 50% of those come from <1% of pixels, then it is considered to be noise-dominated and hence unusable.
| Quadrant | # 1 sec bins | Bins with >0 counts | Bins with >2000 counts | High rate bins dominated by noise | Noise dominated (total time) | Noise dominated (detector-on time) | Marked lightcurve |
|---|---|---|---|---|---|---|---|
| A | 7091 | 5178 | 32 | 32 | 0.45% | 0.62% | 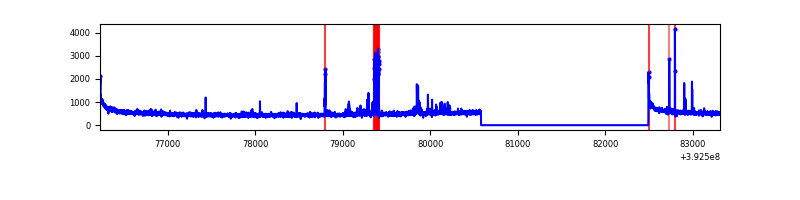 |
| B | 7091 | 5178 | 229 | 229 | 3.23% | 4.42% | 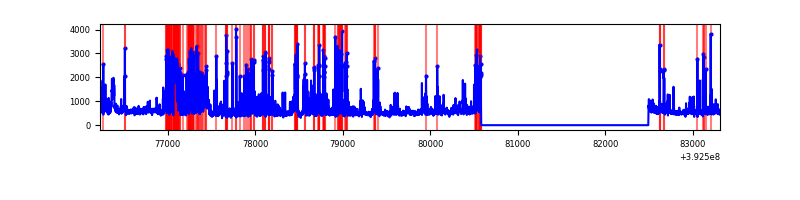 |
| C | 7091 | 5178 | 106 | 106 | 1.49% | 2.05% | 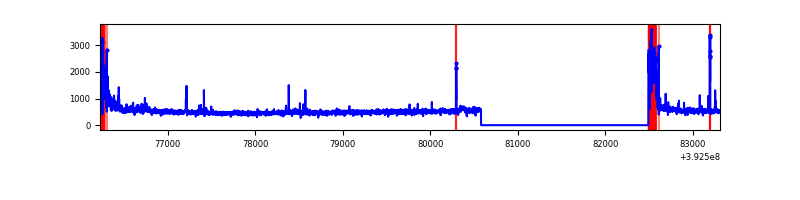 |
| D | 7091 | 5178 | 1805 | 1805 | 25.45% | 34.86% | 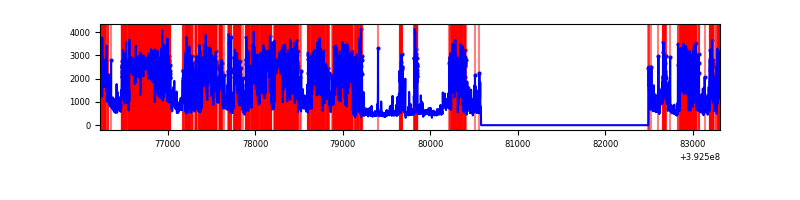 |
Top three noisy pixels from each quadrant. If the there are fewer than three noisy pixels in the level2.evt file, extra rows are filled as -1
| Pixel properties | Quadrant properties | ||||||
|---|---|---|---|---|---|---|---|
| Quadrant | DetID | PixID | Counts | Sigma | Mean | Median | Sigma |
| A | 10 | 83 | 188739 | 1523.3 | 614 | 603 | 123.5 |
| A | 7 | 16 | 151469 | 1221.53 | 614 | 603 | 123.5 |
| A | 9 | 143 | 24605 | 194.34 | 614 | 603 | 123.5 |
| B | 5 | 236 | 799996 | 7045.59 | 601 | 588 | 113.5 |
| B | 5 | 172 | 292027 | 2568.6 | 601 | 588 | 113.5 |
| B | 0 | 213 | 125973 | 1105.08 | 601 | 588 | 113.5 |
| C | 0 | 10 | 391712 | 2812.68 | 597 | 601 | 139.1 |
| C | 15 | 214 | 215269 | 1543.79 | 597 | 601 | 139.1 |
| C | 6 | 255 | 14627 | 100.87 | 597 | 601 | 139.1 |
| D | 12 | 227 | 4042569 | 32231.31 | 513 | 498 | 125.4 |
| D | 12 | 6 | 1235158 | 9845.13 | 513 | 498 | 125.4 |
| D | 12 | 235 | 396370 | 3156.67 | 513 | 498 | 125.4 |
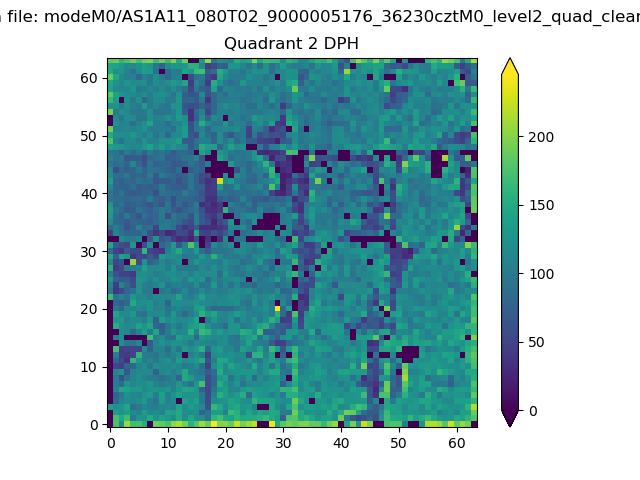
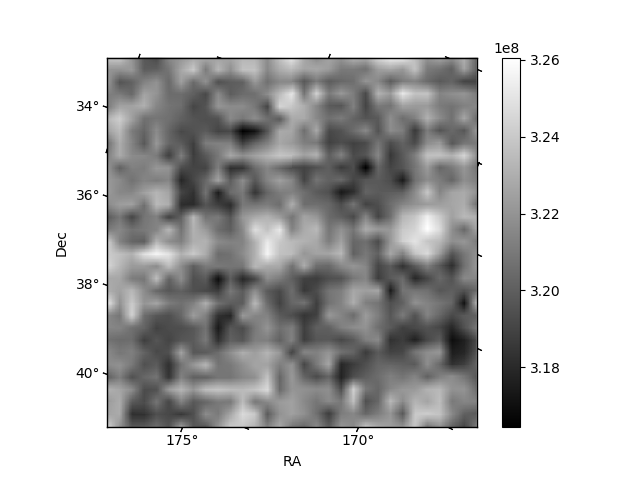
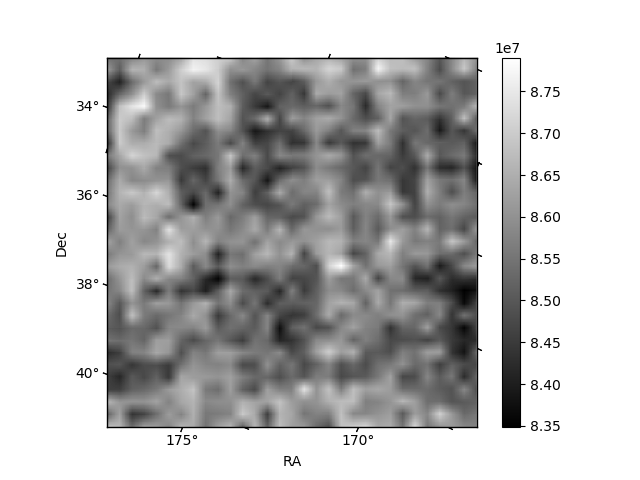
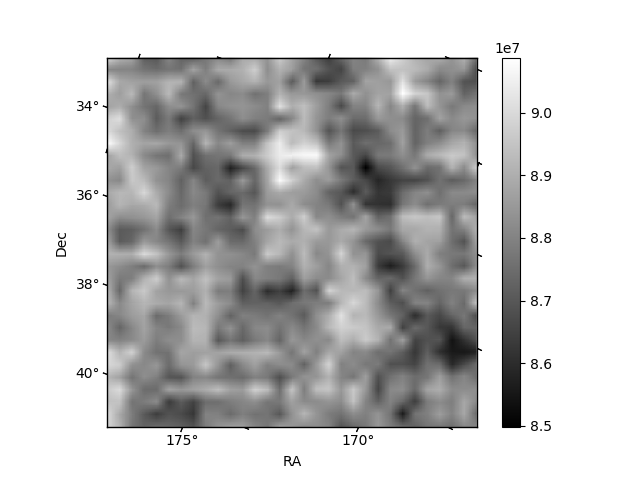
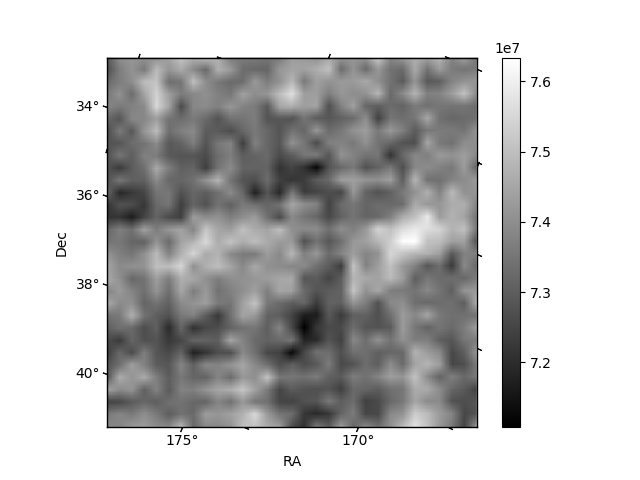
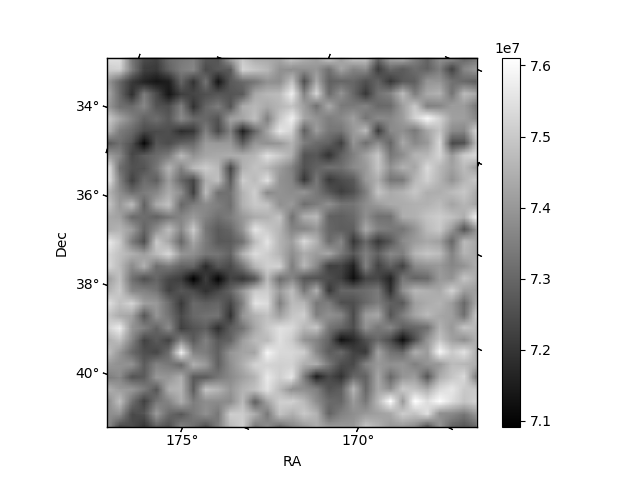
Histogram calculated using DETX and DETY for each event in the final _common_clean file
| Quadrant A | 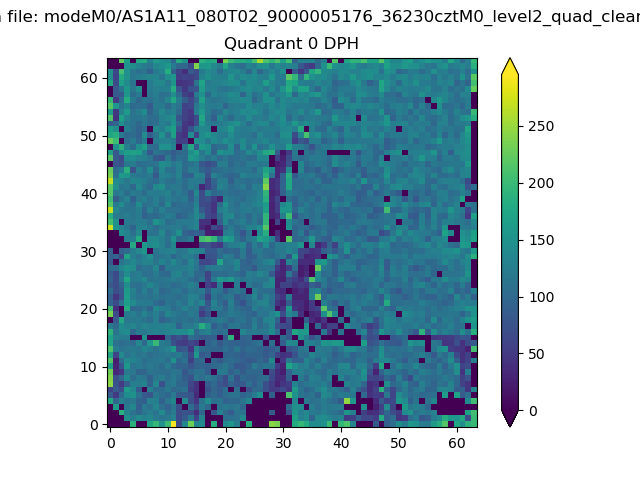 |
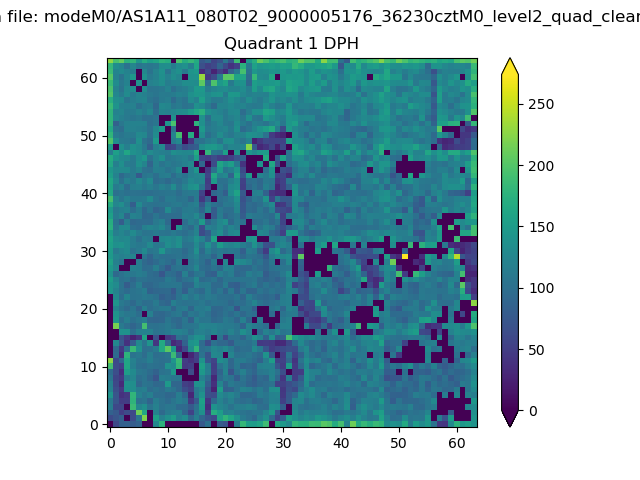 |
Quadrant B |
|---|---|---|---|
| Quadrant D | 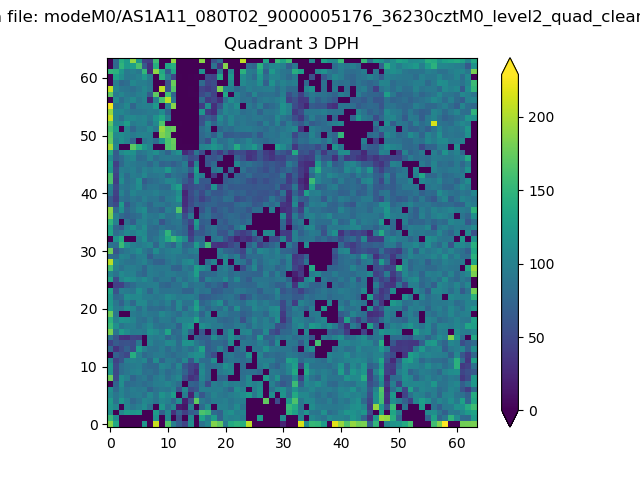 |
 |
Quadrant C |
| Plot type | Count rate plots | Images |
|---|---|---|
| Comparison with Poisson distribution Blue bars denote a histogram of data divided into 1 sec bins. Red curve is a Poisson curve with rate = median count rate of data. |
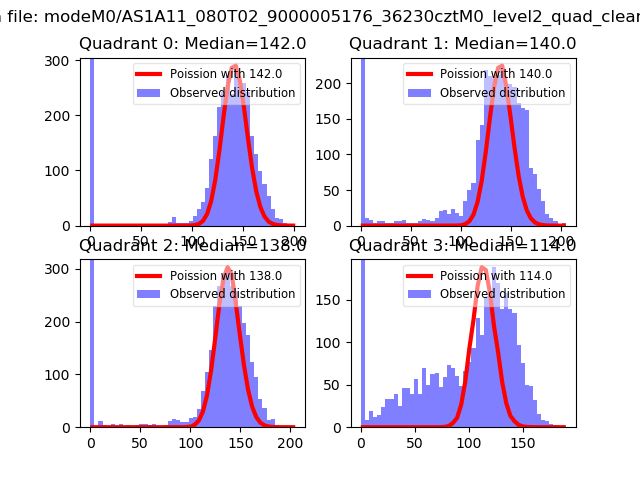 |
 |
| Quadrant-wise count rates Data is divided into 100 sec bins |
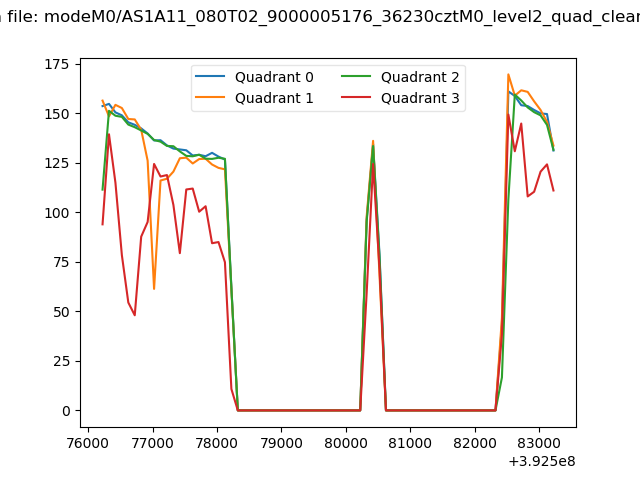 |
|
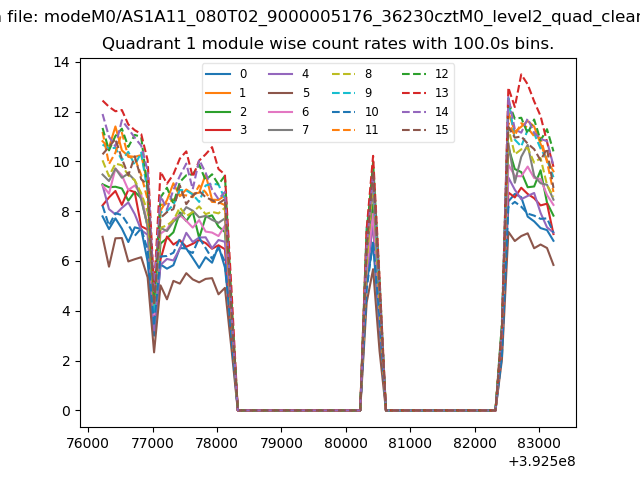
| Module-wise count rates for Quadrant A Data is divided into 100 sec bins |
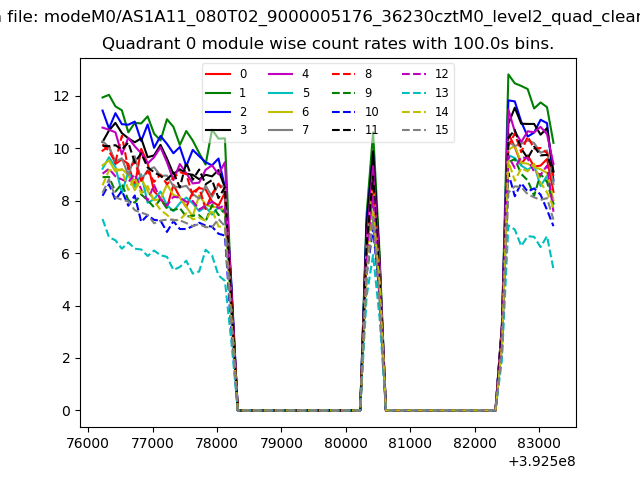 |
 |
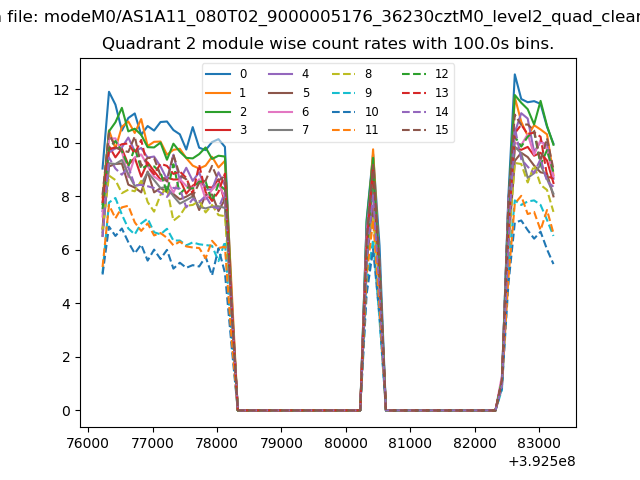
| Module-wise count rates for Quadrant B Data is divided into 100 sec bins |
 |
 |
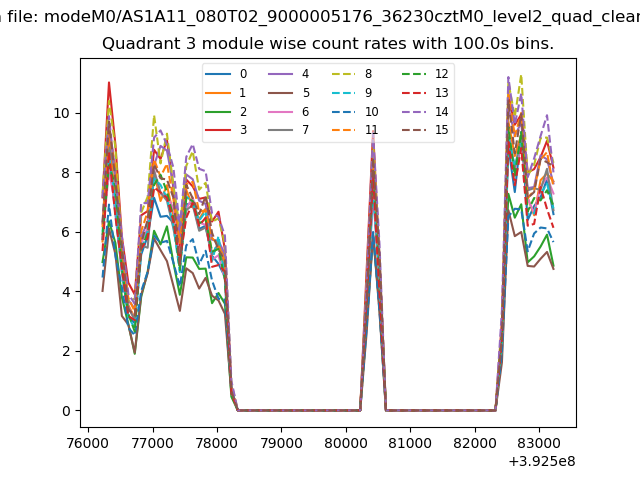
| Module-wise count rates for Quadrant C Data is divided into 100 sec bins |
 |
 |
| Module-wise count rates for Quadrant D Data is divided into 100 sec bins |
 |
 |
| Parameter | Plot |
|---|---|
| CZT HV Monitor | 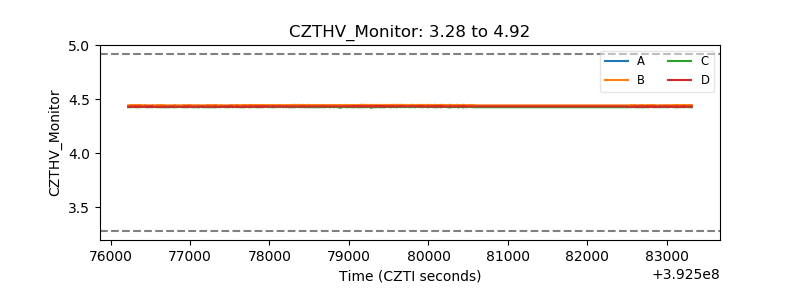 |
| D_VDD | 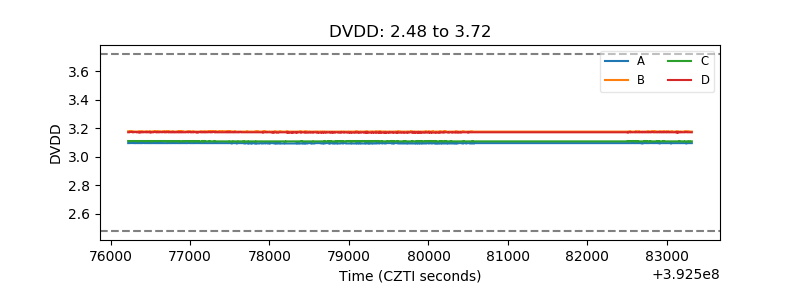 |
| Temperature 1 | 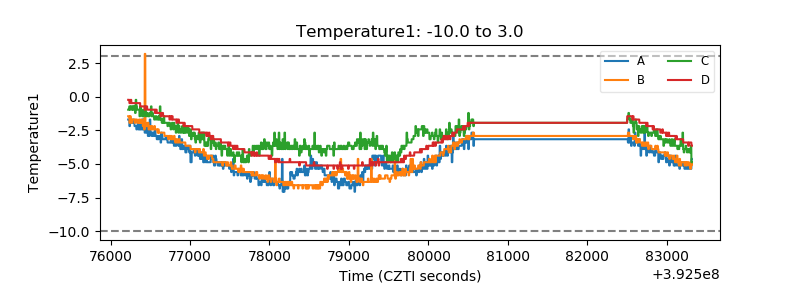 |
| Veto HV Monitor | 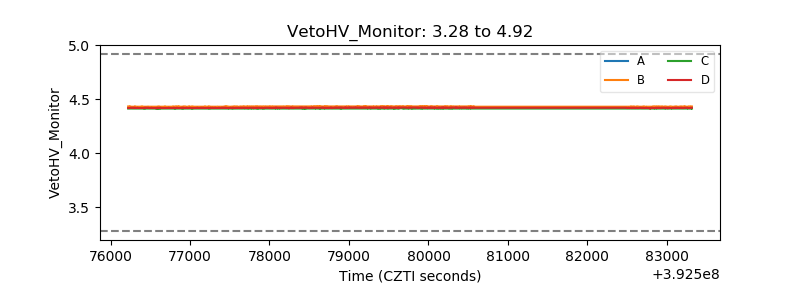 |
| Veto LLD | 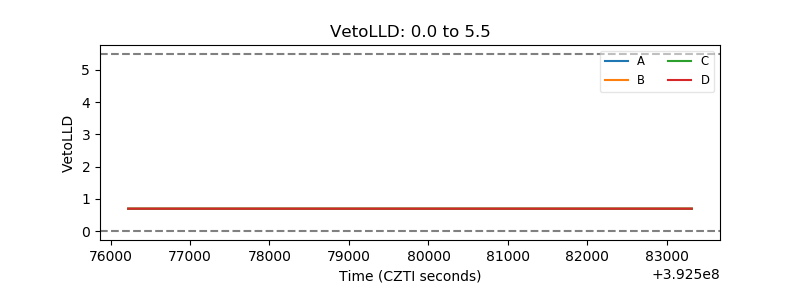 |
| Alpha Counter | 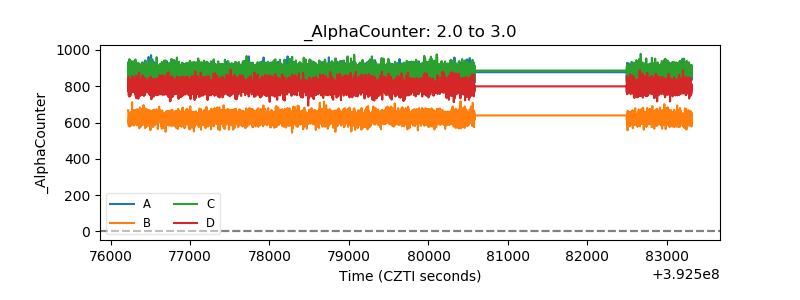 |
| _CPM_Rate | 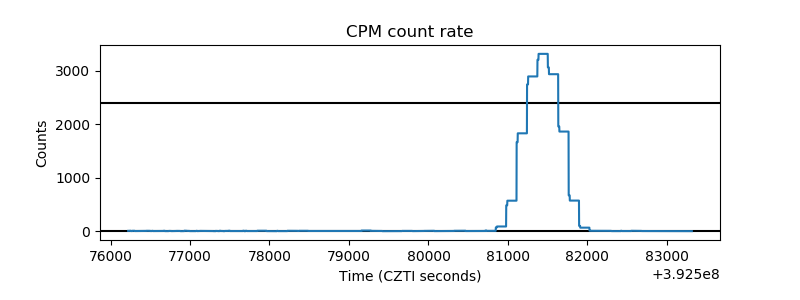 |
| CZT Counter | 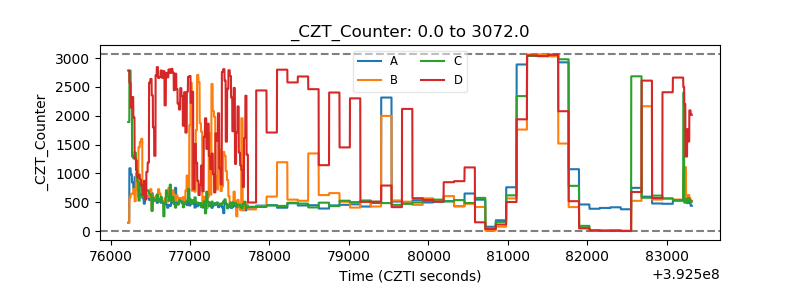 |
| +2.5 Volts monitor | 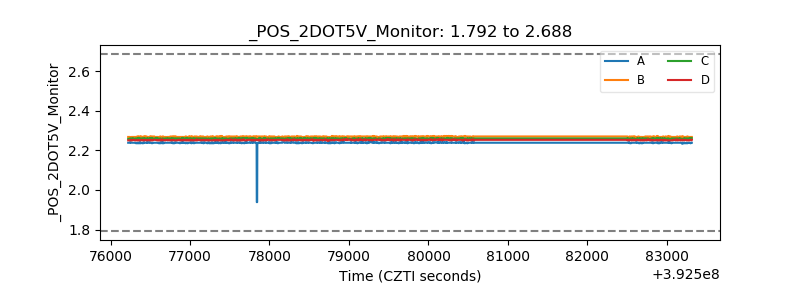 |
| +5 Volts monitor | 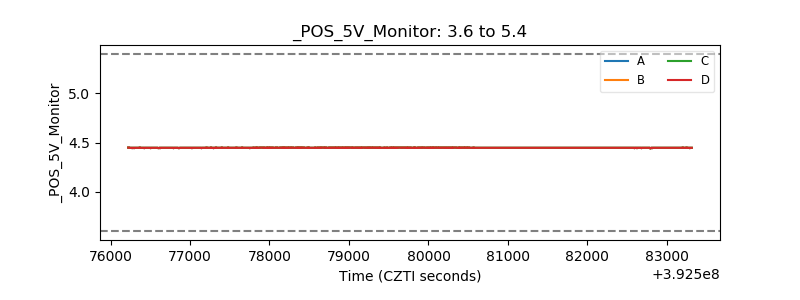 |
| _ROLL_ROT | 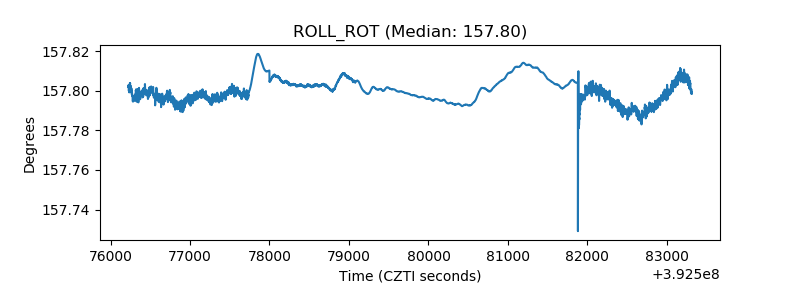 |
| _Roll_DEC | 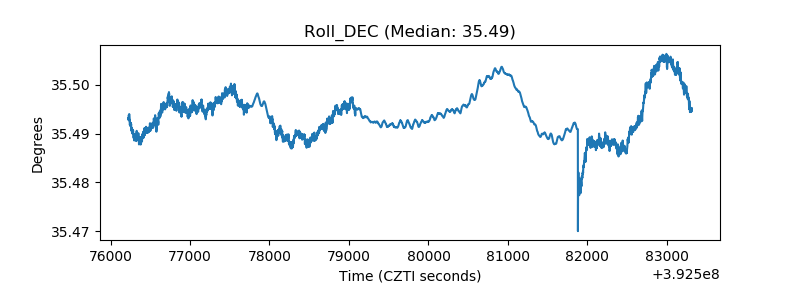 |
| _Roll_RA | 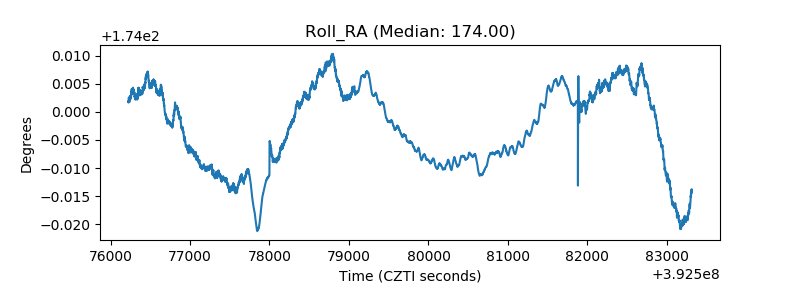 |
| Veto Counter | 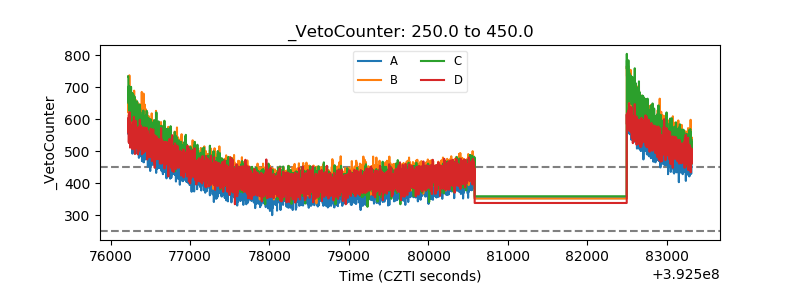 |