| Param | Original file | Final file |
|---|---|---|
| Filename | modeM0/AS1A11_080T02_9000005176_36225cztM0_level2.evt | modeM0/AS1A11_080T02_9000005176_36225cztM0_level2_quad_clean.evt |
| Size (bytes) | 833,368,320 | 117,466,560 |
| Size | 794.8 MB | 112.0 MB |
| Events in quadrant A | 3,788,507 | 800,250 |
| Events in quadrant B | 6,517,353 | 773,607 |
| Events in quadrant C | 3,913,545 | 791,759 |
| Events in quadrant D | 10,490,101 | 645,677 |
| Mode M9 | |||
|---|---|---|---|
| Quadrant | BADHDUFLAG | Total packets | Discarded packets |
| A | 0 | 19 | 0 |
| B | 0 | 19 | 0 |
| C | 0 | 19 | 0 |
| D | 0 | 20 | 0 |
| Mode M0 | |||
|---|---|---|---|
| Quadrant | BADHDUFLAG | Total packets | Discarded packets |
| A | 0 | 16267 | 3 |
| B | 0 | 24470 | 2 |
| C | 0 | 16310 | 2 |
| D | 0 | 36521 | 2 |
| Mode SS | |||
|---|---|---|---|
| Quadrant | BADHDUFLAG | Total packets | Discarded packets |
| A | 0 | 160 | 0 |
| B | 0 | 160 | 0 |
| C | 0 | 160 | 0 |
| D | 0 | 160 | 0 |
| Quadrant | Total seconds | Saturated seconds | Saturation percentage |
|---|---|---|---|
| A | 7837 | 15 | 0.191400% |
| B | 7837 | 699 | 8.919229% |
| C | 7837 | 23 | 0.293480% |
| D | 7837 | 1920 | 24.499171% |
Noise dominated data is calculated using 1-second bins in cleaned event files. If a bin has >2000 counts, and if more than 50% of those come from <1% of pixels, then it is considered to be noise-dominated and hence unusable.
| Quadrant | # 1 sec bins | Bins with >0 counts | Bins with >2000 counts | High rate bins dominated by noise | Noise dominated (total time) | Noise dominated (detector-on time) | Marked lightcurve |
|---|---|---|---|---|---|---|---|
| A | 9150 | 7838 | 6 | 6 | 0.07% | 0.08% | 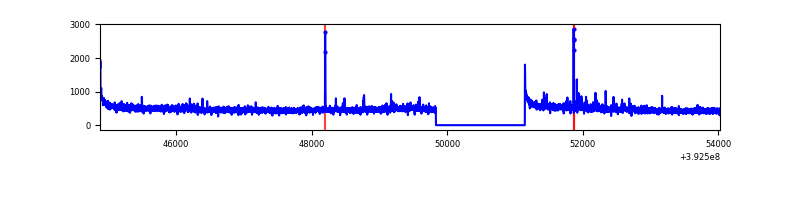 |
| B | 9150 | 7838 | 529 | 529 | 5.78% | 6.75% | 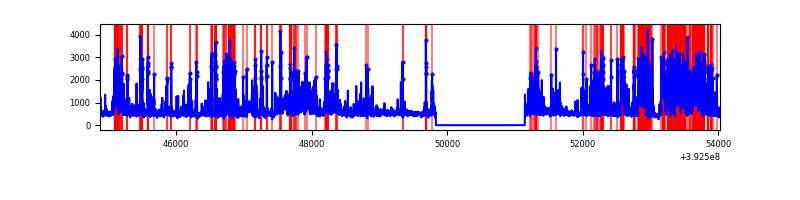 |
| C | 9150 | 7838 | 12 | 12 | 0.13% | 0.15% | 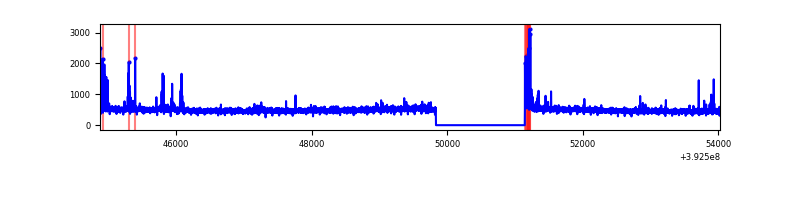 |
| D | 9150 | 7838 | 1893 | 1893 | 20.69% | 24.15% | 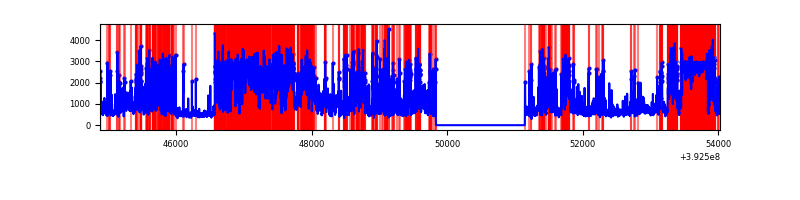 |
Top three noisy pixels from each quadrant. If the there are fewer than three noisy pixels in the level2.evt file, extra rows are filled as -1
| Pixel properties | Quadrant properties | ||||||
|---|---|---|---|---|---|---|---|
| Quadrant | DetID | PixID | Counts | Sigma | Mean | Median | Sigma |
| A | 10 | 83 | 243253 | 1337.32 | 890 | 870 | 181.2 |
| A | 9 | 143 | 36475 | 196.45 | 890 | 870 | 181.2 |
| A | 15 | 223 | 35924 | 193.41 | 890 | 870 | 181.2 |
| B | 0 | 213 | 1138320 | 6898.97 | 861 | 838 | 164.9 |
| B | 5 | 236 | 1101569 | 6676.07 | 861 | 838 | 164.9 |
| B | 5 | 172 | 717773 | 4348.3 | 861 | 838 | 164.9 |
| C | 15 | 214 | 330630 | 1617.35 | 869 | 874 | 203.9 |
| C | 0 | 10 | 119739 | 583.0 | 869 | 874 | 203.9 |
| C | 0 | 207 | 72077 | 349.23 | 869 | 874 | 203.9 |
| D | 12 | 227 | 5506067 | 28492.78 | 788 | 765 | 193.2 |
| D | 12 | 235 | 643108 | 3324.46 | 788 | 765 | 193.2 |
| D | 12 | 6 | 551585 | 2850.78 | 788 | 765 | 193.2 |
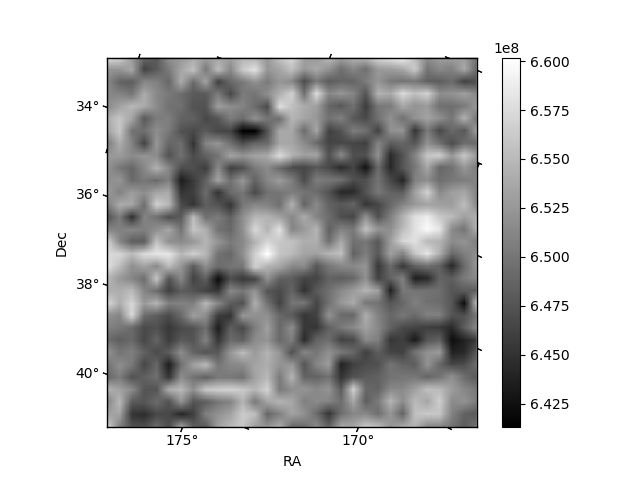
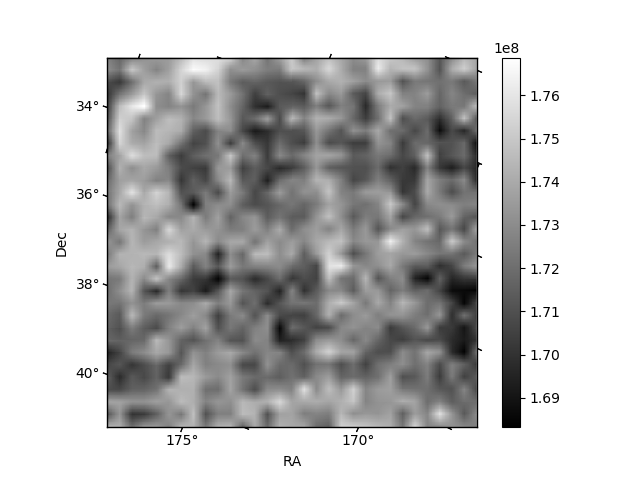
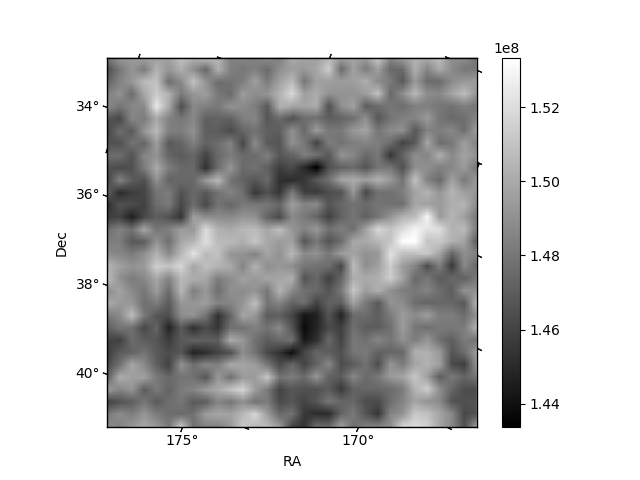
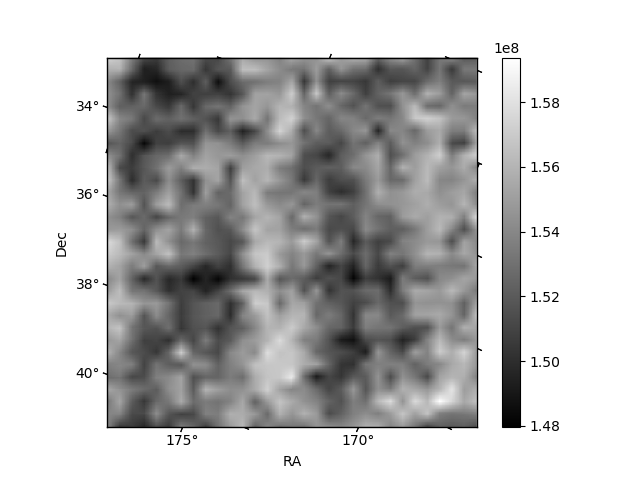
Histogram calculated using DETX and DETY for each event in the final _common_clean file
| Quadrant A | 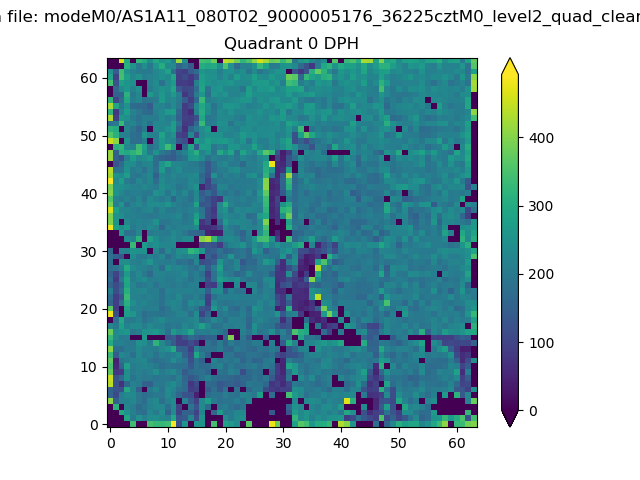 |
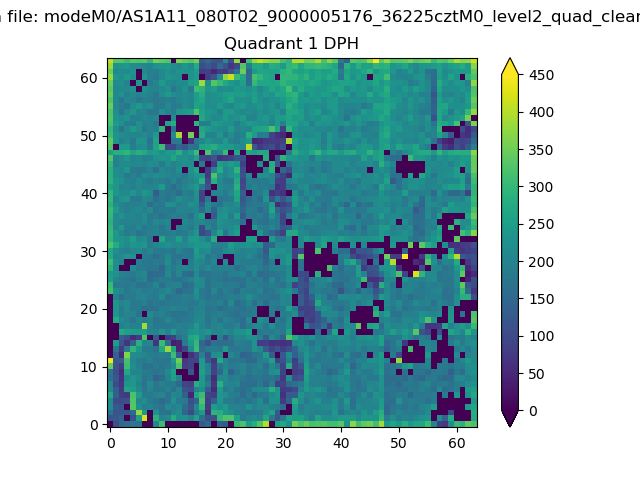 |
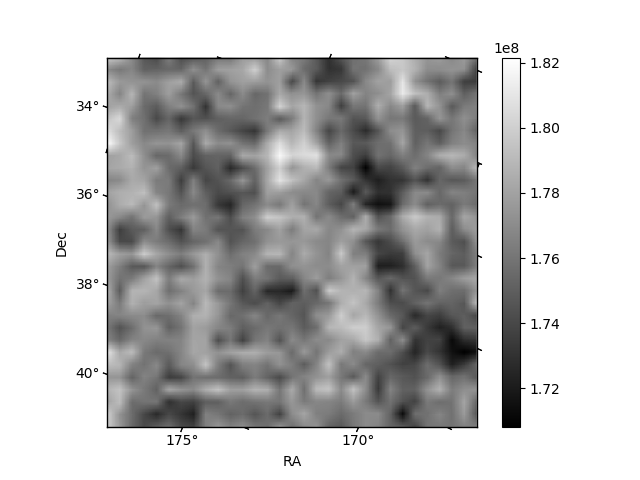
Quadrant B |
|---|---|---|---|
| Quadrant D | 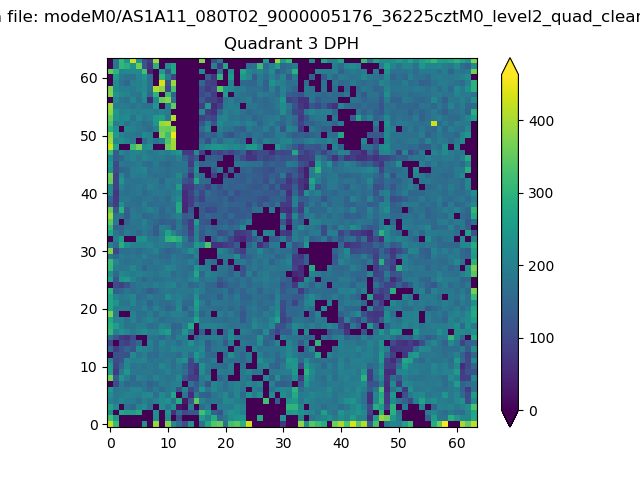 |
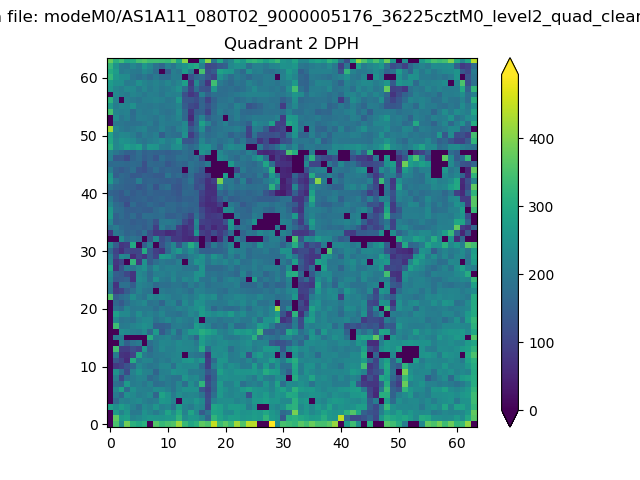 |
Quadrant C |
| Plot type | Count rate plots | Images |
|---|---|---|
| Comparison with Poisson distribution Blue bars denote a histogram of data divided into 1 sec bins. Red curve is a Poisson curve with rate = median count rate of data. |
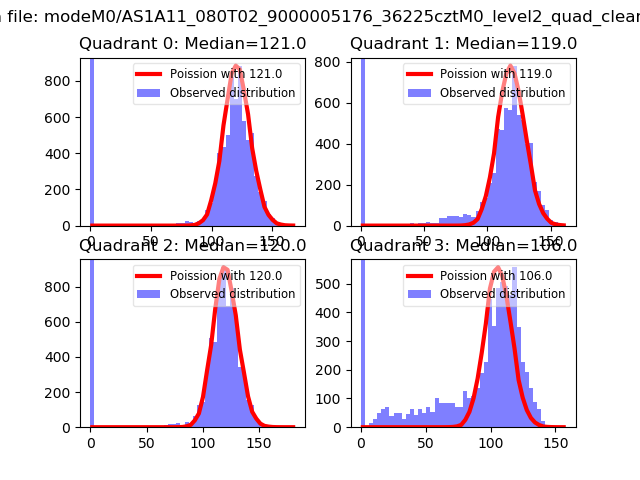 |
 |
| Quadrant-wise count rates Data is divided into 100 sec bins |
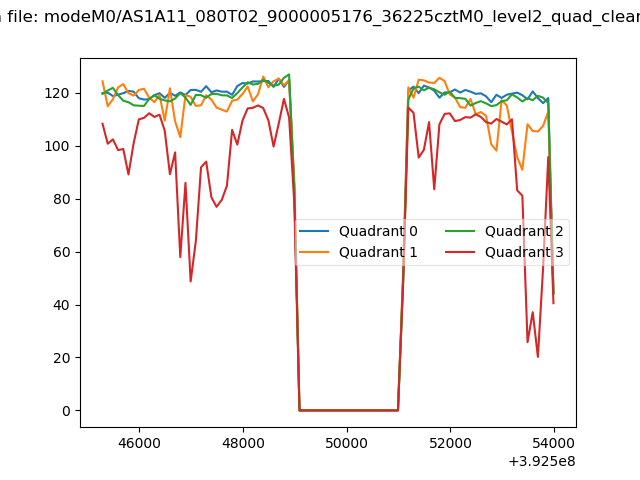 |
|
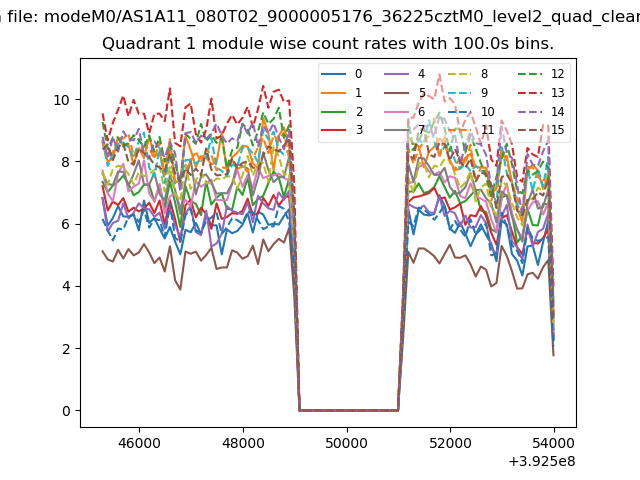
| Module-wise count rates for Quadrant A Data is divided into 100 sec bins |
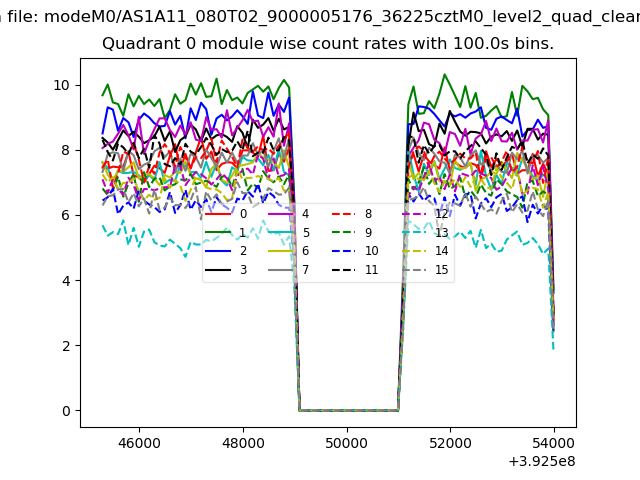 |
 |
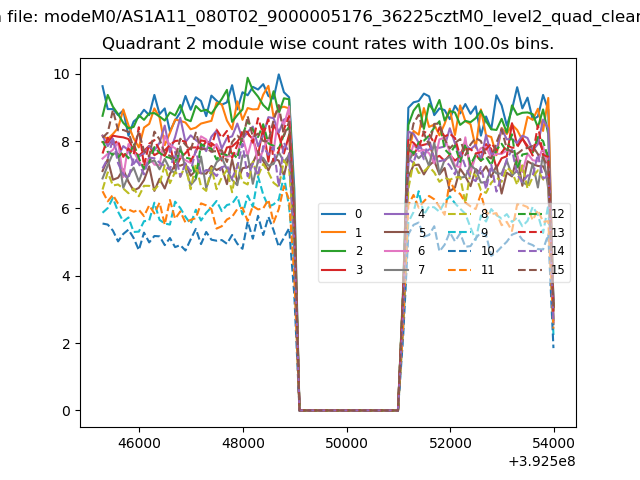
| Module-wise count rates for Quadrant B Data is divided into 100 sec bins |
 |
 |
| Module-wise count rates for Quadrant C Data is divided into 100 sec bins |
 |
 |
| Module-wise count rates for Quadrant D Data is divided into 100 sec bins |
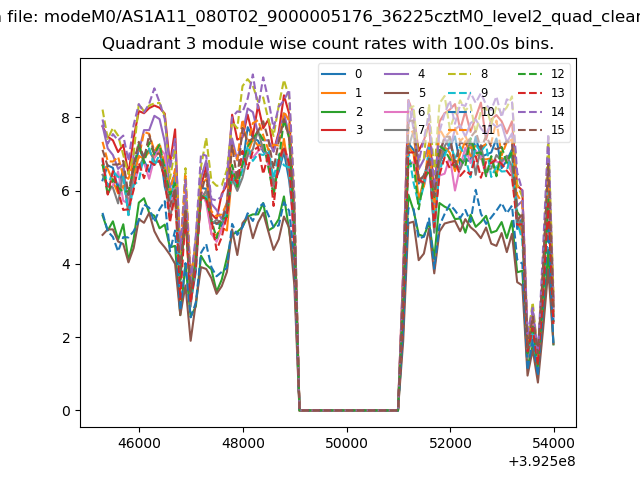 |
 |
| Parameter | Plot |
|---|---|
| CZT HV Monitor | 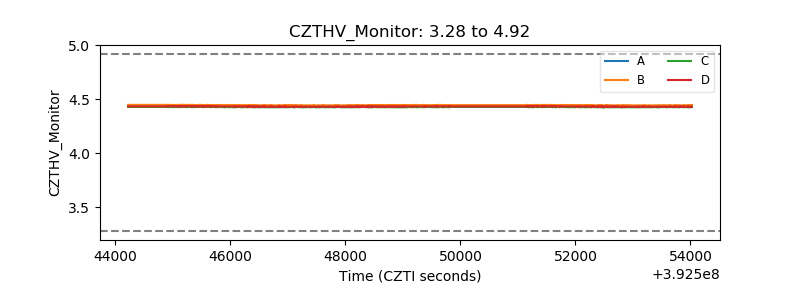 |
| D_VDD | 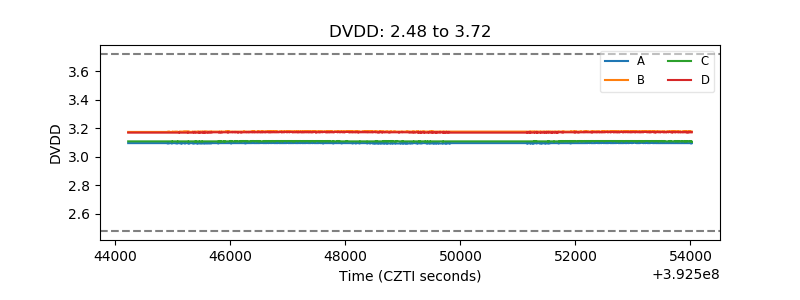 |
| Temperature 1 | 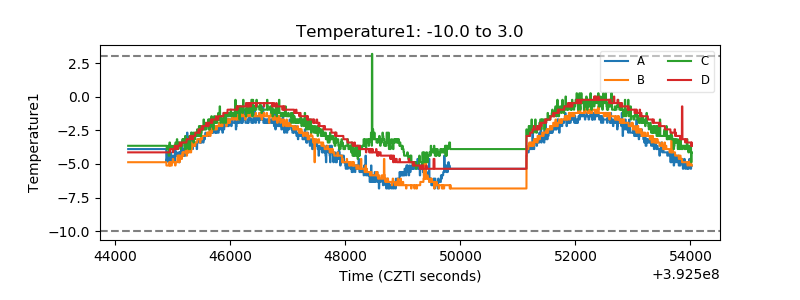 |
| Veto HV Monitor | 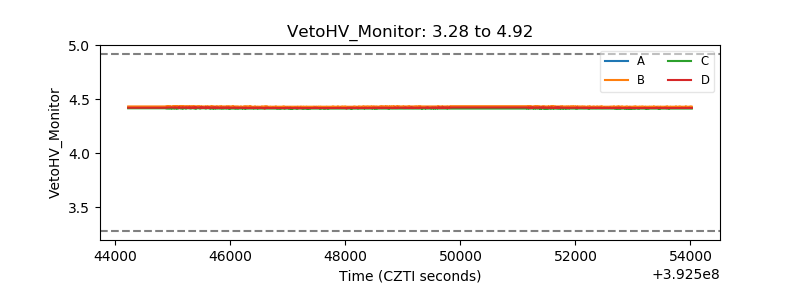 |
| Veto LLD | 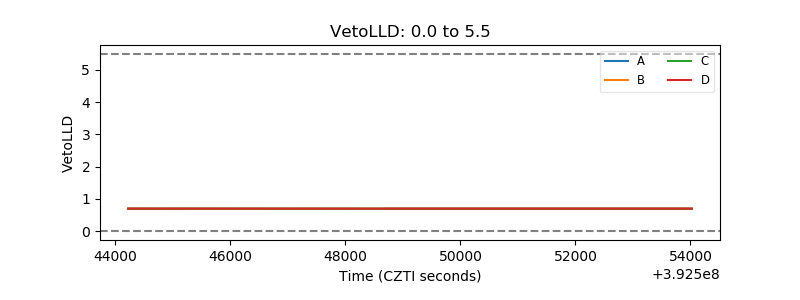 |
| Alpha Counter | 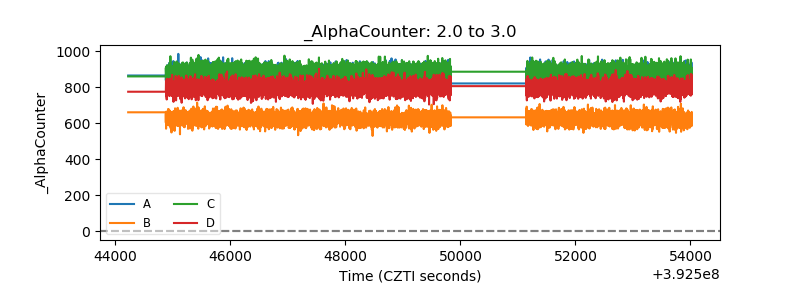 |
| _CPM_Rate | 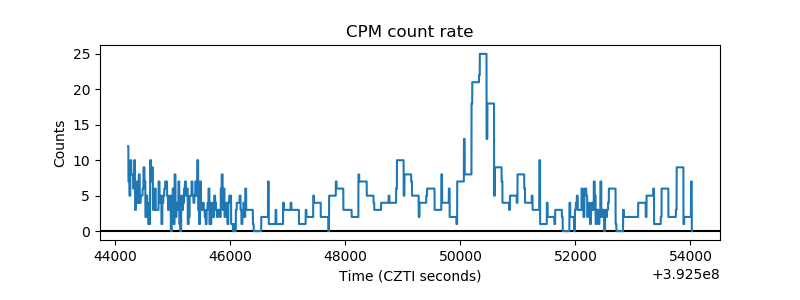 |
| CZT Counter | 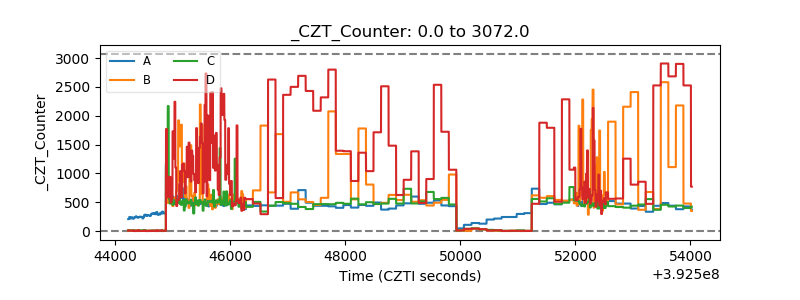 |
| +2.5 Volts monitor | 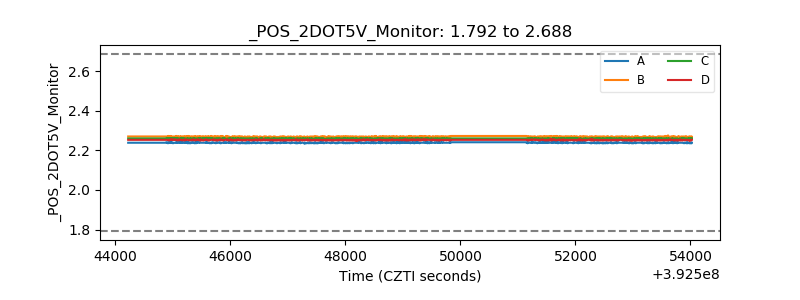 |
| +5 Volts monitor | 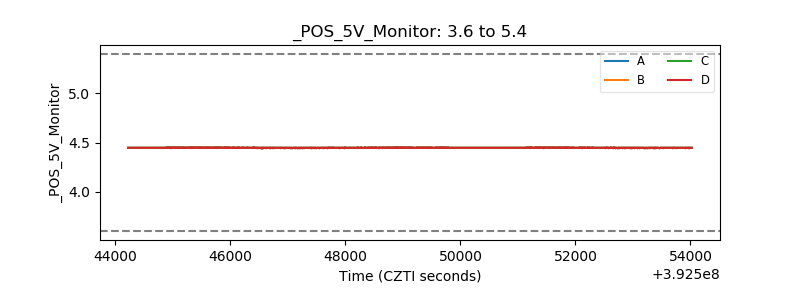 |
| _ROLL_ROT | 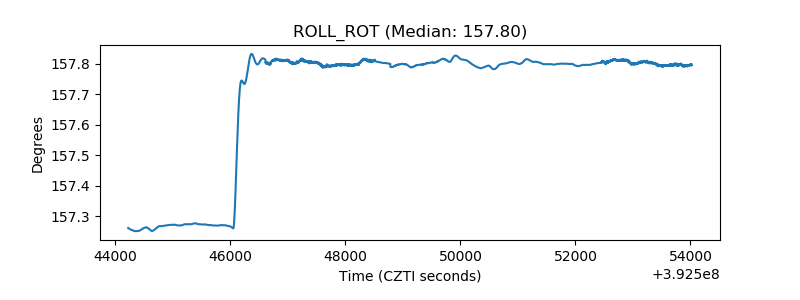 |
| _Roll_DEC | 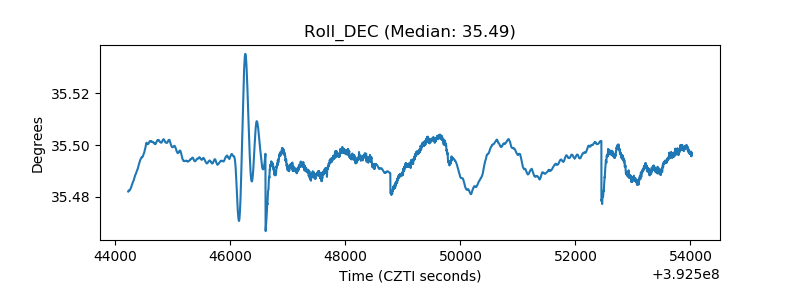 |
| _Roll_RA | 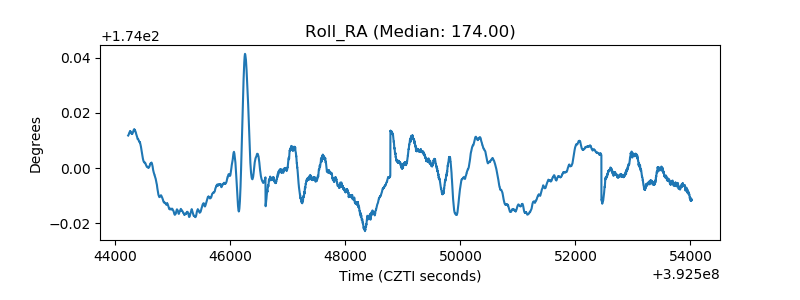 |
| Veto Counter | 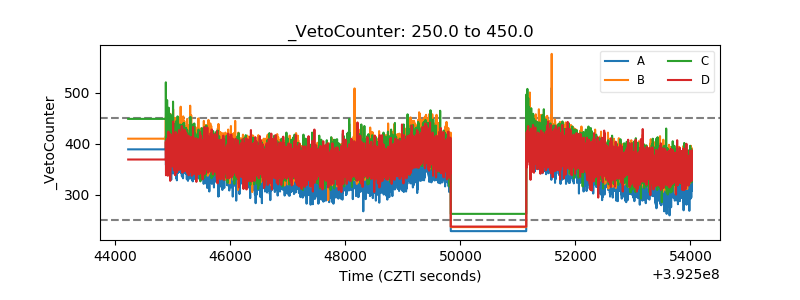 |