| Param | Original file | Final file |
|---|---|---|
| Filename | modeM0/AS1A11_080T02_9000005176_36216cztM0_level2.evt | modeM0/AS1A11_080T02_9000005176_36216cztM0_level2_quad_clean.evt |
| Size (bytes) | 533,574,720 | 66,035,520 |
| Size | 508.9 MB | 63.0 MB |
| Events in quadrant A | 2,943,205 | 438,315 |
| Events in quadrant B | 3,391,208 | 441,426 |
| Events in quadrant C | 3,203,832 | 434,787 |
| Events in quadrant D | 6,272,178 | 323,384 |
| Mode M9 | |||
|---|---|---|---|
| Quadrant | BADHDUFLAG | Total packets | Discarded packets |
| A | 0 | 29 | 0 |
| B | 0 | 29 | 0 |
| C | 0 | 29 | 0 |
| D | 0 | 30 | 0 |
| Mode M0 | |||
|---|---|---|---|
| Quadrant | BADHDUFLAG | Total packets | Discarded packets |
| A | 0 | 11919 | 3 |
| B | 0 | 13330 | 2 |
| C | 0 | 12810 | 2 |
| D | 0 | 22238 | 2 |
| Mode SS | |||
|---|---|---|---|
| Quadrant | BADHDUFLAG | Total packets | Discarded packets |
| A | 0 | 106 | 0 |
| B | 0 | 106 | 0 |
| C | 0 | 106 | 0 |
| D | 0 | 106 | 0 |
| Quadrant | Total seconds | Saturated seconds | Saturation percentage |
|---|---|---|---|
| A | 5149 | 20 | 0.388425% |
| B | 5149 | 139 | 2.699553% |
| C | 5149 | 101 | 1.961546% |
| D | 5149 | 1094 | 21.246844% |
Noise dominated data is calculated using 1-second bins in cleaned event files. If a bin has >2000 counts, and if more than 50% of those come from <1% of pixels, then it is considered to be noise-dominated and hence unusable.
| Quadrant | # 1 sec bins | Bins with >0 counts | Bins with >2000 counts | High rate bins dominated by noise | Noise dominated (total time) | Noise dominated (detector-on time) | Marked lightcurve |
|---|---|---|---|---|---|---|---|
| A | 7092 | 5150 | 8 | 8 | 0.11% | 0.16% | 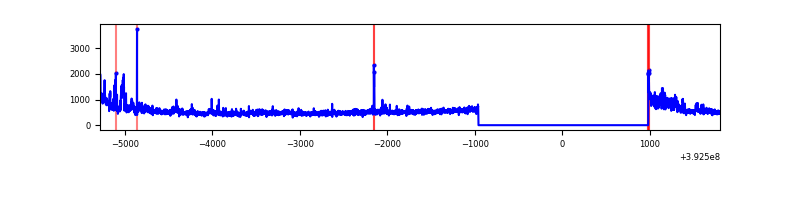 |
| B | 7092 | 5150 | 94 | 94 | 1.33% | 1.83% | 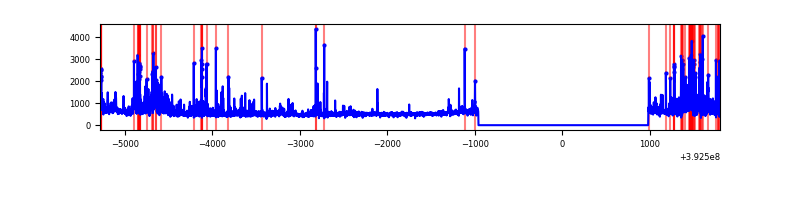 |
| C | 7092 | 5150 | 79 | 79 | 1.11% | 1.53% | 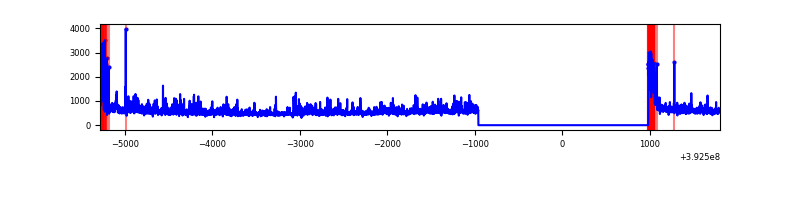 |
| D | 7092 | 5150 | 1068 | 1068 | 15.06% | 20.74% | 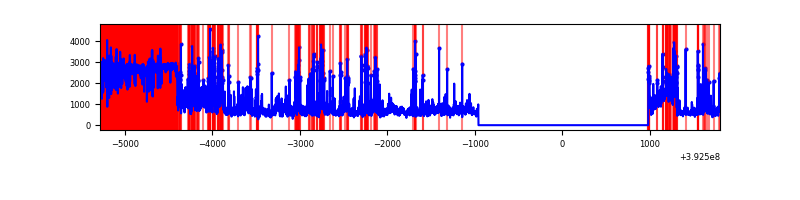 |
Top three noisy pixels from each quadrant. If the there are fewer than three noisy pixels in the level2.evt file, extra rows are filled as -1
| Pixel properties | Quadrant properties | ||||||
|---|---|---|---|---|---|---|---|
| Quadrant | DetID | PixID | Counts | Sigma | Mean | Median | Sigma |
| A | 15 | 223 | 319527 | 2579.86 | 618 | 605 | 123.6 |
| A | 10 | 83 | 183390 | 1478.6 | 618 | 605 | 123.6 |
| A | 9 | 143 | 19546 | 153.22 | 618 | 605 | 123.6 |
| B | 5 | 172 | 256185 | 2189.39 | 615 | 600 | 116.7 |
| B | 0 | 190 | 197956 | 1690.59 | 615 | 600 | 116.7 |
| B | 5 | 236 | 141821 | 1209.73 | 615 | 600 | 116.7 |
| C | 0 | 10 | 579372 | 4143.84 | 603 | 610 | 139.7 |
| C | 15 | 214 | 215567 | 1539.06 | 603 | 610 | 139.7 |
| C | 1 | 23 | 38676 | 272.55 | 603 | 610 | 139.7 |
| D | 12 | 235 | 1003805 | 7757.1 | 527 | 513 | 129.3 |
| D | 10 | 253 | 867455 | 6702.89 | 527 | 513 | 129.3 |
| D | 12 | 227 | 772614 | 5969.62 | 527 | 513 | 129.3 |
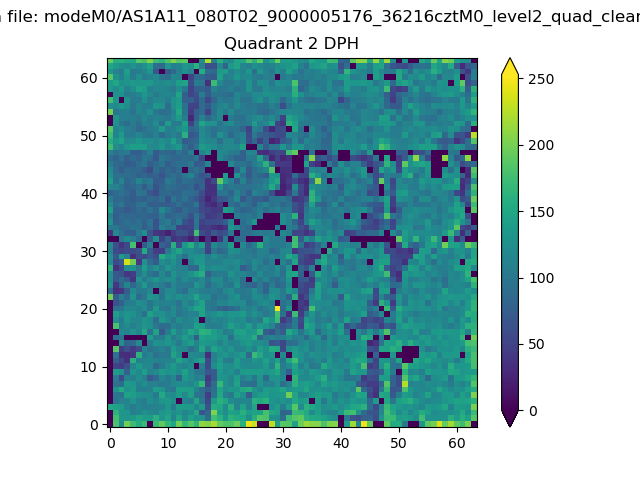
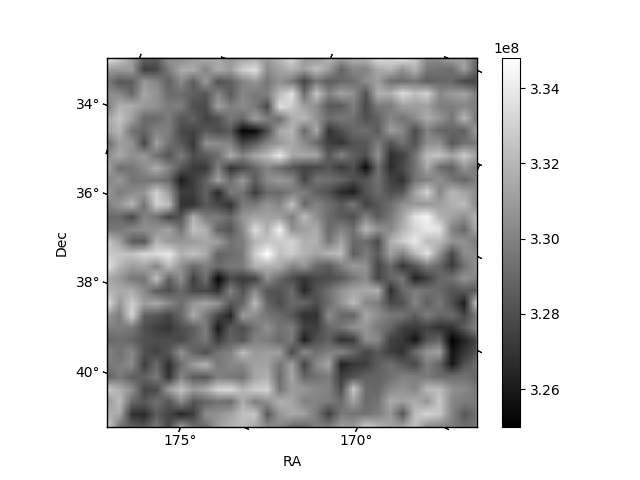
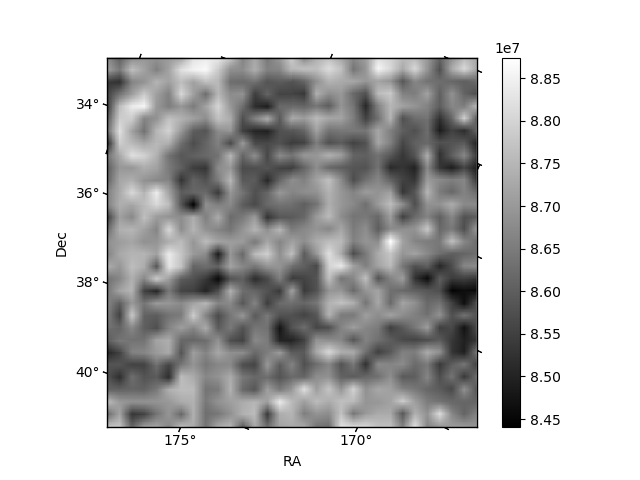
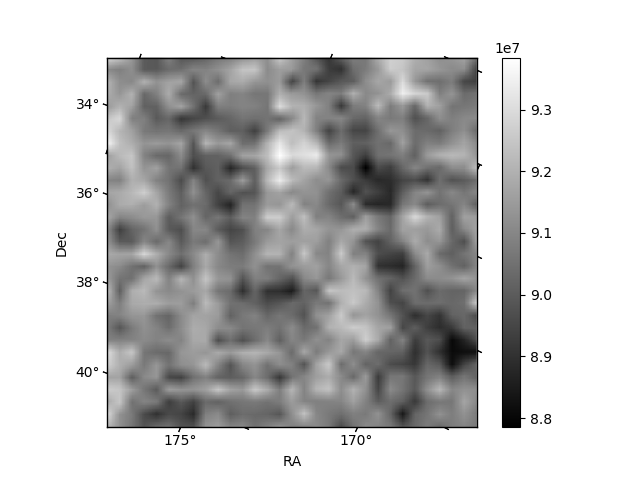
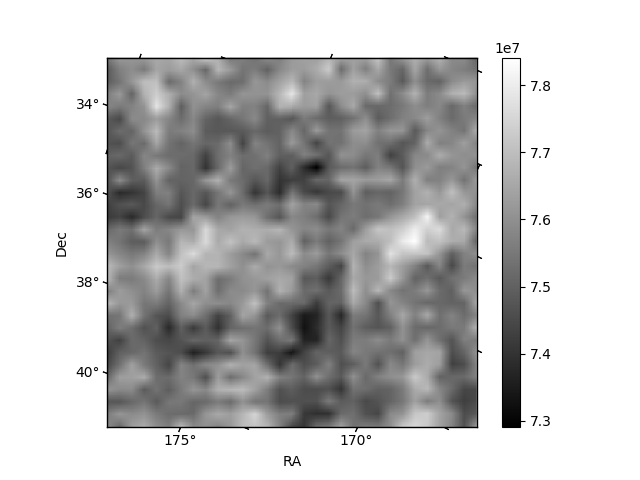
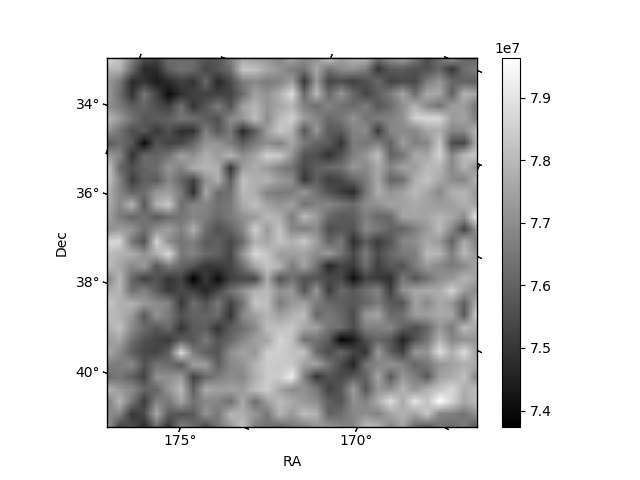
Histogram calculated using DETX and DETY for each event in the final _common_clean file
| Quadrant A | 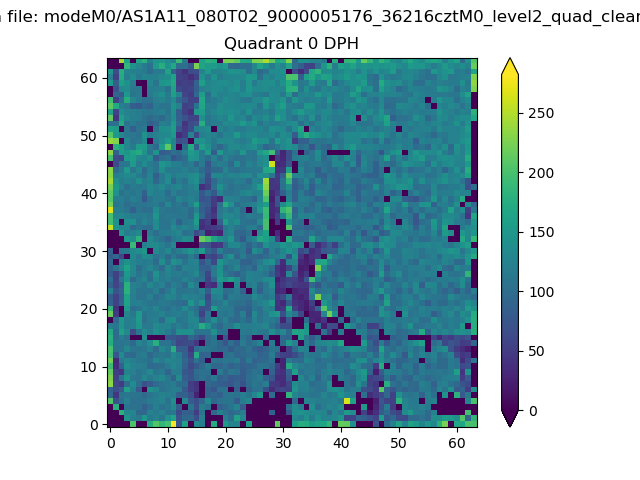 |
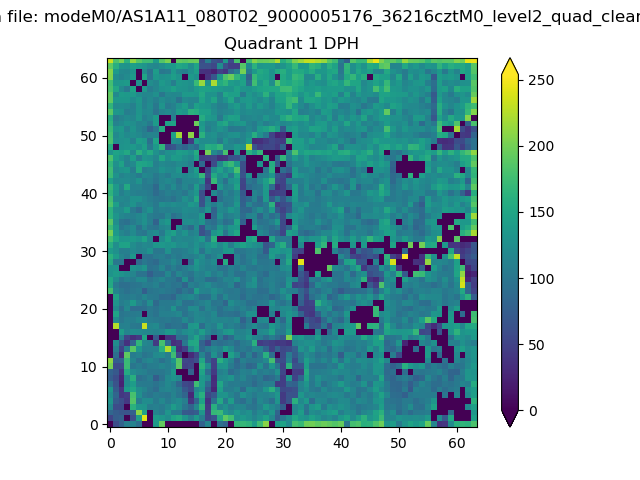 |
Quadrant B |
|---|---|---|---|
| Quadrant D | 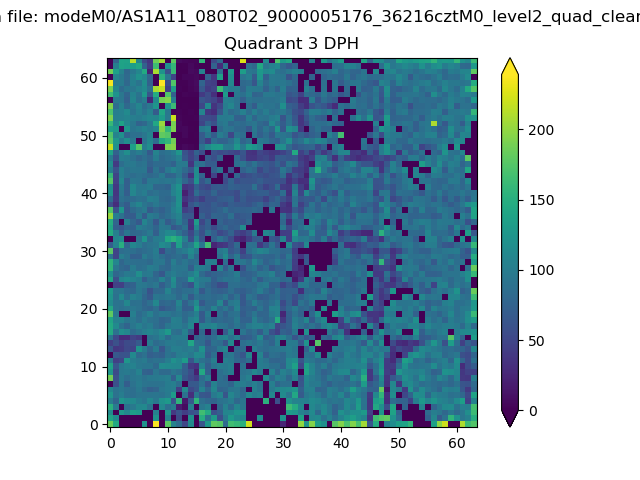 |
 |
Quadrant C |
| Plot type | Count rate plots | Images |
|---|---|---|
| Comparison with Poisson distribution Blue bars denote a histogram of data divided into 1 sec bins. Red curve is a Poisson curve with rate = median count rate of data. |
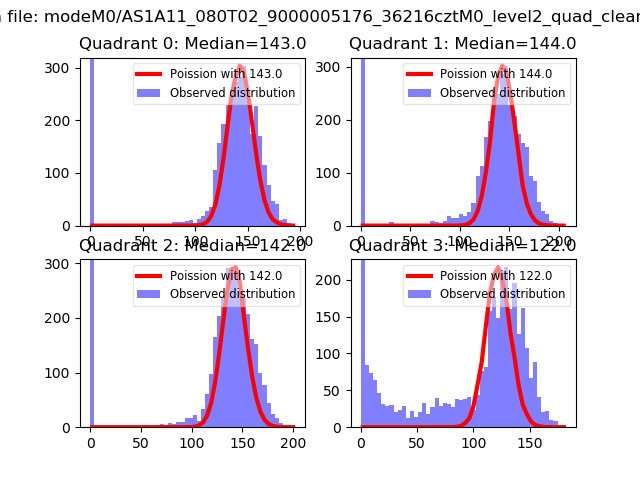 |
 |
| Quadrant-wise count rates Data is divided into 100 sec bins |
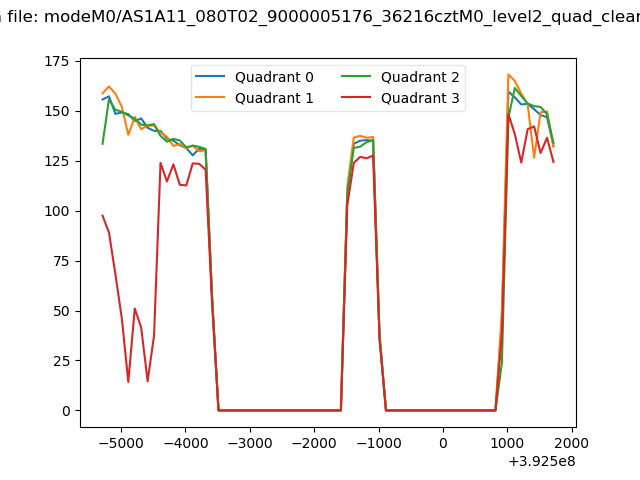 |
|
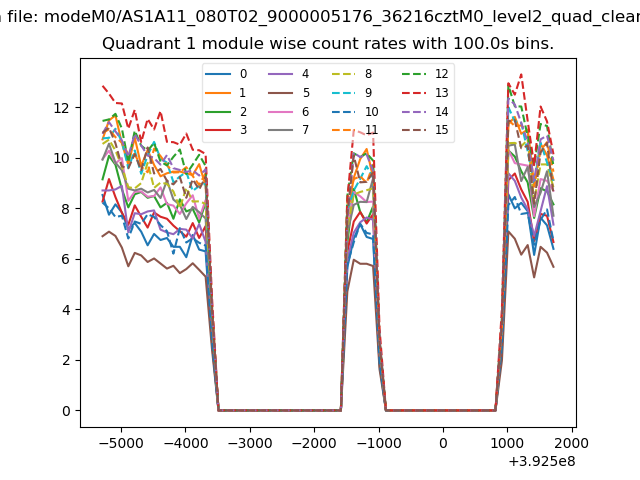
| Module-wise count rates for Quadrant A Data is divided into 100 sec bins |
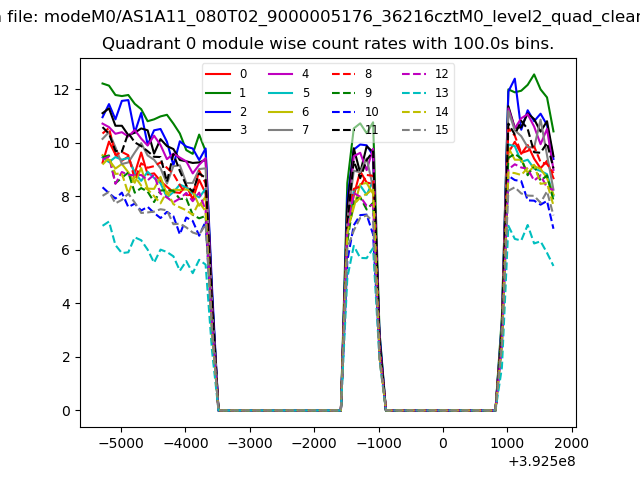 |
 |
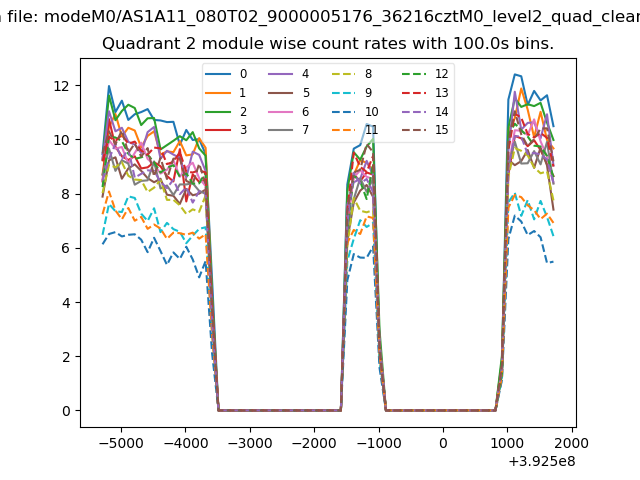
| Module-wise count rates for Quadrant B Data is divided into 100 sec bins |
 |
 |
| Module-wise count rates for Quadrant C Data is divided into 100 sec bins |
 |
 |
| Module-wise count rates for Quadrant D Data is divided into 100 sec bins |
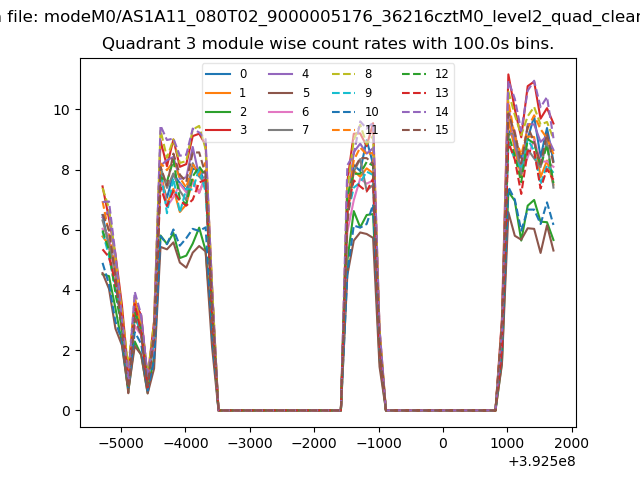 |
 |
| Parameter | Plot |
|---|---|
| CZT HV Monitor | 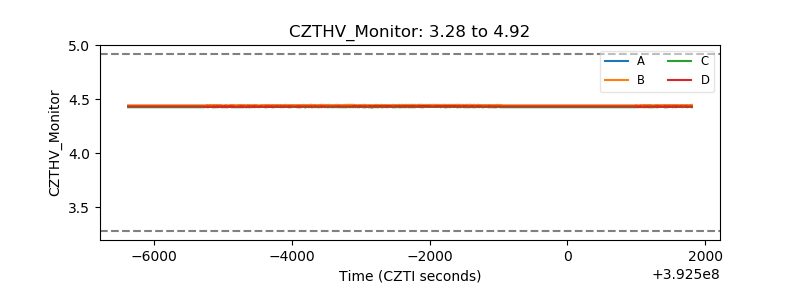 |
| D_VDD | 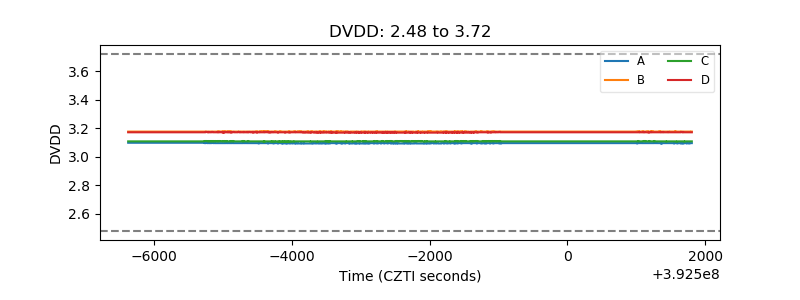 |
| Temperature 1 | 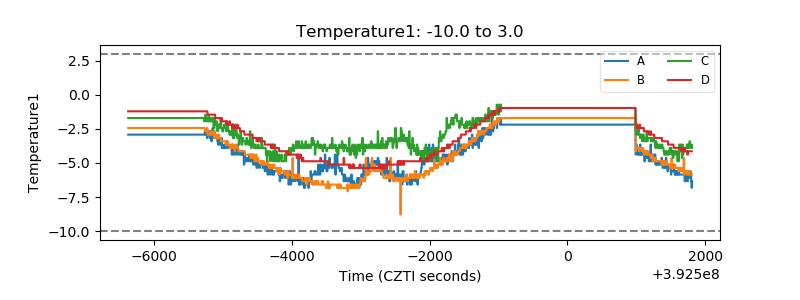 |
| Veto HV Monitor | 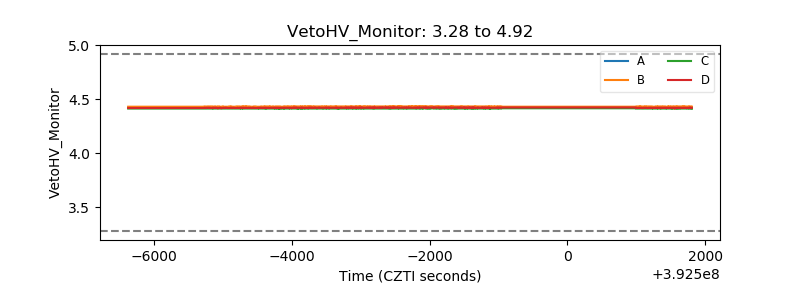 |
| Veto LLD | 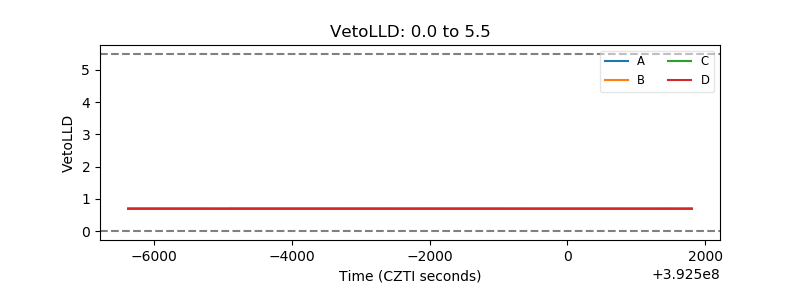 |
| Alpha Counter | 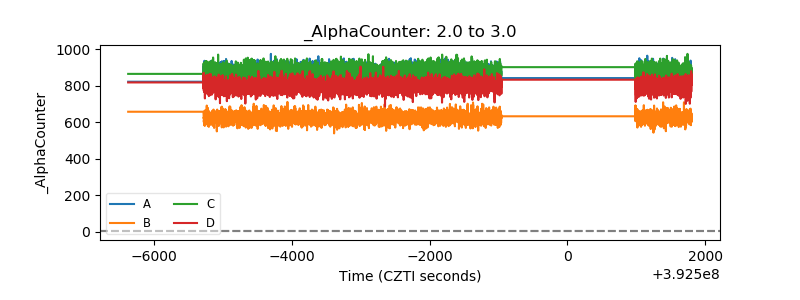 |
| _CPM_Rate | 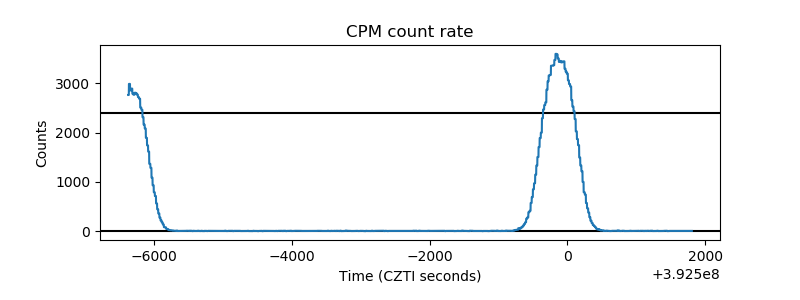 |
| CZT Counter | 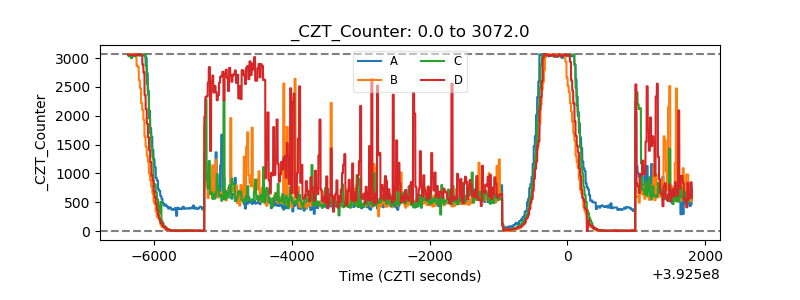 |
| +2.5 Volts monitor | 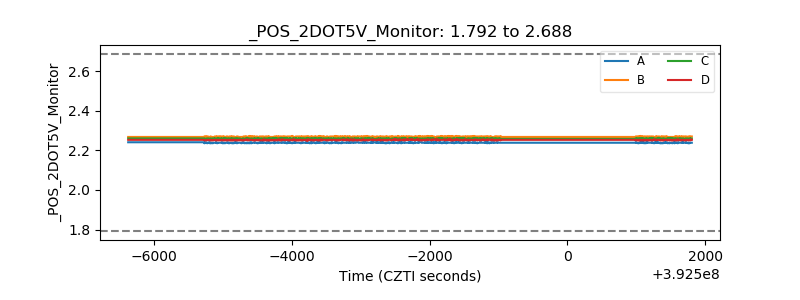 |
| +5 Volts monitor | 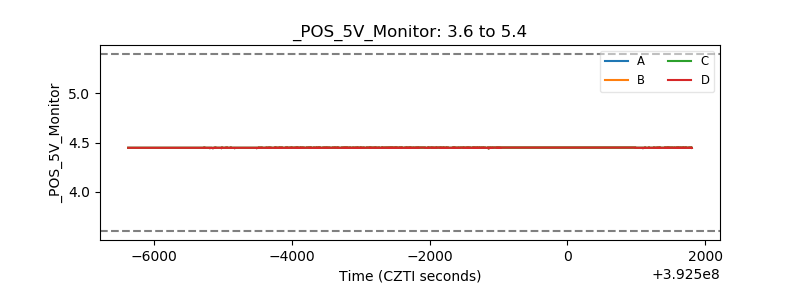 |
| _ROLL_ROT | 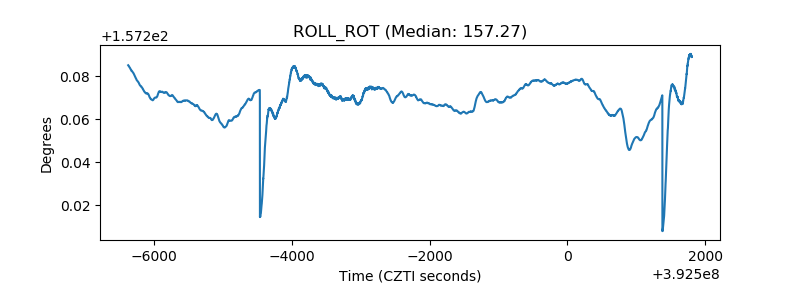 |
| _Roll_DEC | 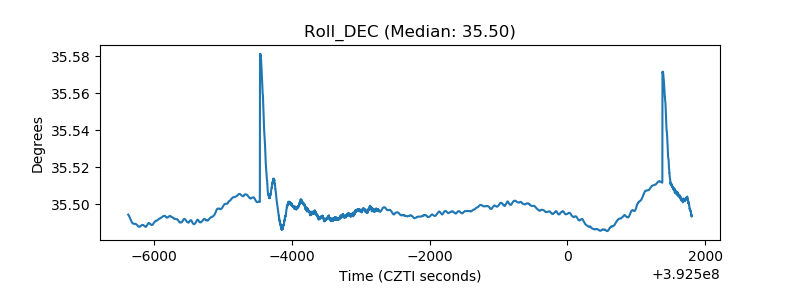 |
| _Roll_RA | 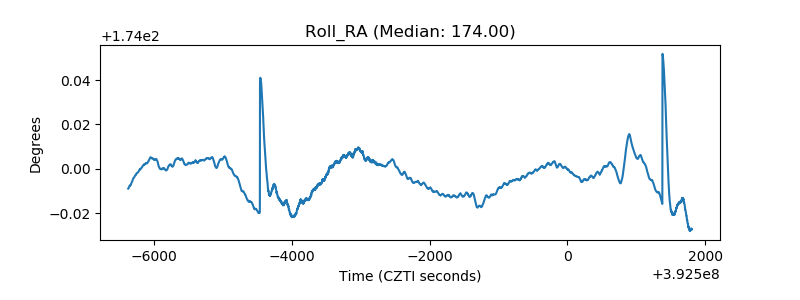 |
| Veto Counter | 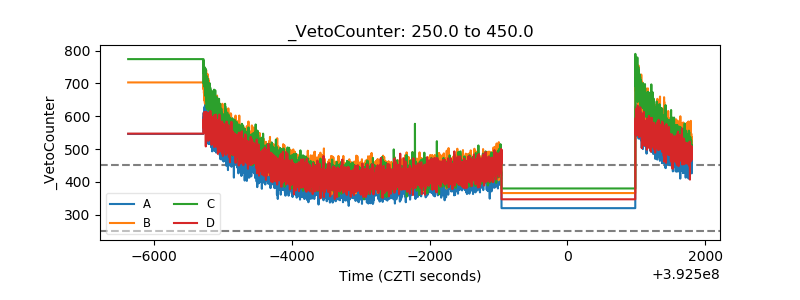 |