| Param | Original file | Final file |
|---|---|---|
| Filename | modeM0/AS1A11_080T02_9000005176_36209cztM0_level2.evt | modeM0/AS1A11_080T02_9000005176_36209cztM0_level2_quad_clean.evt |
| Size (bytes) | 767,433,600 | 82,177,920 |
| Size | 731.9 MB | 78.4 MB |
| Events in quadrant A | 3,230,537 | 575,171 |
| Events in quadrant B | 3,709,843 | 574,406 |
| Events in quadrant C | 11,956,893 | 365,808 |
| Events in quadrant D | 3,926,294 | 539,965 |
| Mode M9 | |||
|---|---|---|---|
| Quadrant | BADHDUFLAG | Total packets | Discarded packets |
| A | 0 | 27 | 0 |
| B | 0 | 27 | 0 |
| C | 0 | 27 | 0 |
| D | 0 | 27 | 0 |
| Mode M0 | |||
|---|---|---|---|
| Quadrant | BADHDUFLAG | Total packets | Discarded packets |
| A | 0 | 13597 | 3 |
| B | 0 | 14940 | 2 |
| C | 0 | 39666 | 2 |
| D | 0 | 15636 | 2 |
| Mode SS | |||
|---|---|---|---|
| Quadrant | BADHDUFLAG | Total packets | Discarded packets |
| A | 0 | 126 | 0 |
| B | 0 | 126 | 0 |
| C | 0 | 126 | 0 |
| D | 0 | 126 | 0 |
| Quadrant | Total seconds | Saturated seconds | Saturation percentage |
|---|---|---|---|
| A | 6191 | 6 | 0.096915% |
| B | 6191 | 159 | 2.568244% |
| C | 6191 | 3833 | 61.912454% |
| D | 6191 | 169 | 2.729769% |
Noise dominated data is calculated using 1-second bins in cleaned event files. If a bin has >2000 counts, and if more than 50% of those come from <1% of pixels, then it is considered to be noise-dominated and hence unusable.
| Quadrant | # 1 sec bins | Bins with >0 counts | Bins with >2000 counts | High rate bins dominated by noise | Noise dominated (total time) | Noise dominated (detector-on time) | Marked lightcurve |
|---|---|---|---|---|---|---|---|
| A | 8847 | 6193 | 2 | 2 | 0.02% | 0.03% | 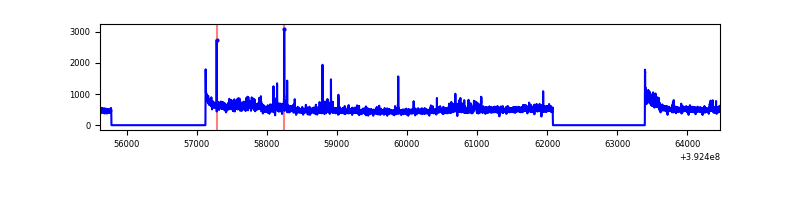 |
| B | 8847 | 6193 | 107 | 107 | 1.21% | 1.73% | 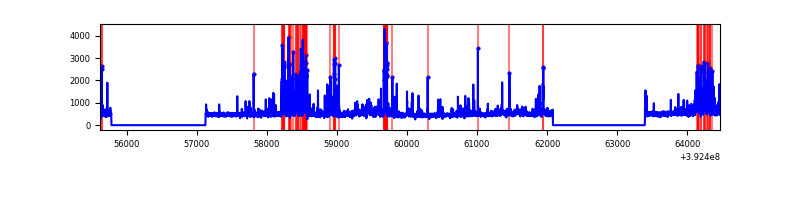 |
| C | 8847 | 6193 | 3420 | 3420 | 38.66% | 55.22% | 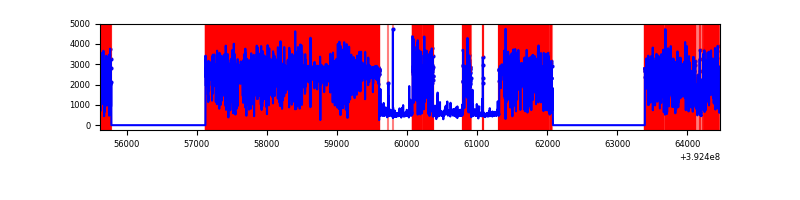 |
| D | 8847 | 6193 | 144 | 144 | 1.63% | 2.33% | 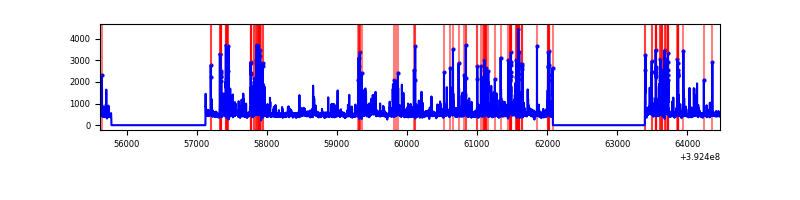 |
Top three noisy pixels from each quadrant. If the there are fewer than three noisy pixels in the level2.evt file, extra rows are filled as -1
| Pixel properties | Quadrant properties | ||||||
|---|---|---|---|---|---|---|---|
| Quadrant | DetID | PixID | Counts | Sigma | Mean | Median | Sigma |
| A | 15 | 223 | 234696 | 1628.33 | 709 | 695 | 143.7 |
| A | 10 | 83 | 201972 | 1400.62 | 709 | 695 | 143.7 |
| A | 9 | 143 | 33527 | 228.47 | 709 | 695 | 143.7 |
| B | 5 | 172 | 687652 | 5061.78 | 699 | 679 | 135.7 |
| B | 0 | 190 | 108750 | 796.29 | 699 | 679 | 135.7 |
| B | 0 | 213 | 64484 | 470.13 | 699 | 679 | 135.7 |
| C | 4 | 254 | 9475774 | 86387.62 | 466 | 470 | 109.7 |
| C | 1 | 23 | 237773 | 2163.52 | 466 | 470 | 109.7 |
| C | 15 | 214 | 195872 | 1781.51 | 466 | 470 | 109.7 |
| D | 12 | 6 | 589408 | 3480.11 | 685 | 664 | 169.2 |
| D | 12 | 235 | 170781 | 1005.57 | 685 | 664 | 169.2 |
| D | 2 | 250 | 143609 | 844.96 | 685 | 664 | 169.2 |
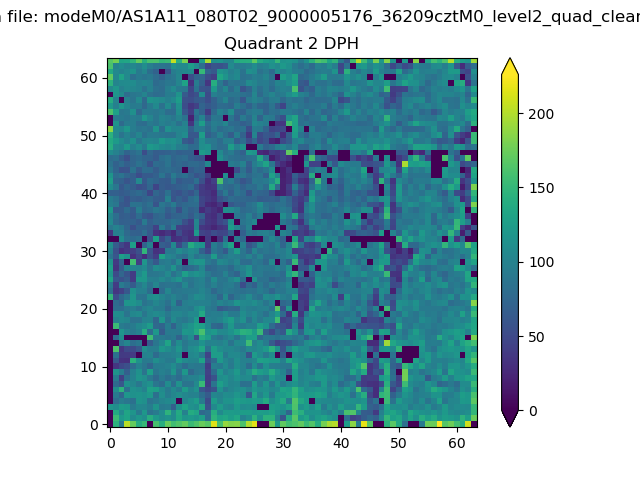
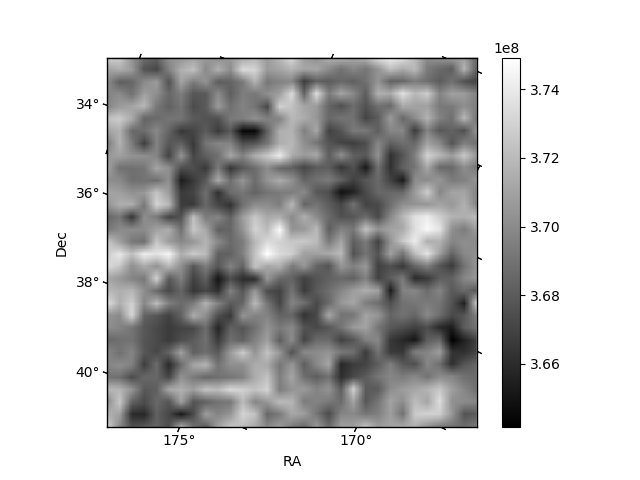
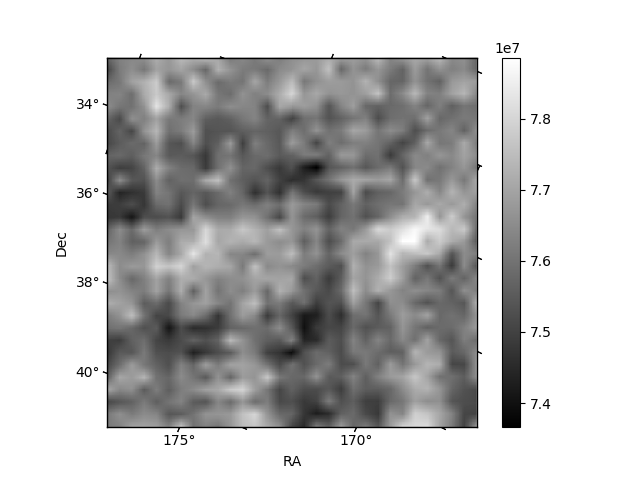
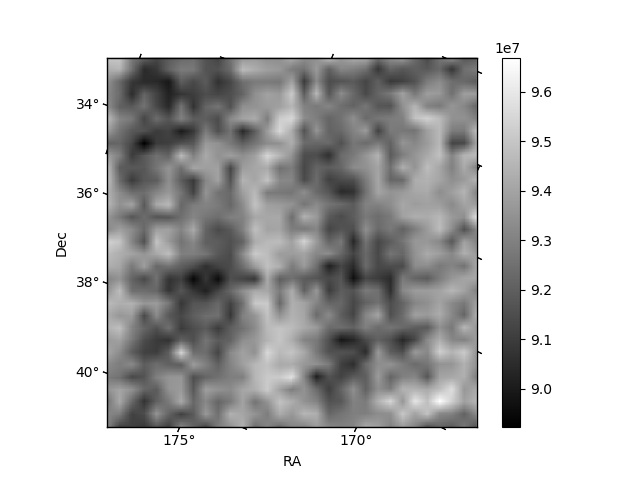
Histogram calculated using DETX and DETY for each event in the final _common_clean file
| Quadrant A | 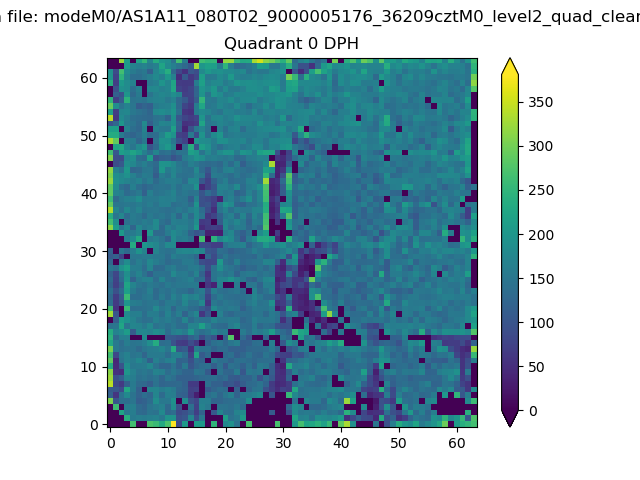 |
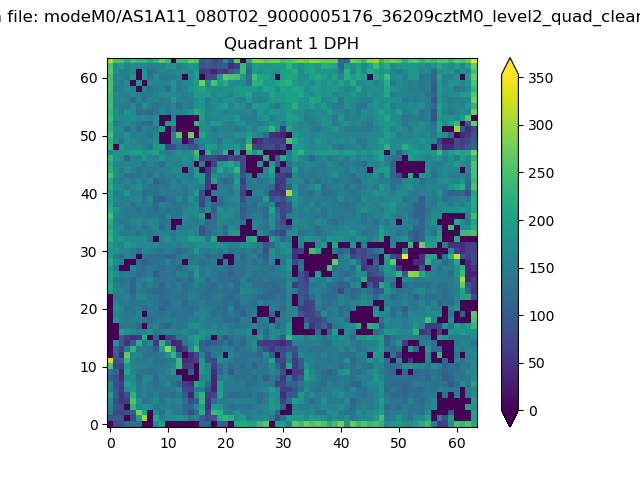 |
Quadrant B |
|---|---|---|---|
| Quadrant D | 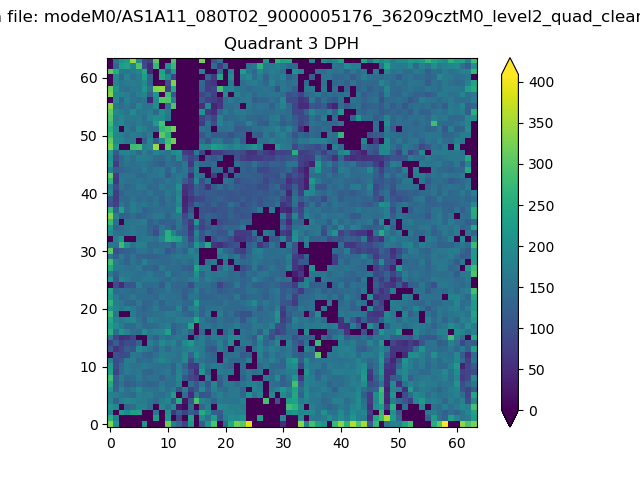 |
 |
Quadrant C |
| Plot type | Count rate plots | Images |
|---|---|---|
| Comparison with Poisson distribution Blue bars denote a histogram of data divided into 1 sec bins. Red curve is a Poisson curve with rate = median count rate of data. |
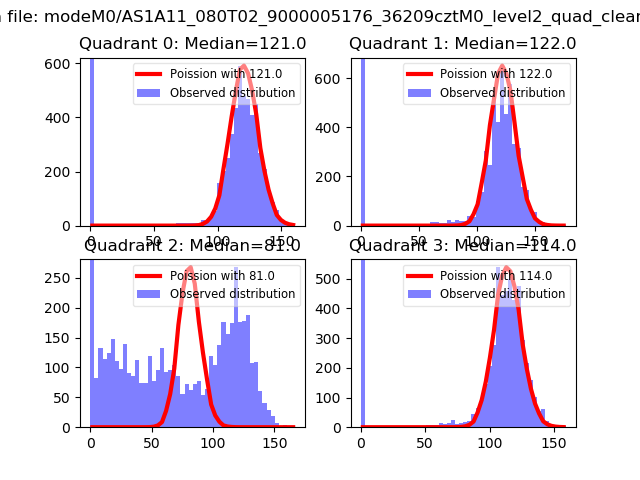 |
 |
| Quadrant-wise count rates Data is divided into 100 sec bins |
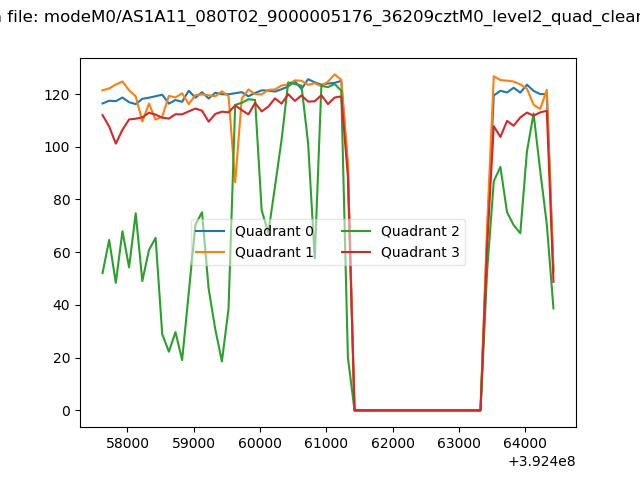 |
|
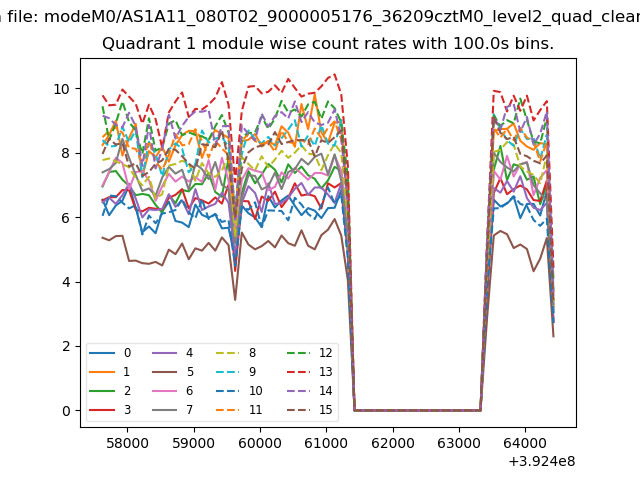
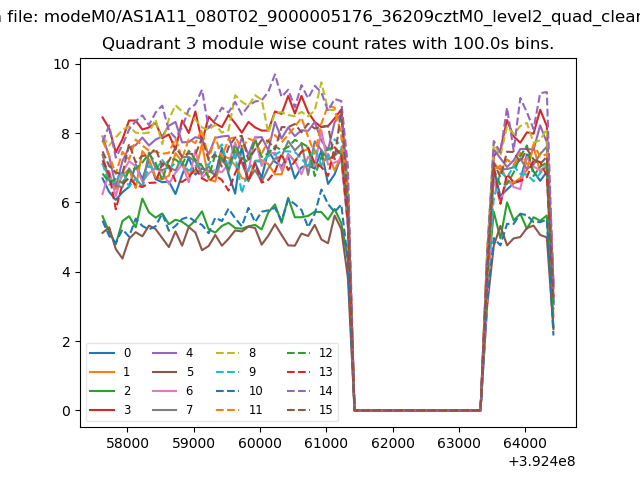
| Module-wise count rates for Quadrant A Data is divided into 100 sec bins |
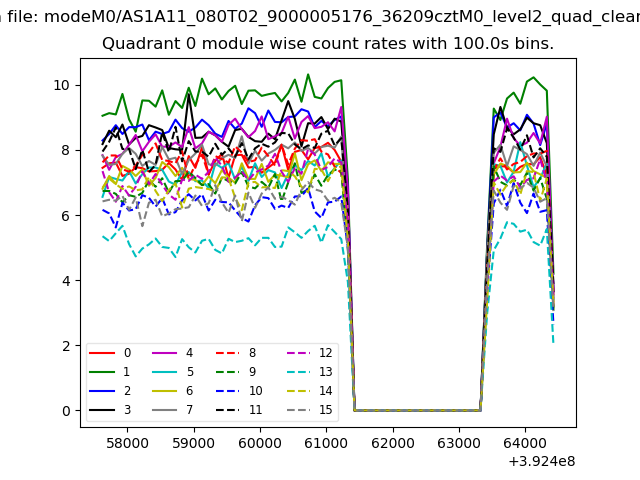 |
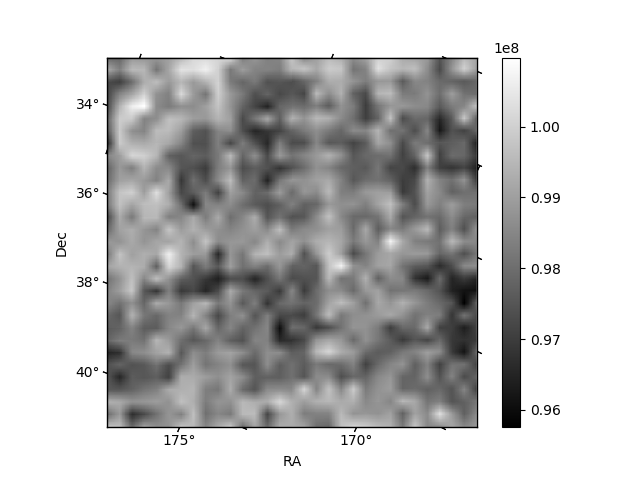 |
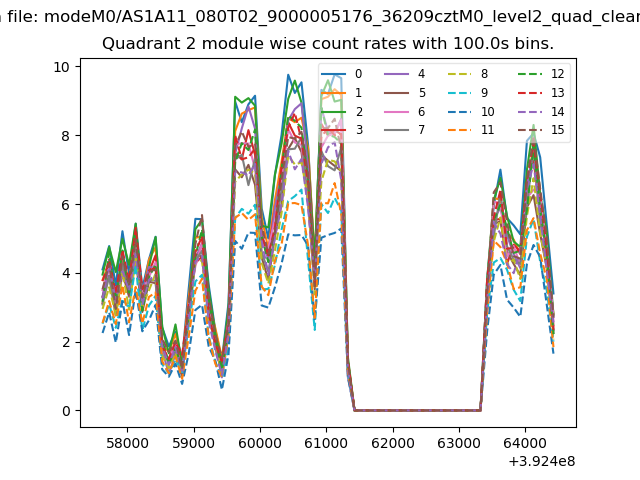
| Module-wise count rates for Quadrant B Data is divided into 100 sec bins |
 |
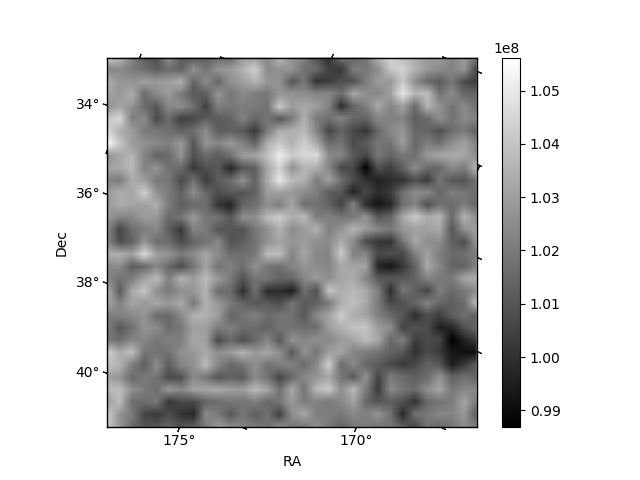 |
| Module-wise count rates for Quadrant C Data is divided into 100 sec bins |
 |
 |
| Module-wise count rates for Quadrant D Data is divided into 100 sec bins |
 |
 |
| Parameter | Plot |
|---|---|
| CZT HV Monitor | 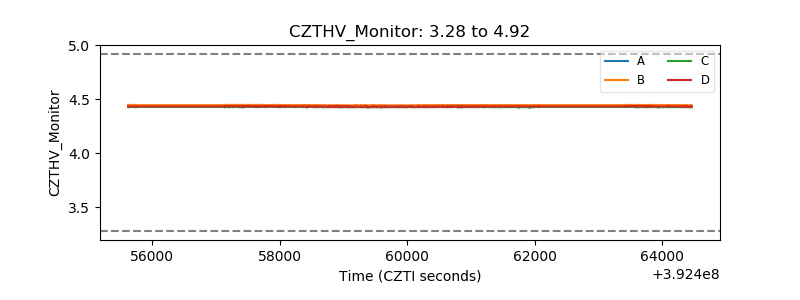 |
| D_VDD | 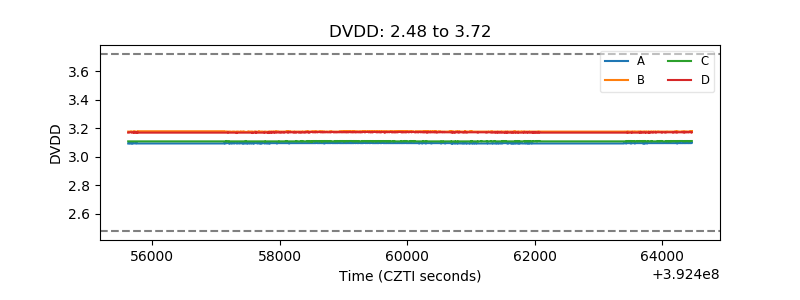 |
| Temperature 1 | 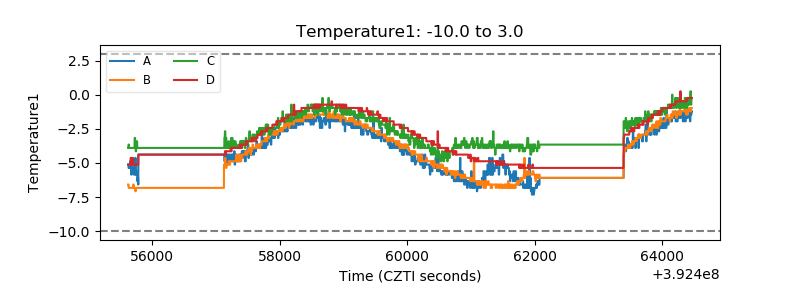 |
| Veto HV Monitor |  |
| Veto LLD | 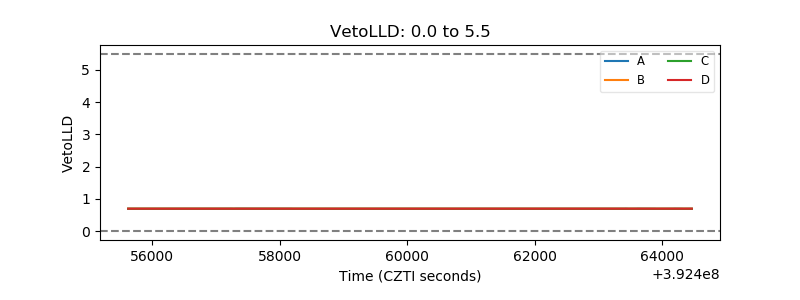 |
| Alpha Counter | 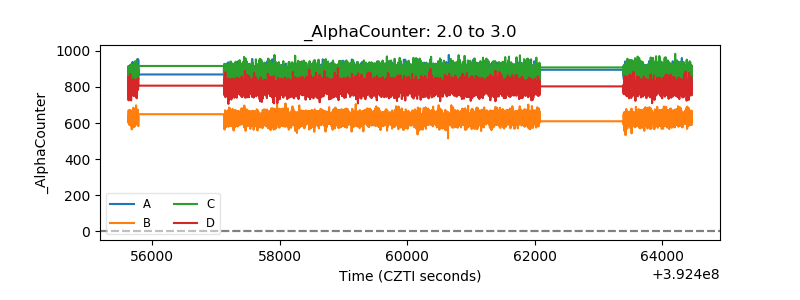 |
| _CPM_Rate | 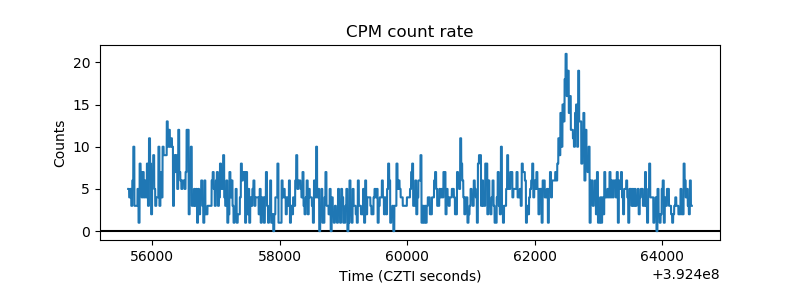 |
| CZT Counter | 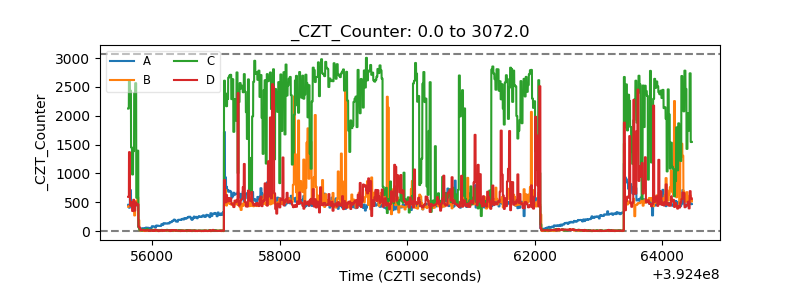 |
| +2.5 Volts monitor | 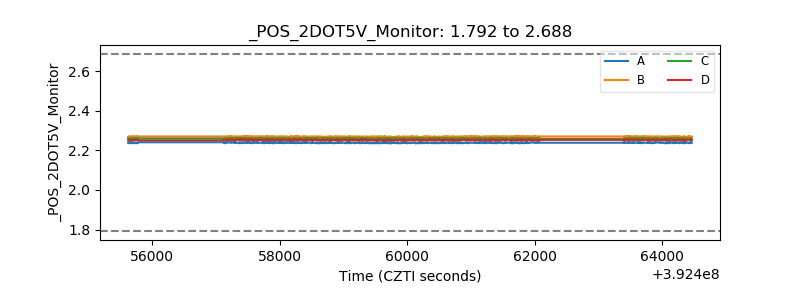 |
| +5 Volts monitor | 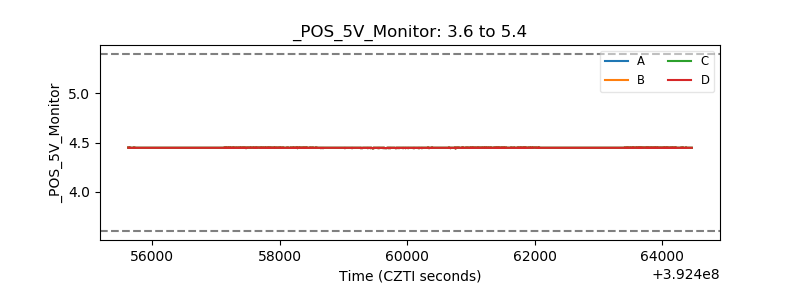 |
| _ROLL_ROT | 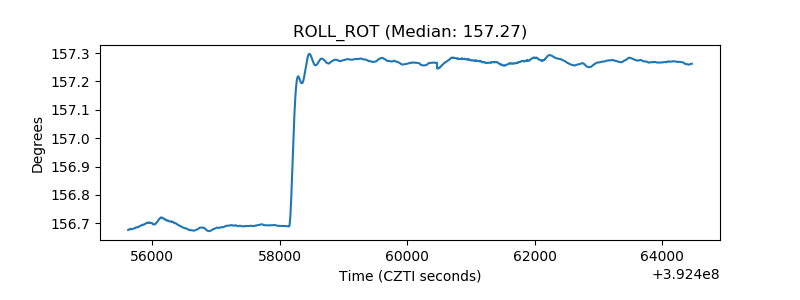 |
| _Roll_DEC | 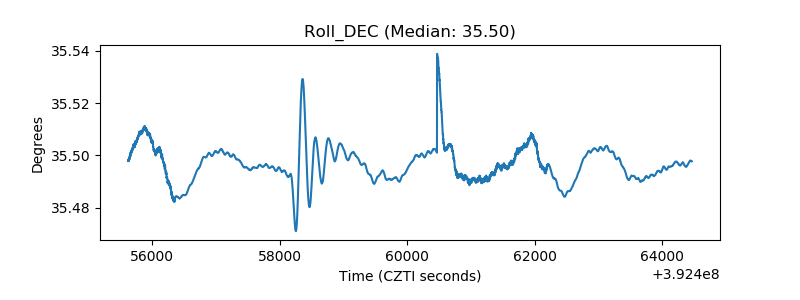 |
| _Roll_RA | 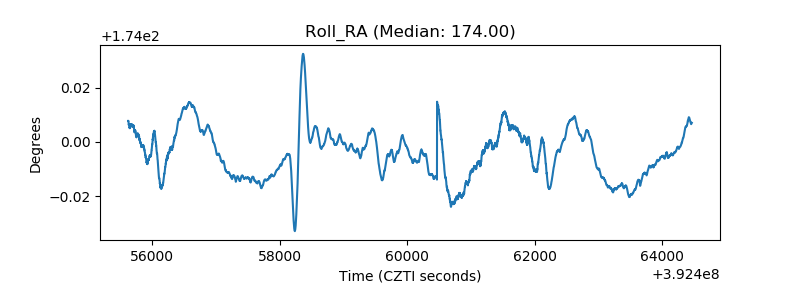 |
| Veto Counter | 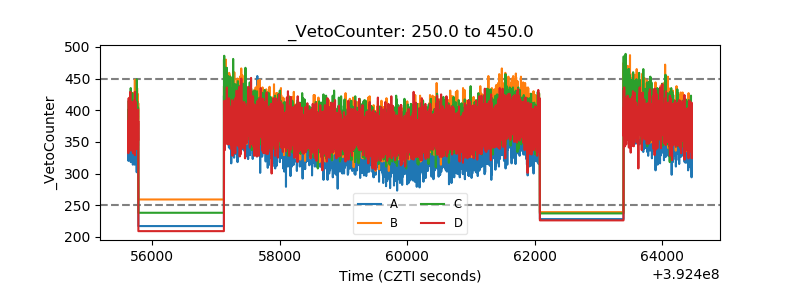 |