| Param | Original file | Final file |
|---|---|---|
| Filename | modeM0/AS1A11_080T02_9000005176_36204cztM0_level2.evt | modeM0/AS1A11_080T02_9000005176_36204cztM0_level2_quad_clean.evt |
| Size (bytes) | 169,519,680 | 15,399,360 |
| Size | 161.7 MB | 14.7 MB |
| Events in quadrant A | 1,040,420 | 85,193 |
| Events in quadrant B | 1,190,057 | 86,106 |
| Events in quadrant C | 1,557,585 | 79,367 |
| Events in quadrant D | 1,217,111 | 78,904 |
| Mode M9 | |||
|---|---|---|---|
| Quadrant | BADHDUFLAG | Total packets | Discarded packets |
| A | 0 | 22 | 0 |
| B | 0 | 22 | 0 |
| C | 0 | 22 | 0 |
| D | 0 | 22 | 0 |
| Mode M0 | |||
|---|---|---|---|
| Quadrant | BADHDUFLAG | Total packets | Discarded packets |
| A | 0 | 4194 | 2 |
| B | 0 | 4699 | 1 |
| C | 0 | 5811 | 1 |
| D | 0 | 4827 | 1 |
| Mode SS | |||
|---|---|---|---|
| Quadrant | BADHDUFLAG | Total packets | Discarded packets |
| A | 0 | 38 | 0 |
| B | 0 | 38 | 0 |
| C | 0 | 38 | 0 |
| D | 0 | 38 | 0 |
| Quadrant | Total seconds | Saturated seconds | Saturation percentage |
|---|---|---|---|
| A | 1865 | 5 | 0.268097% |
| B | 1865 | 44 | 2.359249% |
| C | 1865 | 136 | 7.292225% |
| D | 1865 | 51 | 2.734584% |
Noise dominated data is calculated using 1-second bins in cleaned event files. If a bin has >2000 counts, and if more than 50% of those come from <1% of pixels, then it is considered to be noise-dominated and hence unusable.
| Quadrant | # 1 sec bins | Bins with >0 counts | Bins with >2000 counts | High rate bins dominated by noise | Noise dominated (total time) | Noise dominated (detector-on time) | Marked lightcurve |
|---|---|---|---|---|---|---|---|
| A | 4018 | 1866 | 0 | 0 | 0.00% | 0.00% | 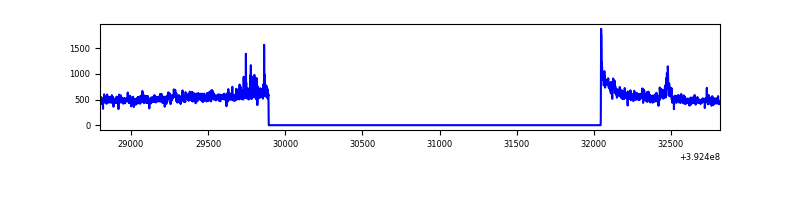 |
| B | 4018 | 1866 | 25 | 25 | 0.62% | 1.34% | 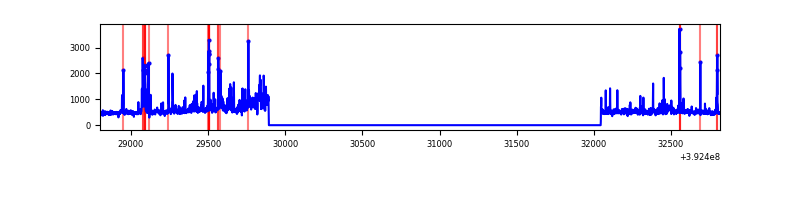 |
| C | 4018 | 1866 | 99 | 99 | 2.46% | 5.31% | 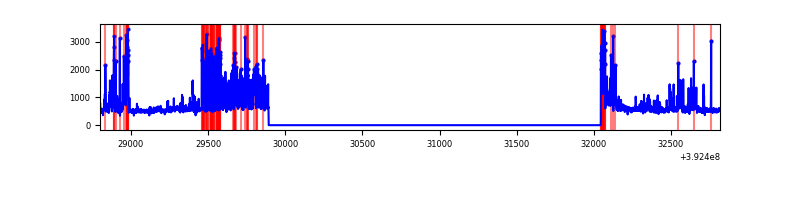 |
| D | 4018 | 1866 | 38 | 38 | 0.95% | 2.04% | 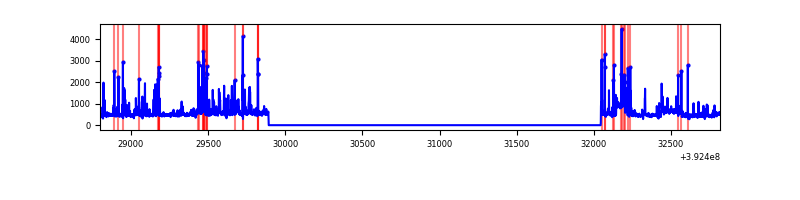 |
Top three noisy pixels from each quadrant. If the there are fewer than three noisy pixels in the level2.evt file, extra rows are filled as -1
| Pixel properties | Quadrant properties | ||||||
|---|---|---|---|---|---|---|---|
| Quadrant | DetID | PixID | Counts | Sigma | Mean | Median | Sigma |
| A | 10 | 83 | 77679 | 1628.15 | 228 | 223 | 47.6 |
| A | 8 | 144 | 28494 | 594.26 | 228 | 223 | 47.6 |
| A | 15 | 223 | 28292 | 590.02 | 228 | 223 | 47.6 |
| B | 5 | 172 | 177186 | 3901.68 | 226 | 220 | 45.4 |
| B | 0 | 190 | 53367 | 1171.77 | 226 | 220 | 45.4 |
| B | 15 | 32 | 23892 | 521.91 | 226 | 220 | 45.4 |
| C | 4 | 254 | 493363 | 9441.52 | 218 | 220 | 52.2 |
| C | 0 | 10 | 86494 | 1651.77 | 218 | 220 | 52.2 |
| C | 15 | 214 | 84689 | 1617.21 | 218 | 220 | 52.2 |
| D | 13 | 249 | 91672 | 1638.79 | 219 | 213 | 55.8 |
| D | 12 | 6 | 54656 | 975.53 | 219 | 213 | 55.8 |
| D | 2 | 153 | 54554 | 973.7 | 219 | 213 | 55.8 |
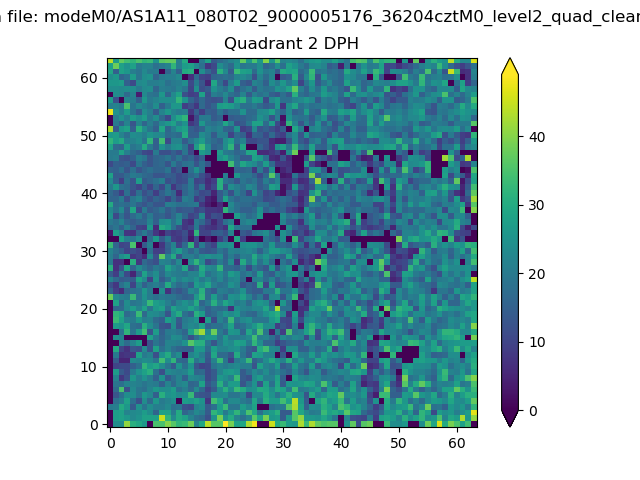
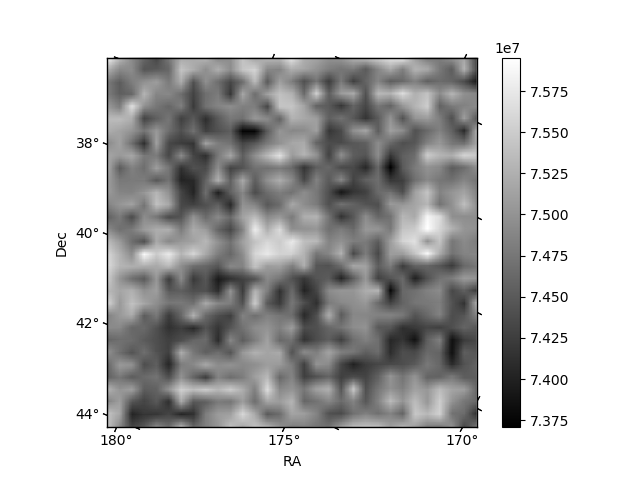
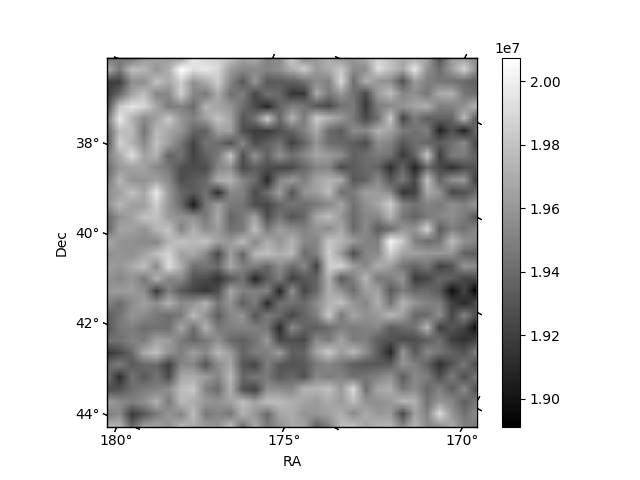
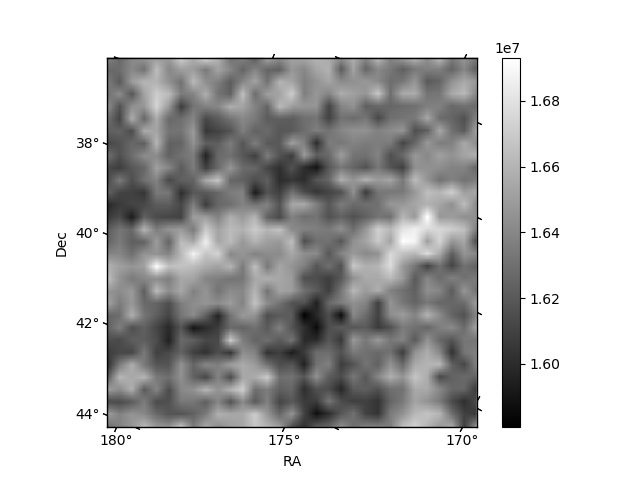
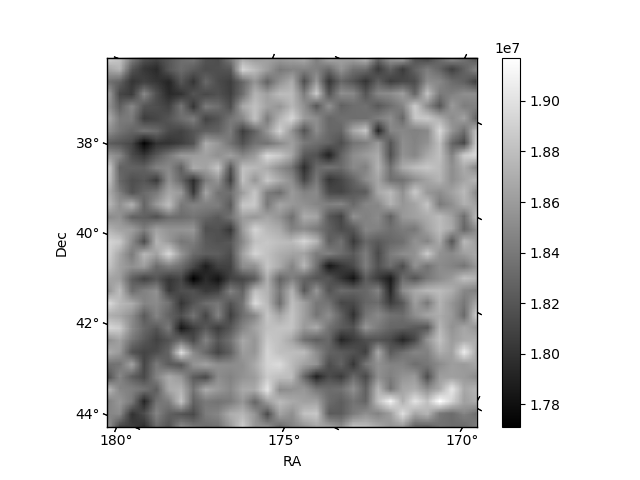
Histogram calculated using DETX and DETY for each event in the final _common_clean file
| Quadrant A | 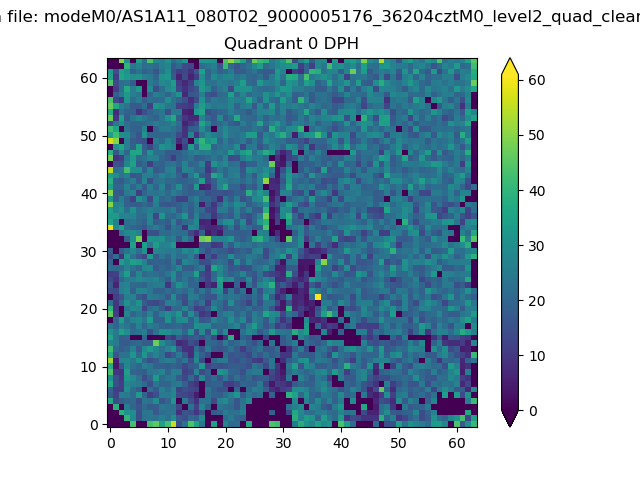 |
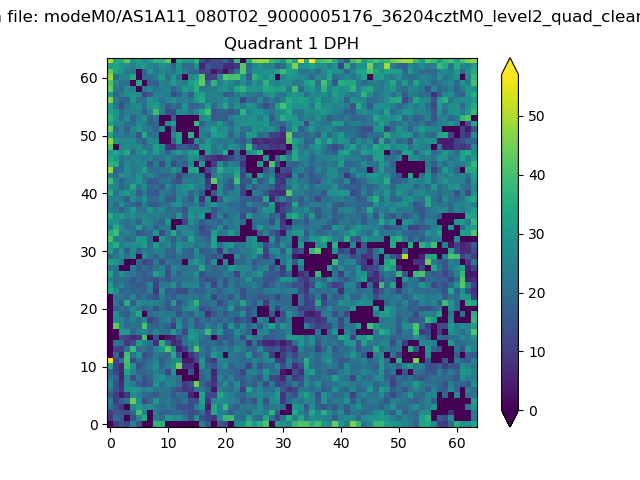 |
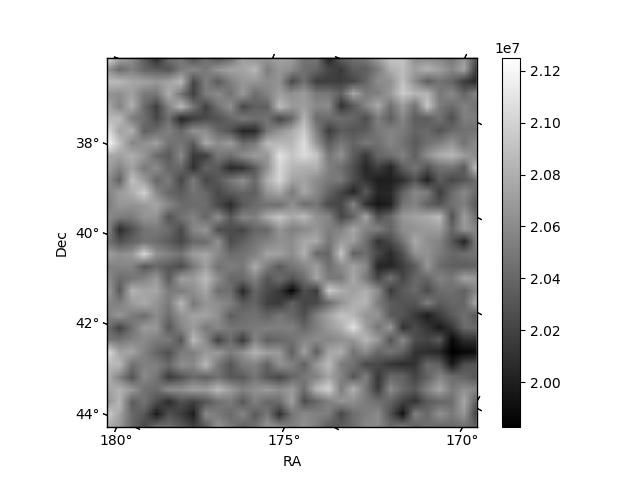
Quadrant B |
|---|---|---|---|
| Quadrant D | 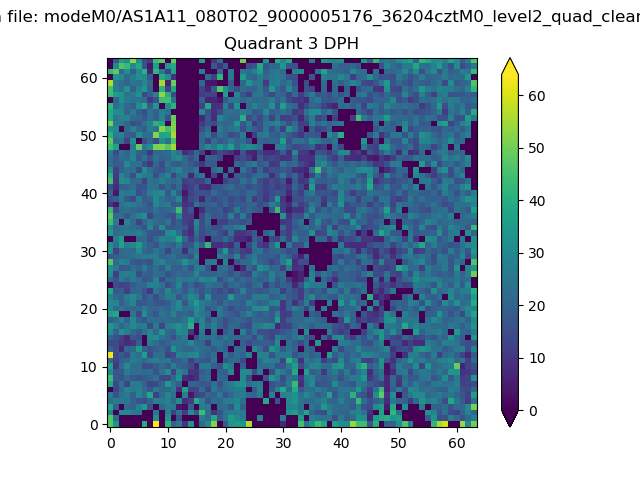 |
 |
Quadrant C |
| Plot type | Count rate plots | Images |
|---|---|---|
| Comparison with Poisson distribution Blue bars denote a histogram of data divided into 1 sec bins. Red curve is a Poisson curve with rate = median count rate of data. |
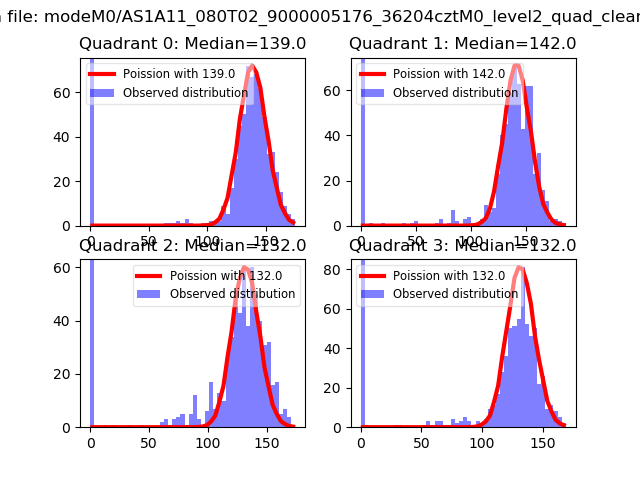 |
 |
| Quadrant-wise count rates Data is divided into 100 sec bins |
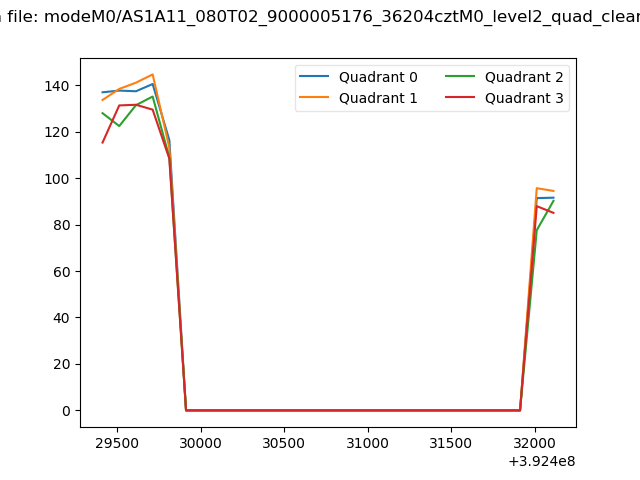 |
|
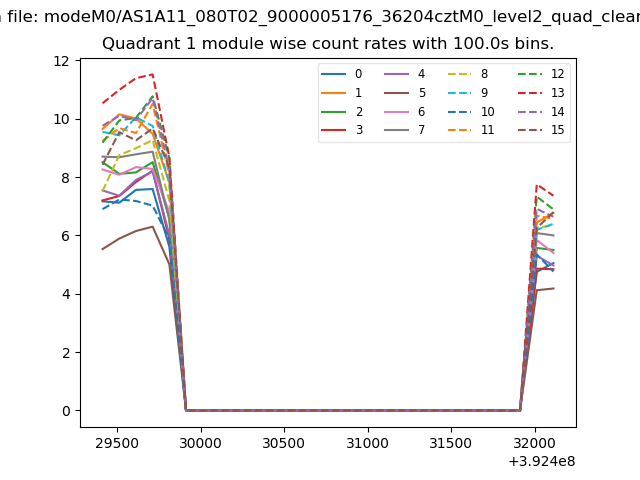
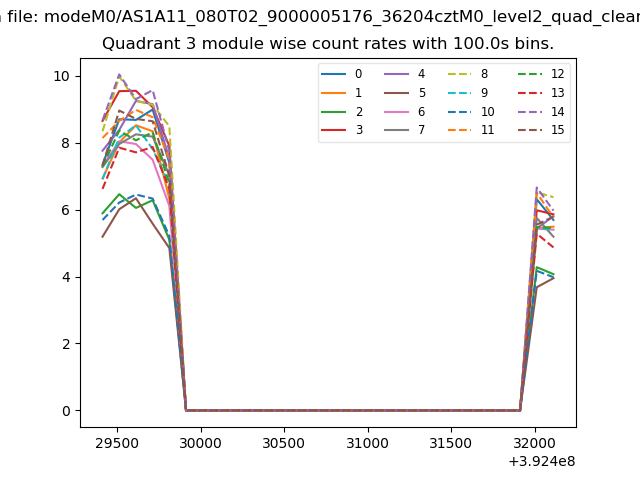
| Module-wise count rates for Quadrant A Data is divided into 100 sec bins |
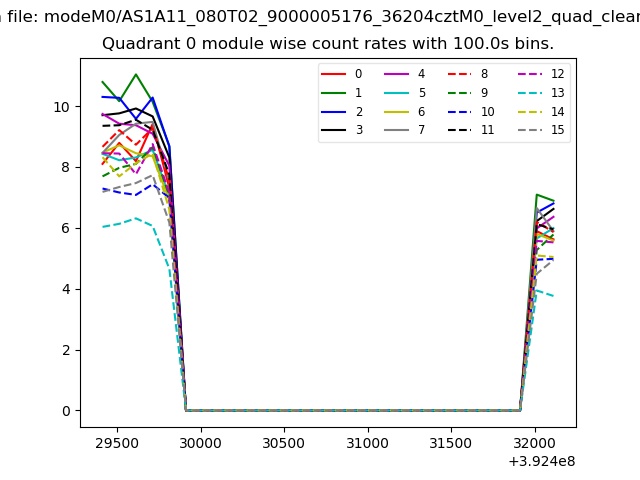 |
 |
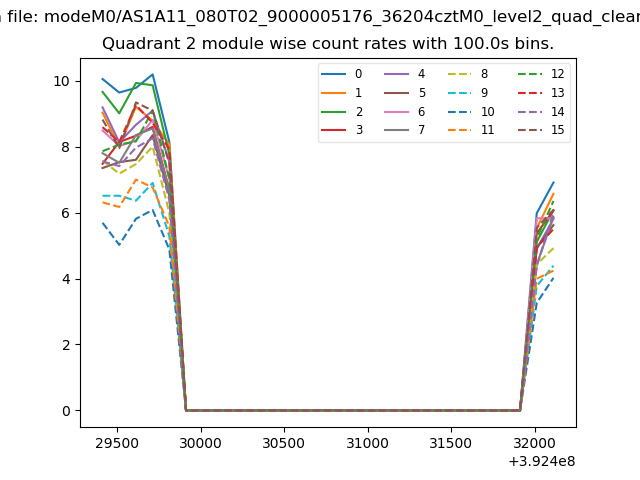
| Module-wise count rates for Quadrant B Data is divided into 100 sec bins |
 |
 |
| Module-wise count rates for Quadrant C Data is divided into 100 sec bins |
 |
 |
| Module-wise count rates for Quadrant D Data is divided into 100 sec bins |
 |
 |
| Parameter | Plot |
|---|---|
| CZT HV Monitor | 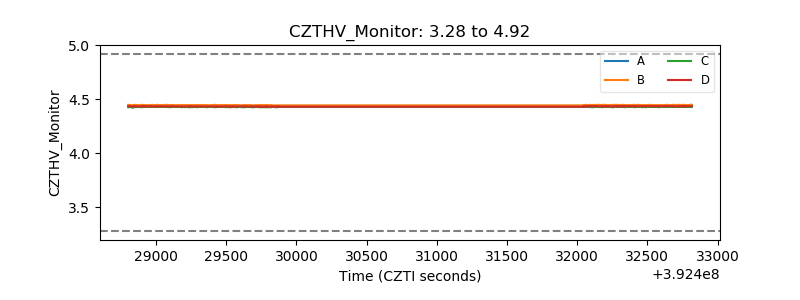 |
| D_VDD | 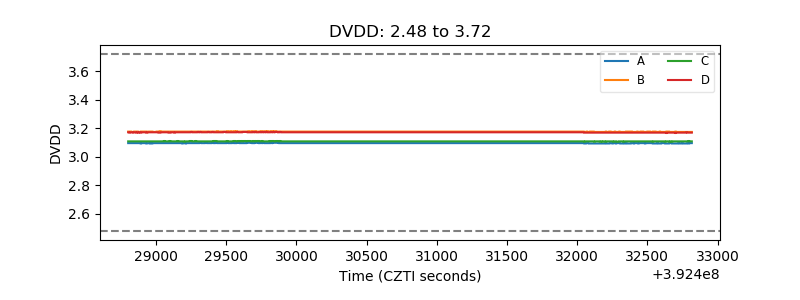 |
| Temperature 1 | 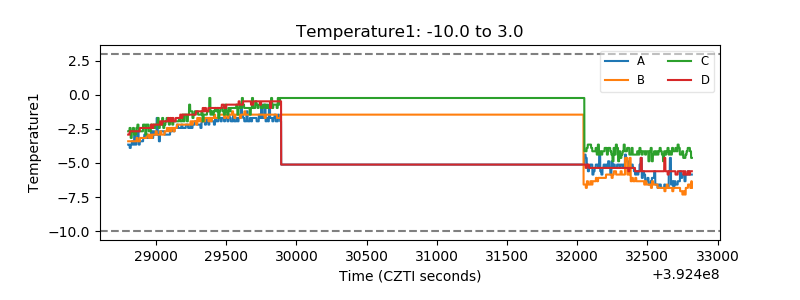 |
| Veto HV Monitor | 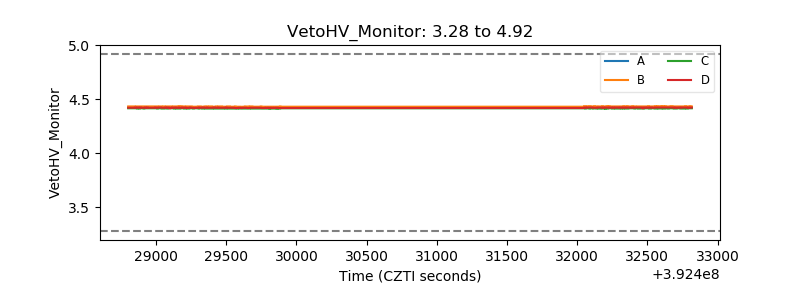 |
| Veto LLD | 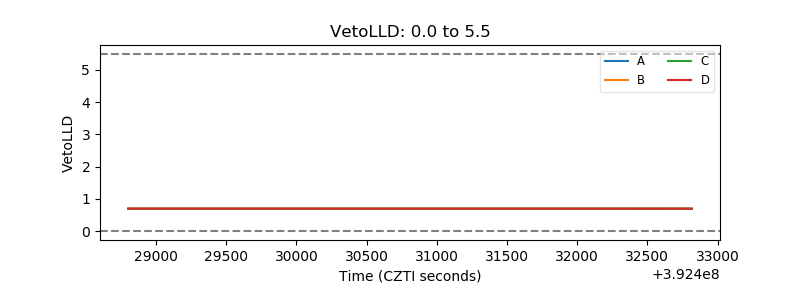 |
| Alpha Counter | 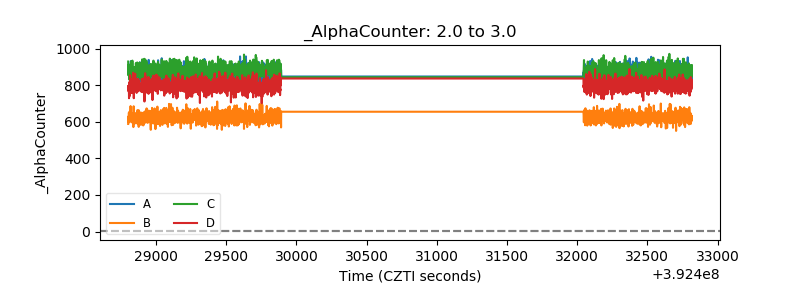 |
| _CPM_Rate | 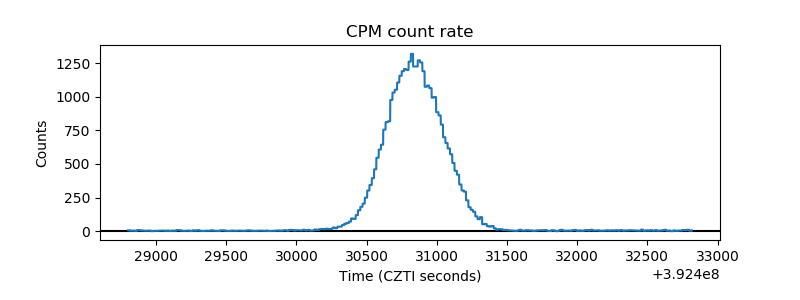 |
| CZT Counter | 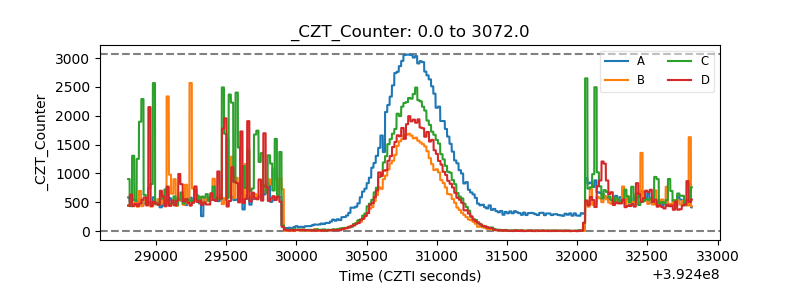 |
| +2.5 Volts monitor | 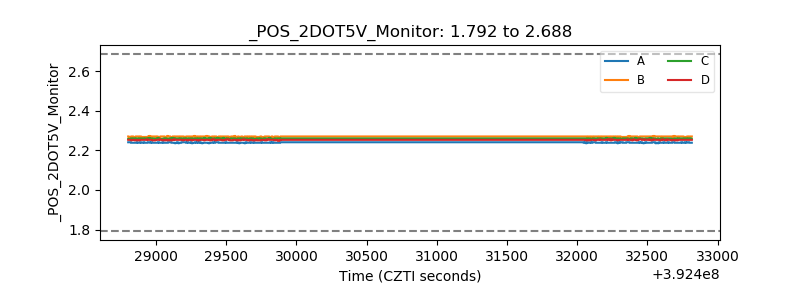 |
| +5 Volts monitor | 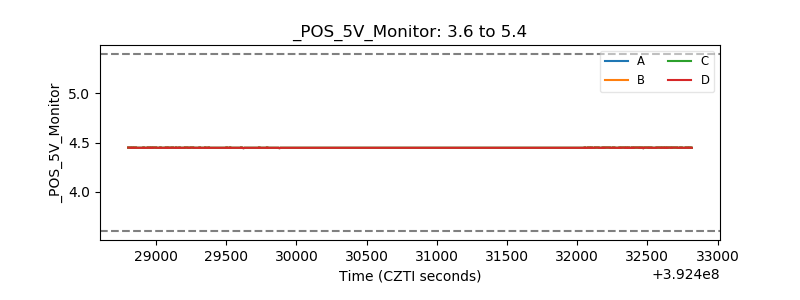 |
| _ROLL_ROT | 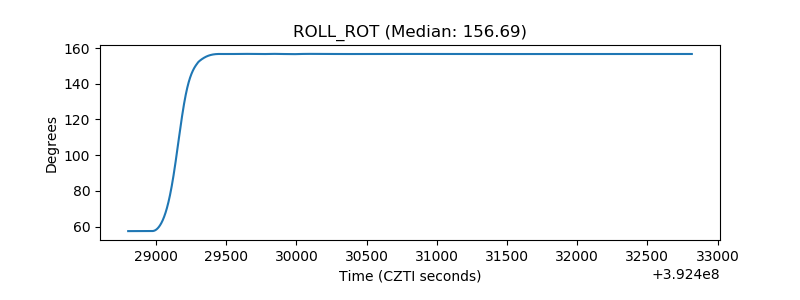 |
| _Roll_DEC | 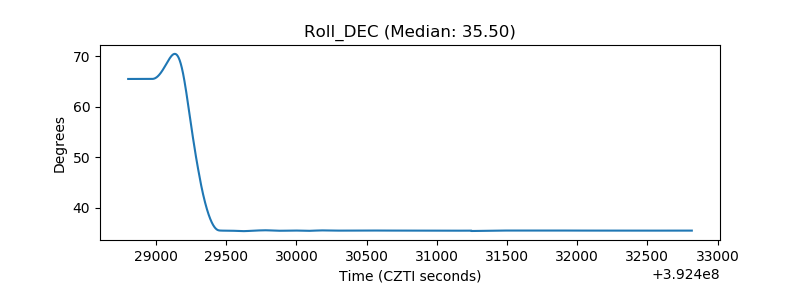 |
| _Roll_RA | 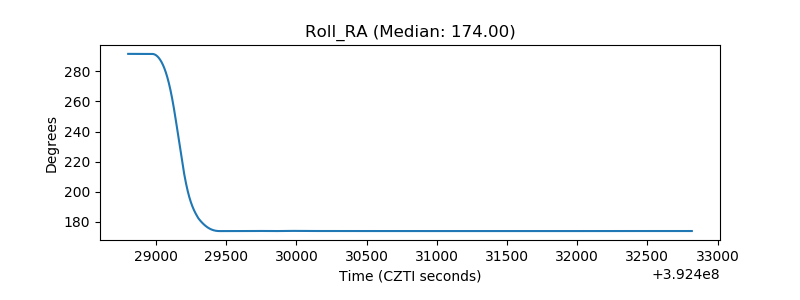 |
| Veto Counter | 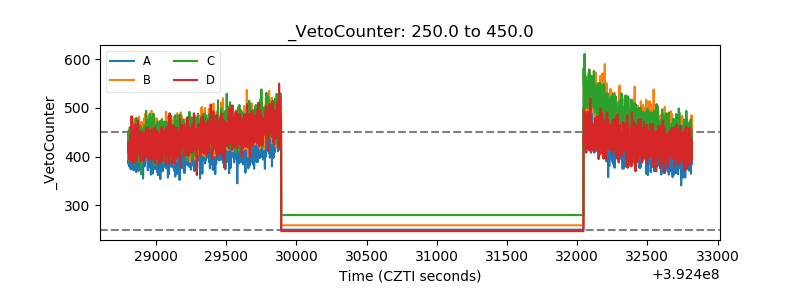 |