| Param | Original file | Final file |
|---|---|---|
| Filename | modeM0/AS1T05_009T04_9000005174_36203cztM0_level2.evt | modeM0/AS1T05_009T04_9000005174_36203cztM0_level2_quad_clean.evt |
| Size (bytes) | 127,595,520 | 17,939,520 |
| Size | 121.7 MB | 17.1 MB |
| Events in quadrant A | 771,576 | 110,823 |
| Events in quadrant B | 936,669 | 114,335 |
| Events in quadrant C | 869,189 | 113,991 |
| Events in quadrant D | 1,191,295 | 101,288 |
| Mode SS | |||
|---|---|---|---|
| Quadrant | BADHDUFLAG | Total packets | Discarded packets |
| A | 0 | 30 | 0 |
| B | 0 | 30 | 0 |
| C | 0 | 30 | 0 |
| D | 0 | 30 | 0 |
| Mode M9 | |||
|---|---|---|---|
| Quadrant | BADHDUFLAG | Total packets | Discarded packets |
| A | 0 | 21 | 0 |
| B | 0 | 21 | 0 |
| C | 0 | 21 | 0 |
| D | 0 | 21 | 0 |
| Mode M0 | |||
|---|---|---|---|
| Quadrant | BADHDUFLAG | Total packets | Discarded packets |
| A | 0 | 3081 | 2 |
| B | 0 | 3690 | 1 |
| C | 0 | 3455 | 1 |
| D | 0 | 4455 | 1 |
| Quadrant | Total seconds | Saturated seconds | Saturation percentage |
|---|---|---|---|
| A | 1366 | 7 | 0.512445% |
| B | 1366 | 49 | 3.587116% |
| C | 1366 | 18 | 1.317716% |
| D | 1366 | 101 | 7.393851% |
Noise dominated data is calculated using 1-second bins in cleaned event files. If a bin has >2000 counts, and if more than 50% of those come from <1% of pixels, then it is considered to be noise-dominated and hence unusable.
| Quadrant | # 1 sec bins | Bins with >0 counts | Bins with >2000 counts | High rate bins dominated by noise | Noise dominated (total time) | Noise dominated (detector-on time) | Marked lightcurve |
|---|---|---|---|---|---|---|---|
| A | 3459 | 1367 | 3 | 3 | 0.09% | 0.22% | 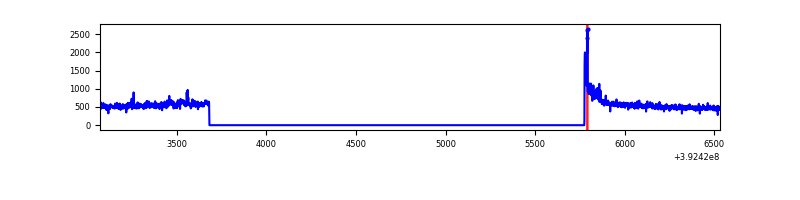 |
| B | 3459 | 1367 | 19 | 19 | 0.55% | 1.39% | 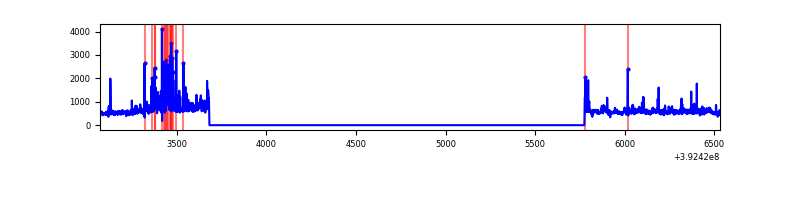 |
| C | 3459 | 1367 | 12 | 12 | 0.35% | 0.88% | 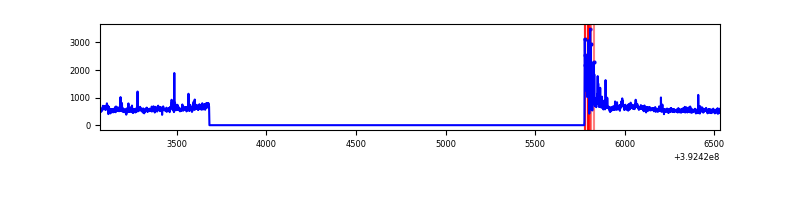 |
| D | 3459 | 1367 | 106 | 106 | 3.06% | 7.75% | 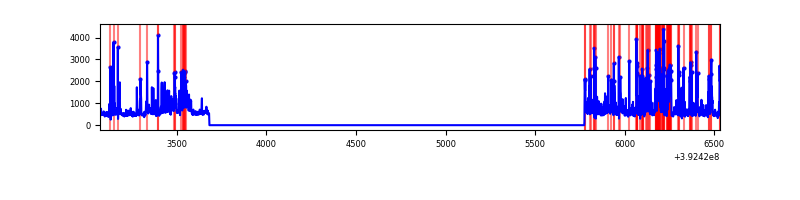 |
Top three noisy pixels from each quadrant. If the there are fewer than three noisy pixels in the level2.evt file, extra rows are filled as -1
| Pixel properties | Quadrant properties | ||||||
|---|---|---|---|---|---|---|---|
| Quadrant | DetID | PixID | Counts | Sigma | Mean | Median | Sigma |
| A | 10 | 83 | 66116 | 1830.87 | 171 | 168 | 36.0 |
| A | 15 | 223 | 20915 | 575.98 | 171 | 168 | 36.0 |
| A | 8 | 144 | 16692 | 458.74 | 171 | 168 | 36.0 |
| B | 0 | 190 | 104669 | 3104.75 | 171 | 166 | 33.7 |
| B | 5 | 172 | 91971 | 2727.5 | 171 | 166 | 33.7 |
| B | 0 | 213 | 41356 | 1223.74 | 171 | 166 | 33.7 |
| C | 0 | 10 | 71123 | 1759.57 | 168 | 169 | 40.3 |
| C | 15 | 214 | 65427 | 1618.32 | 168 | 169 | 40.3 |
| C | 4 | 254 | 41329 | 1020.72 | 168 | 169 | 40.3 |
| D | 12 | 6 | 291705 | 7072.91 | 162 | 158 | 41.2 |
| D | 12 | 227 | 72225 | 1748.34 | 162 | 158 | 41.2 |
| D | 2 | 153 | 69385 | 1679.44 | 162 | 158 | 41.2 |
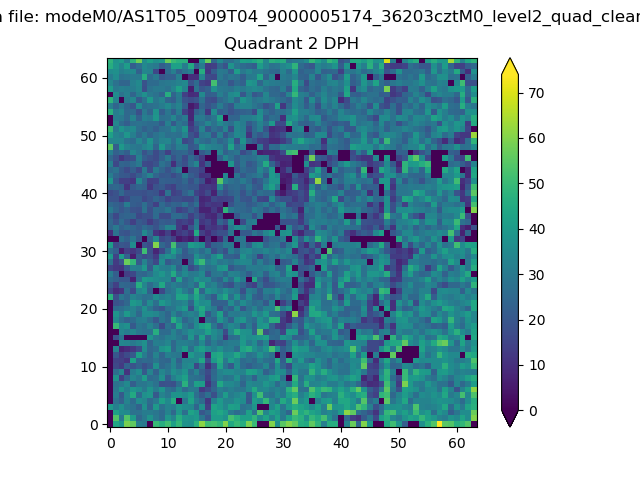
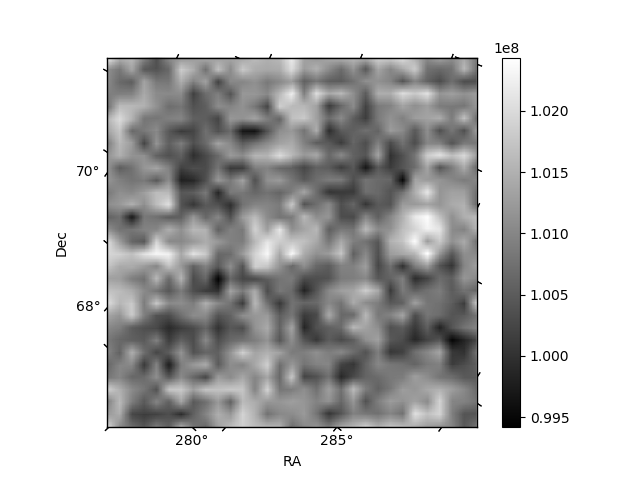
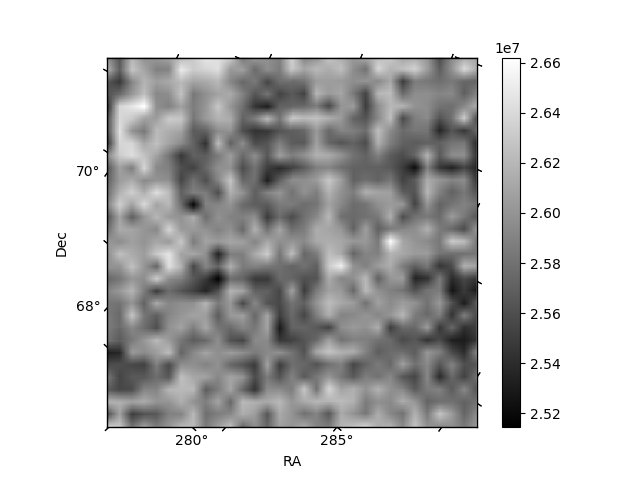
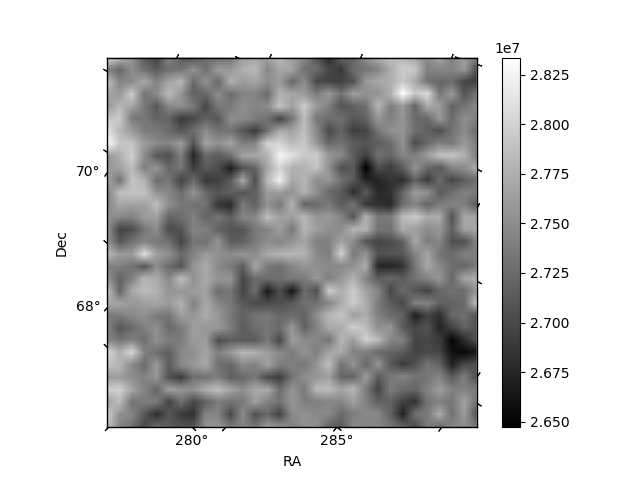
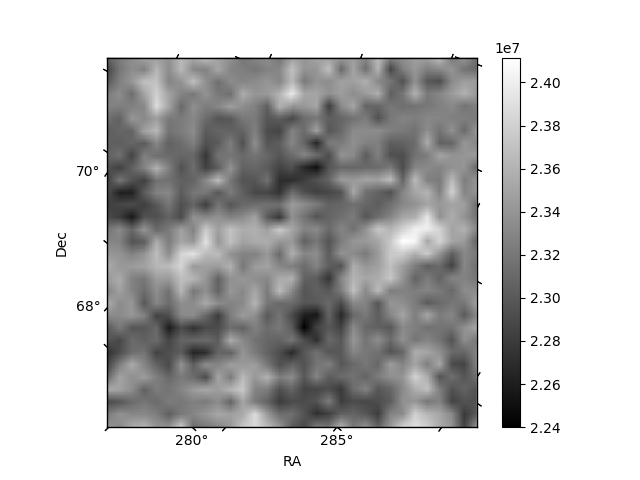
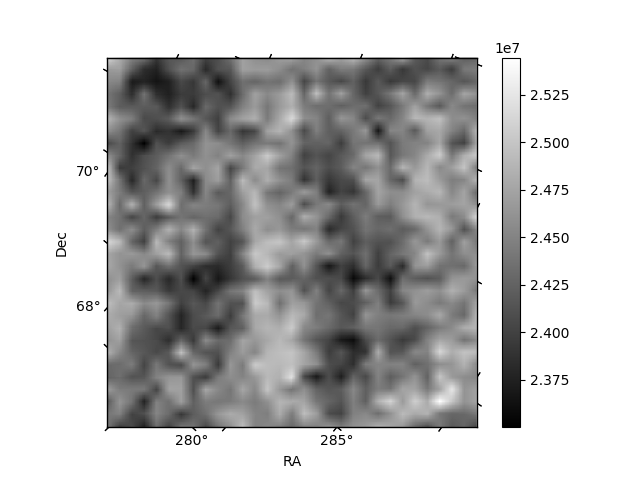
Histogram calculated using DETX and DETY for each event in the final _common_clean file
| Quadrant A | 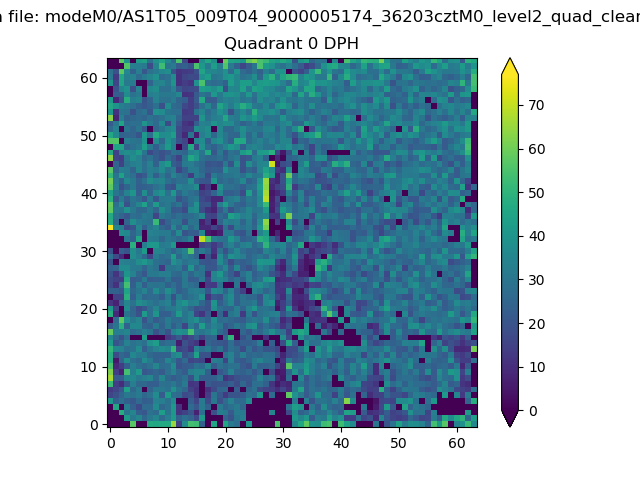 |
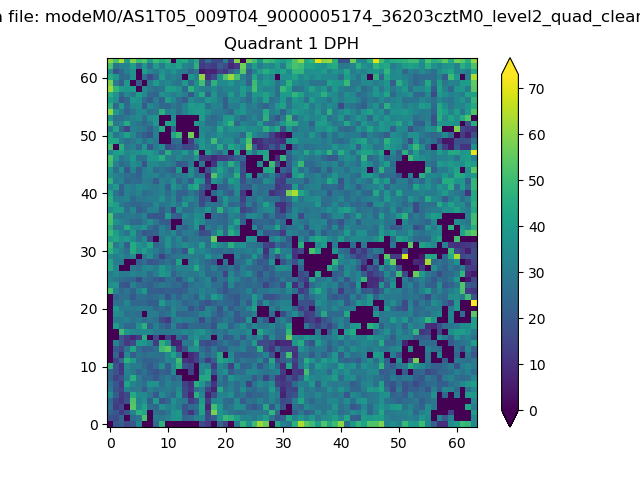 |
Quadrant B |
|---|---|---|---|
| Quadrant D | 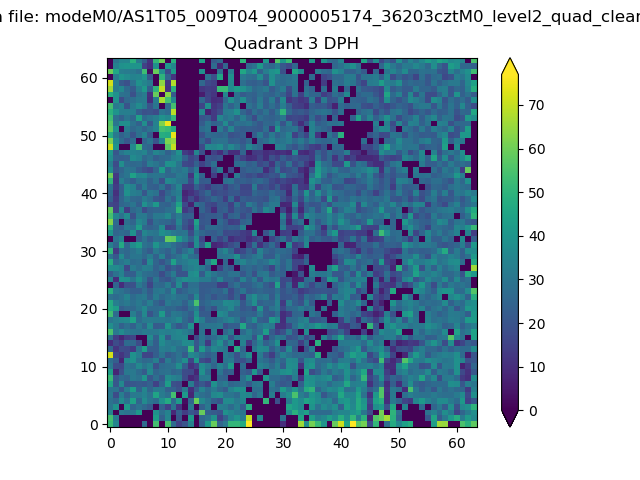 |
 |
Quadrant C |
| Plot type | Count rate plots | Images |
|---|---|---|
| Comparison with Poisson distribution Blue bars denote a histogram of data divided into 1 sec bins. Red curve is a Poisson curve with rate = median count rate of data. |
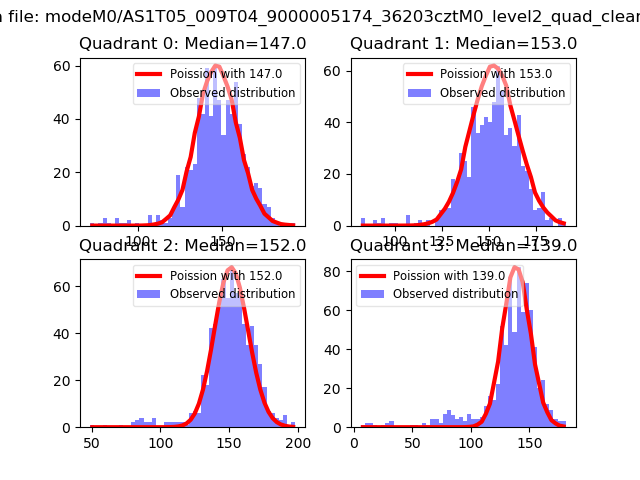 |
 |
| Quadrant-wise count rates Data is divided into 100 sec bins |
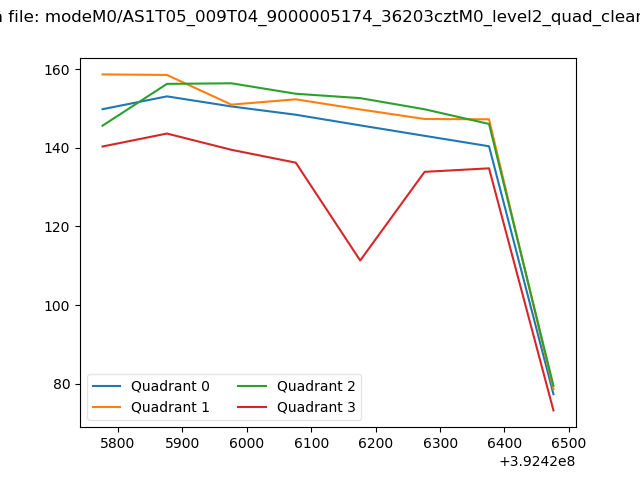 |
|
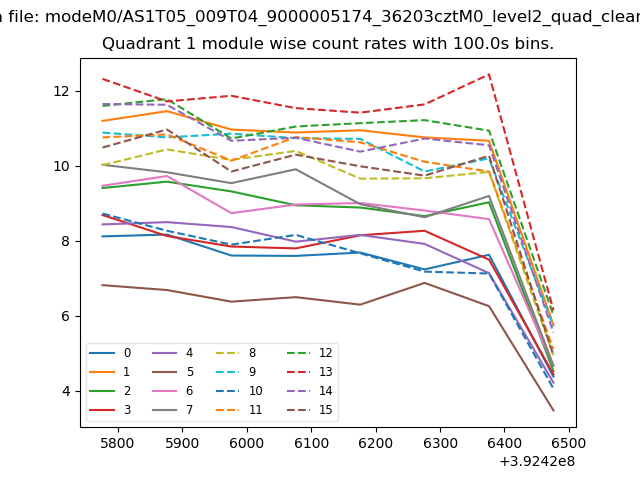
| Module-wise count rates for Quadrant A Data is divided into 100 sec bins |
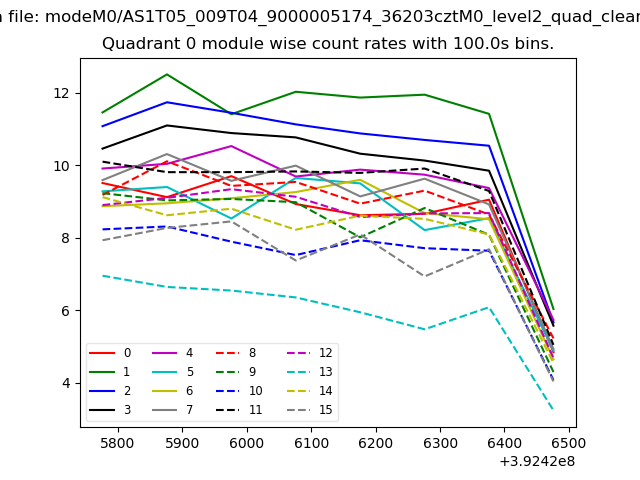 |
 |
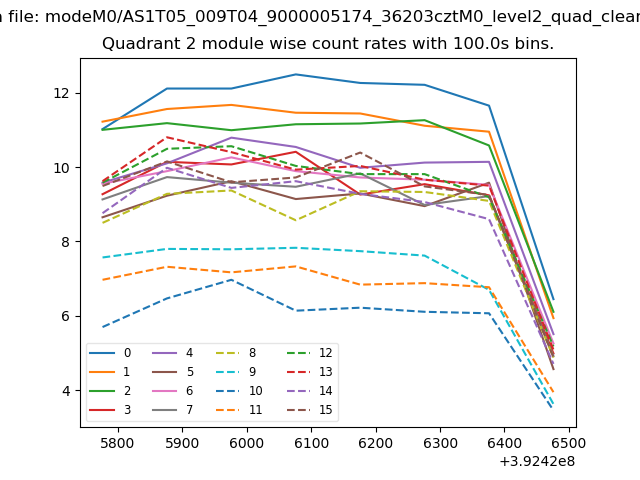
| Module-wise count rates for Quadrant B Data is divided into 100 sec bins |
 |
 |
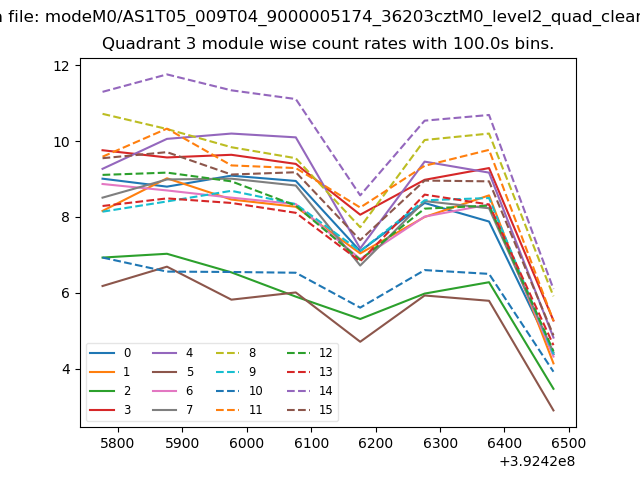
| Module-wise count rates for Quadrant C Data is divided into 100 sec bins |
 |
 |
| Module-wise count rates for Quadrant D Data is divided into 100 sec bins |
 |
 |
| Parameter | Plot |
|---|---|
| CZT HV Monitor |  |
| D_VDD | 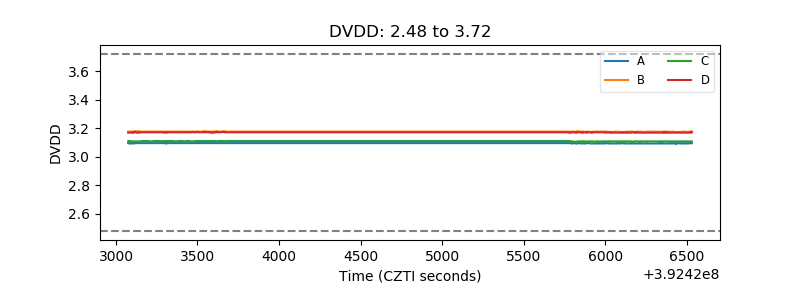 |
| Temperature 1 | 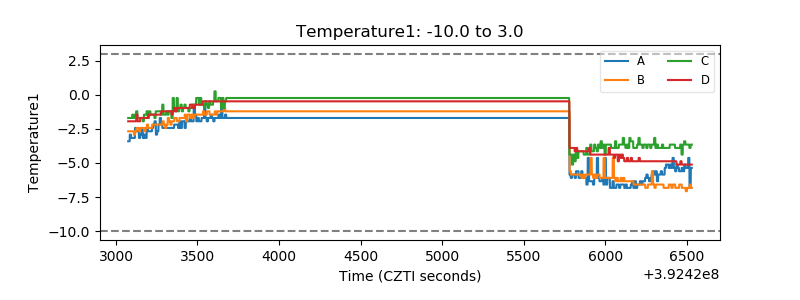 |
| Veto HV Monitor | 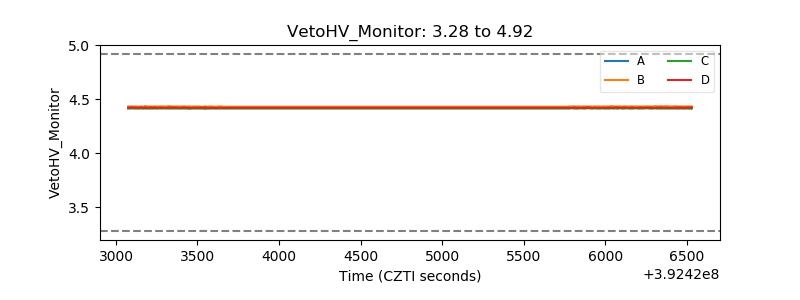 |
| Veto LLD | 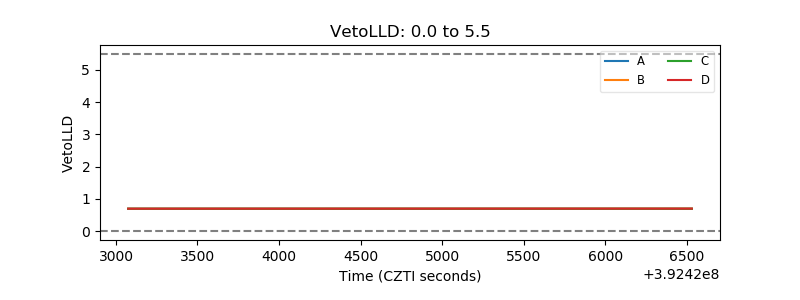 |
| Alpha Counter | 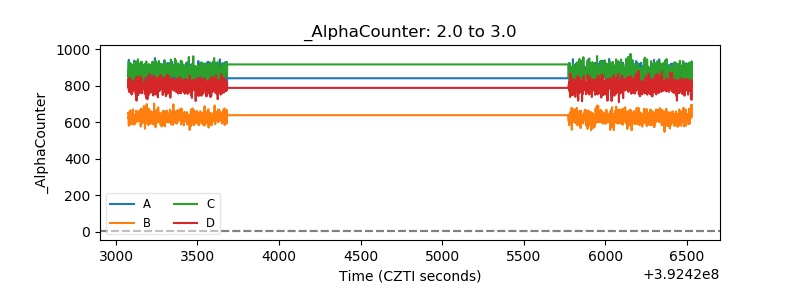 |
| _CPM_Rate | 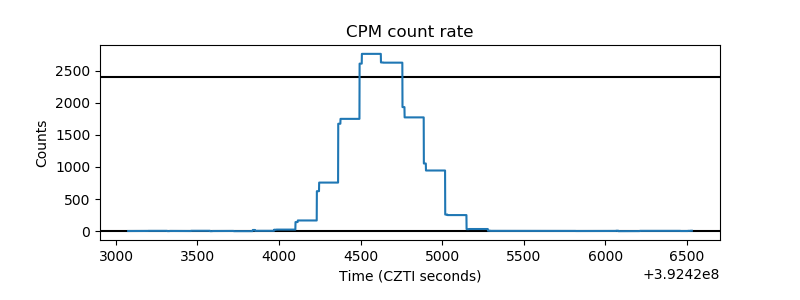 |
| CZT Counter | 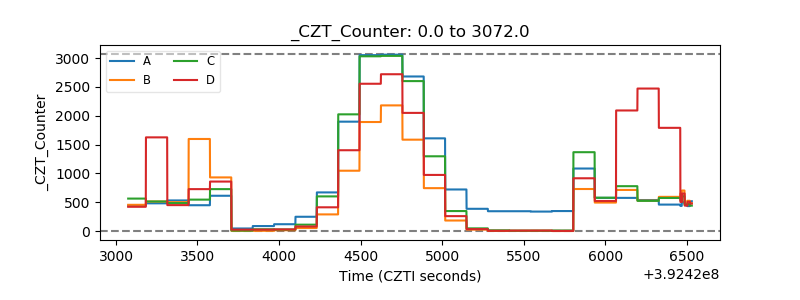 |
| +2.5 Volts monitor | 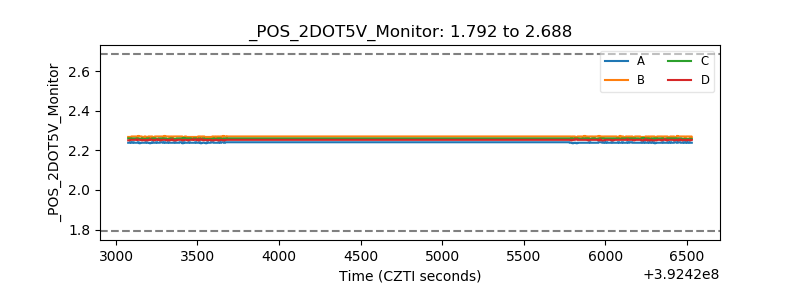 |
| +5 Volts monitor | 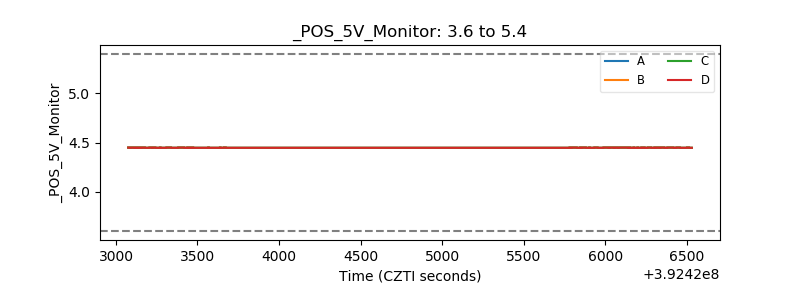 |
| _ROLL_ROT | 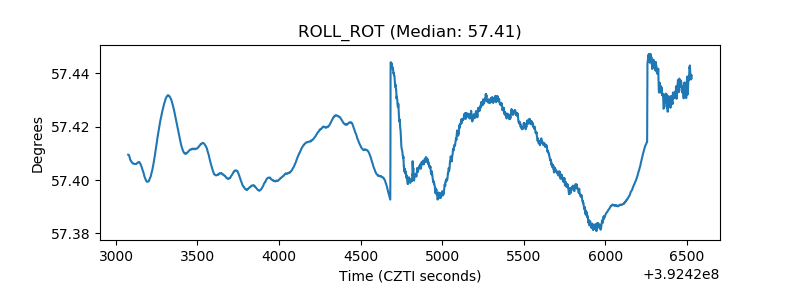 |
| _Roll_DEC | 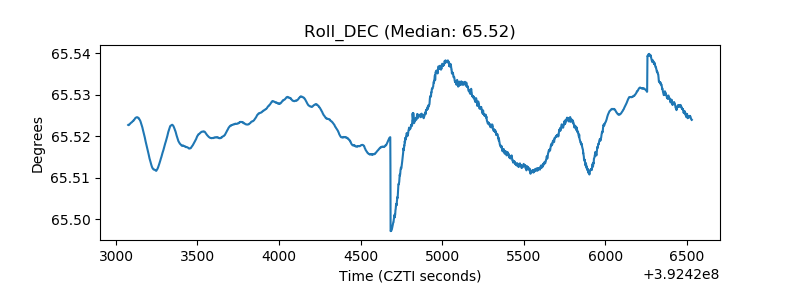 |
| _Roll_RA | 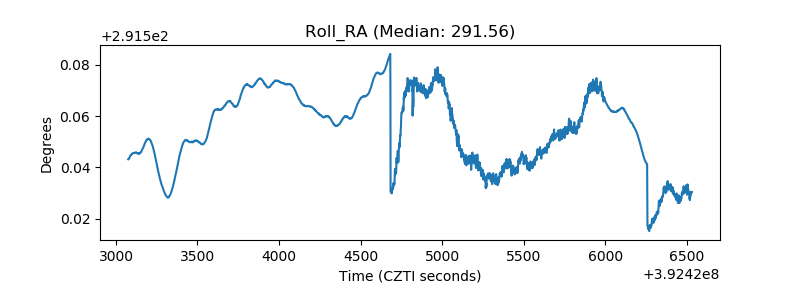 |
| Veto Counter | 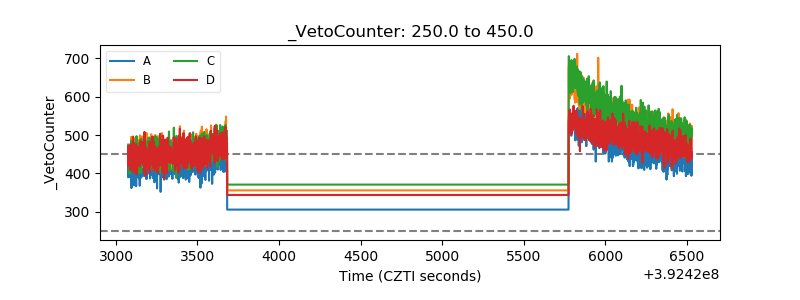 |