| Param | Original file | Final file |
|---|---|---|
| Filename | modeM0/AS1A11_097T17_9000005170_36192cztM0_level2.evt | modeM0/AS1A11_097T17_9000005170_36192cztM0_level2_quad_clean.evt |
| Size (bytes) | 462,280,320 | 53,674,560 |
| Size | 440.9 MB | 51.2 MB |
| Events in quadrant A | 2,590,406 | 326,038 |
| Events in quadrant B | 2,625,254 | 331,392 |
| Events in quadrant C | 3,196,872 | 323,519 |
| Events in quadrant D | 5,223,559 | 268,332 |
| Mode SS | |||
|---|---|---|---|
| Quadrant | BADHDUFLAG | Total packets | Discarded packets |
| A | 0 | 110 | 0 |
| B | 0 | 110 | 0 |
| C | 0 | 110 | 0 |
| D | 0 | 110 | 0 |
| Mode M0 | |||
|---|---|---|---|
| Quadrant | BADHDUFLAG | Total packets | Discarded packets |
| A | 0 | 11026 | 3 |
| B | 0 | 11188 | 2 |
| C | 0 | 12784 | 2 |
| D | 0 | 19224 | 2 |
| Mode M9 | |||
|---|---|---|---|
| Quadrant | BADHDUFLAG | Total packets | Discarded packets |
| A | 0 | 32 | 0 |
| B | 0 | 32 | 0 |
| C | 0 | 32 | 0 |
| D | 0 | 33 | 0 |
| Quadrant | Total seconds | Saturated seconds | Saturation percentage |
|---|---|---|---|
| A | 5358 | 8 | 0.149309% |
| B | 5358 | 14 | 0.261292% |
| C | 5358 | 31 | 0.578574% |
| D | 5358 | 824 | 15.378873% |
Noise dominated data is calculated using 1-second bins in cleaned event files. If a bin has >2000 counts, and if more than 50% of those come from <1% of pixels, then it is considered to be noise-dominated and hence unusable.
| Quadrant | # 1 sec bins | Bins with >0 counts | Bins with >2000 counts | High rate bins dominated by noise | Noise dominated (total time) | Noise dominated (detector-on time) | Marked lightcurve |
|---|---|---|---|---|---|---|---|
| A | 7001 | 5359 | 3 | 3 | 0.04% | 0.06% | 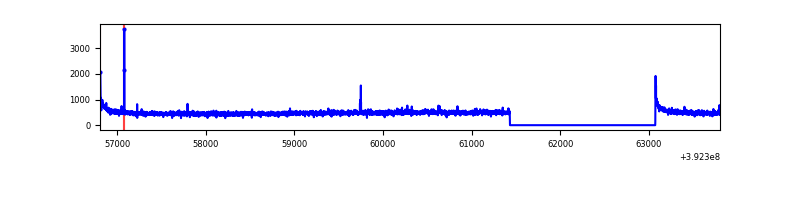 |
| B | 7001 | 5359 | 5 | 5 | 0.07% | 0.09% | 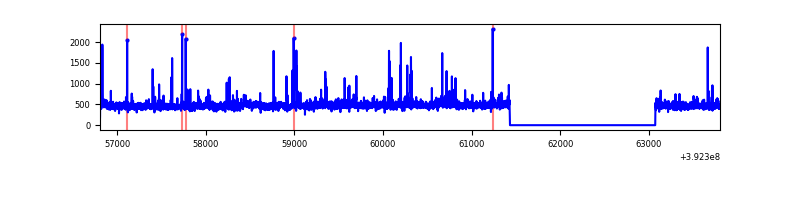 |
| C | 7001 | 5359 | 20 | 20 | 0.29% | 0.37% | 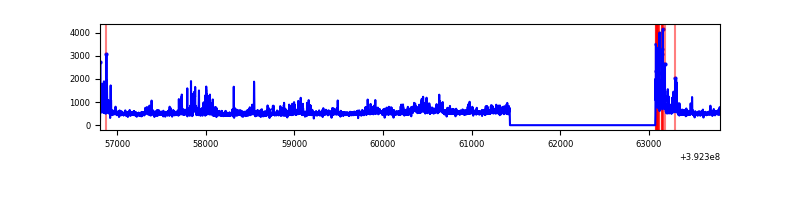 |
| D | 7001 | 5359 | 694 | 694 | 9.91% | 12.95% | 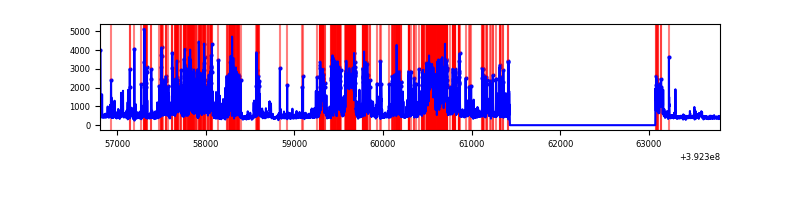 |
Top three noisy pixels from each quadrant. If the there are fewer than three noisy pixels in the level2.evt file, extra rows are filled as -1
| Pixel properties | Quadrant properties | ||||||
|---|---|---|---|---|---|---|---|
| Quadrant | DetID | PixID | Counts | Sigma | Mean | Median | Sigma |
| A | 10 | 83 | 172532 | 1382.26 | 612 | 597 | 124.4 |
| A | 8 | 144 | 22251 | 174.09 | 612 | 597 | 124.4 |
| A | 13 | 6 | 14499 | 111.76 | 612 | 597 | 124.4 |
| B | 5 | 172 | 126342 | 1064.02 | 610 | 593 | 118.2 |
| B | 0 | 246 | 33308 | 276.81 | 610 | 593 | 118.2 |
| B | 15 | 85 | 19380 | 158.96 | 610 | 593 | 118.2 |
| C | 4 | 254 | 332215 | 2378.69 | 599 | 602 | 139.4 |
| C | 15 | 214 | 247066 | 1767.91 | 599 | 602 | 139.4 |
| C | 0 | 10 | 127023 | 906.83 | 599 | 602 | 139.4 |
| D | 2 | 250 | 1654165 | 12122.38 | 554 | 540 | 136.4 |
| D | 12 | 6 | 804882 | 5896.46 | 554 | 540 | 136.4 |
| D | 13 | 249 | 422503 | 3093.32 | 554 | 540 | 136.4 |
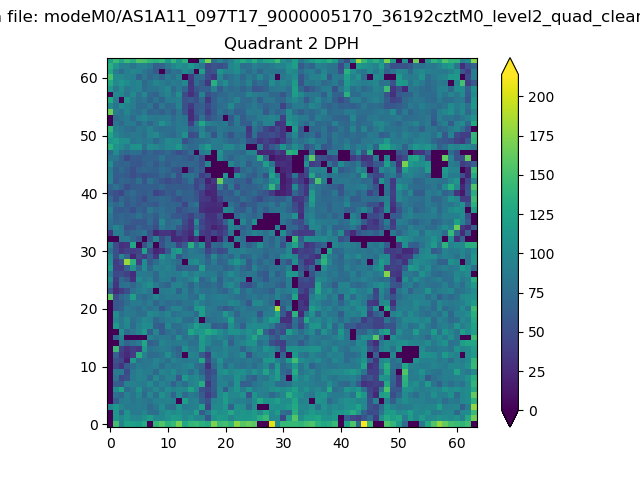
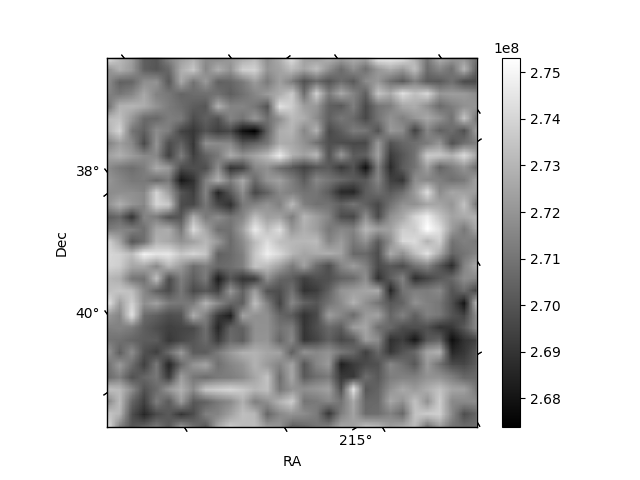
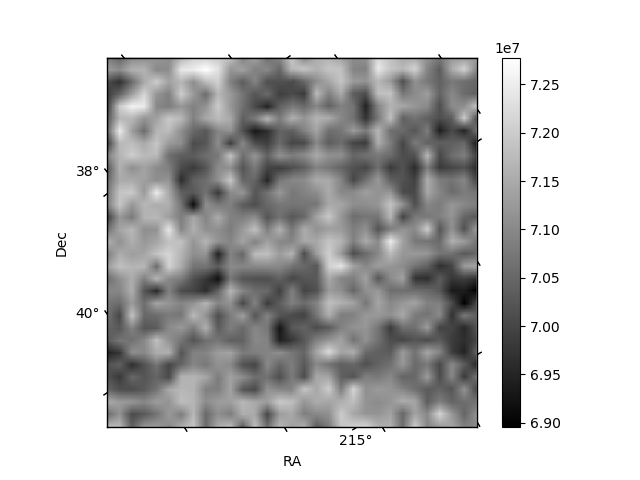
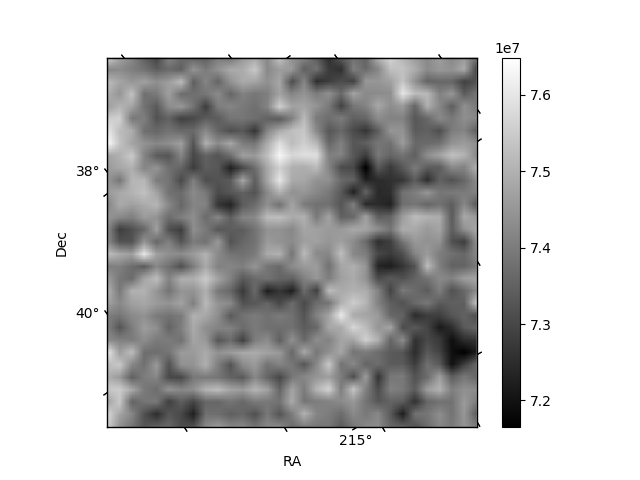
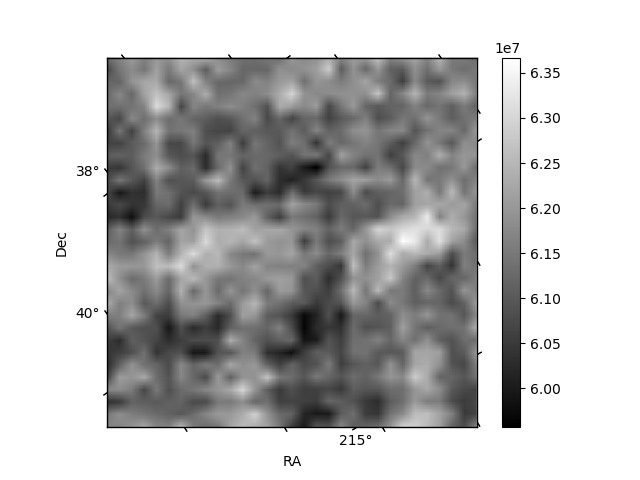
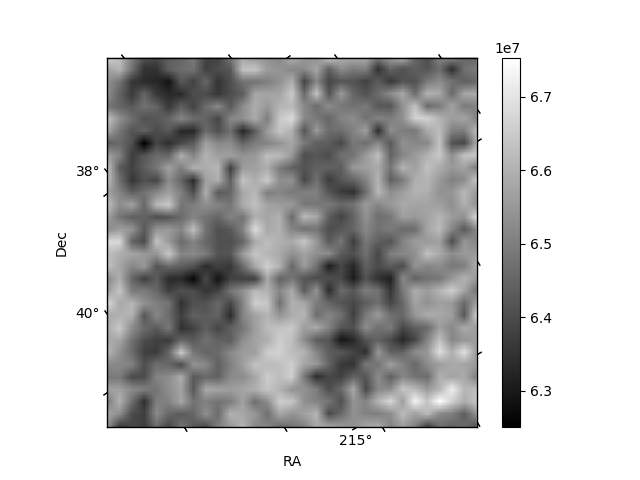
Histogram calculated using DETX and DETY for each event in the final _common_clean file
| Quadrant A | 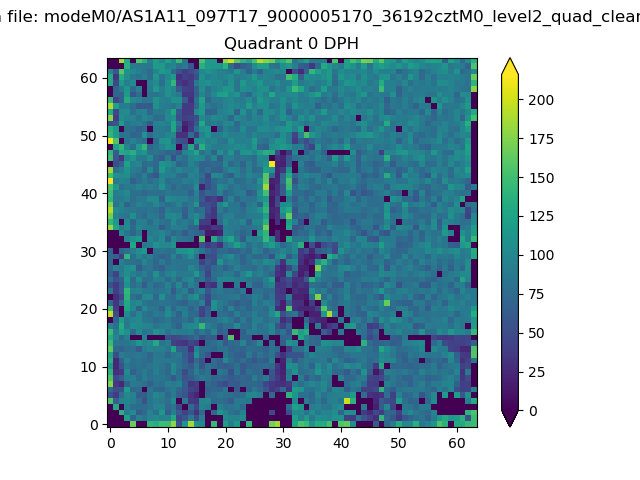 |
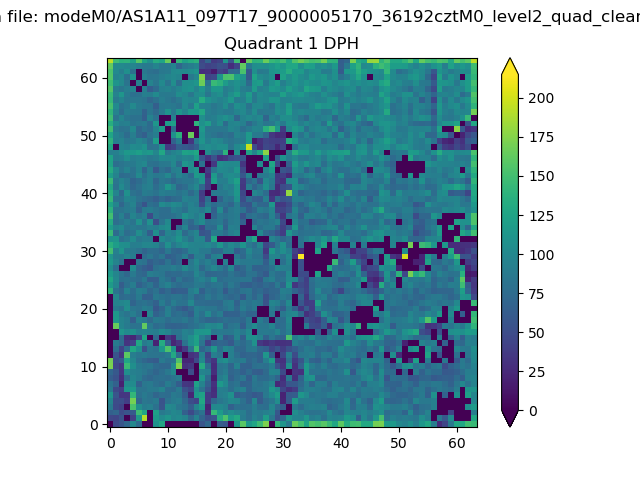 |
Quadrant B |
|---|---|---|---|
| Quadrant D | 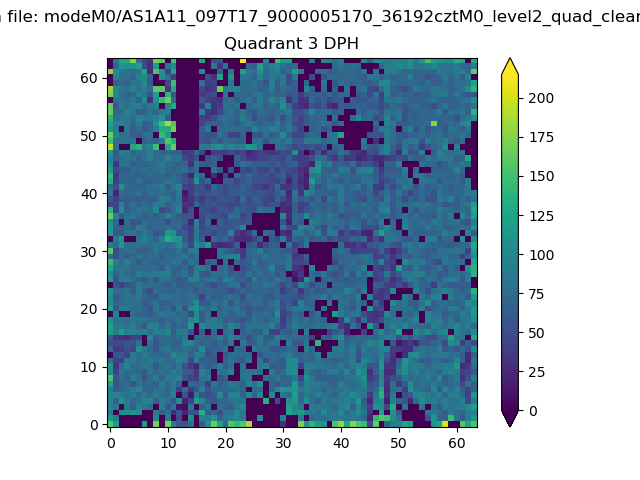 |
 |
Quadrant C |
| Plot type | Count rate plots | Images |
|---|---|---|
| Comparison with Poisson distribution Blue bars denote a histogram of data divided into 1 sec bins. Red curve is a Poisson curve with rate = median count rate of data. |
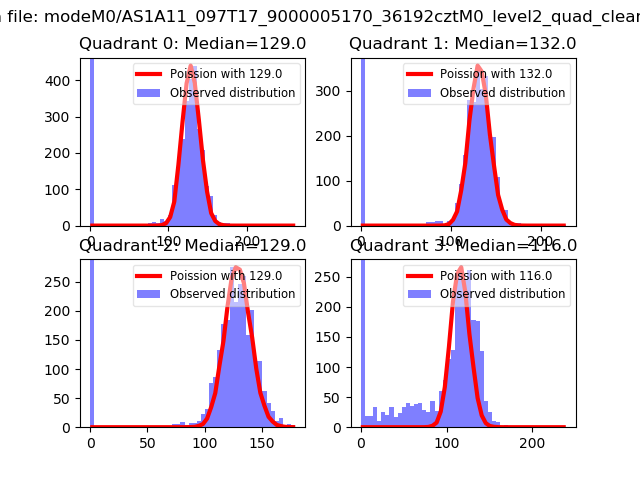 |
 |
| Quadrant-wise count rates Data is divided into 100 sec bins |
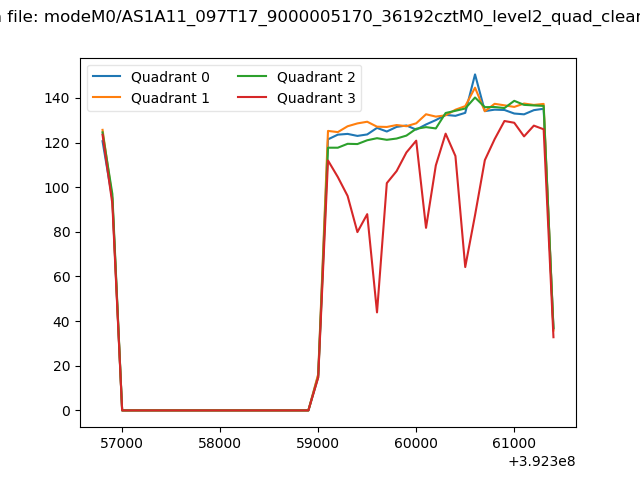 |
|
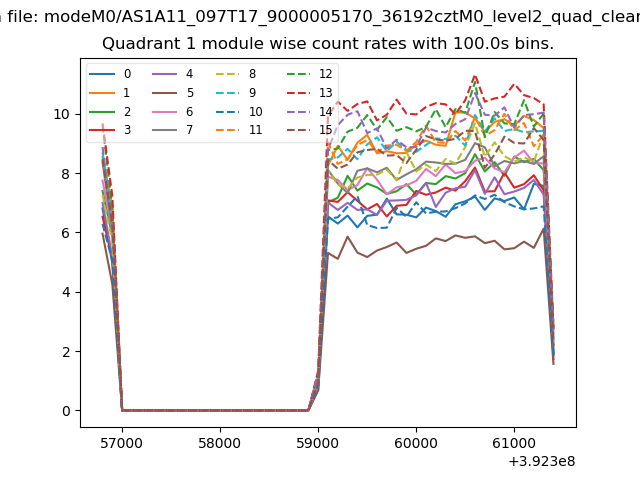
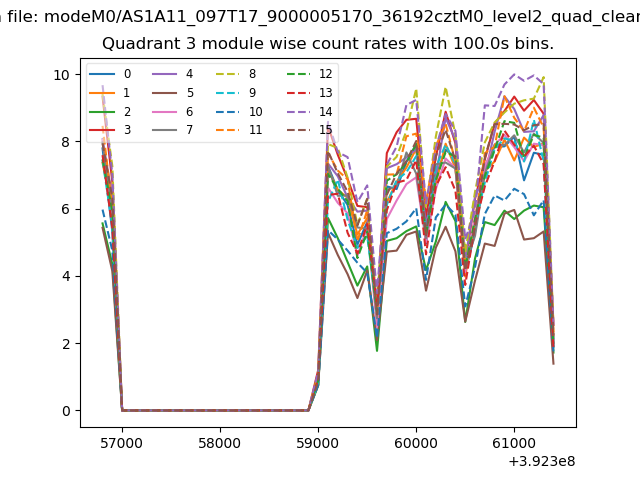
| Module-wise count rates for Quadrant A Data is divided into 100 sec bins |
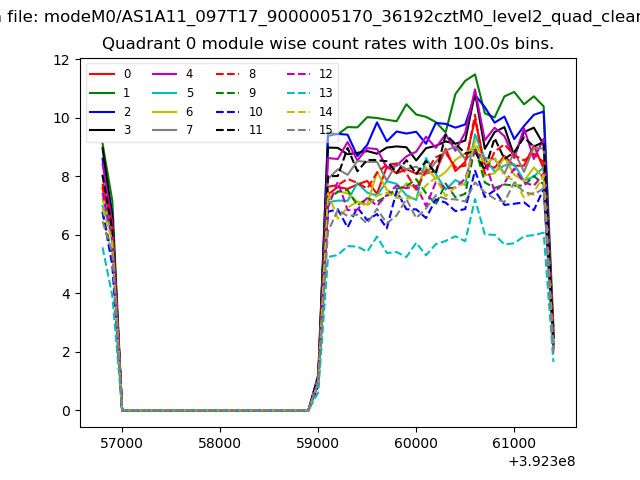 |
 |
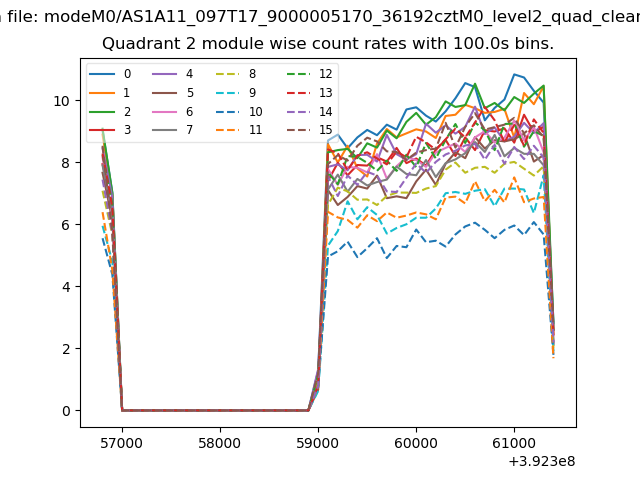
| Module-wise count rates for Quadrant B Data is divided into 100 sec bins |
 |
 |
| Module-wise count rates for Quadrant C Data is divided into 100 sec bins |
 |
 |
| Module-wise count rates for Quadrant D Data is divided into 100 sec bins |
 |
 |
| Parameter | Plot |
|---|---|
| CZT HV Monitor | 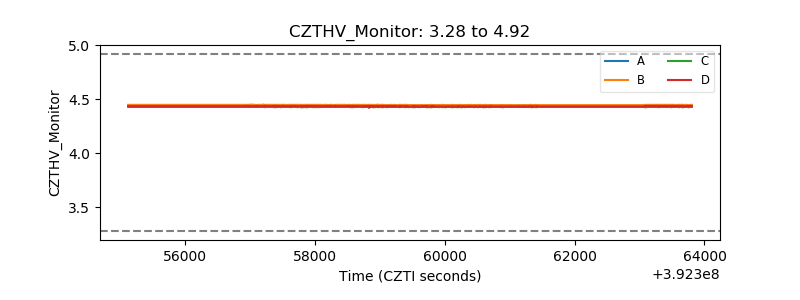 |
| D_VDD | 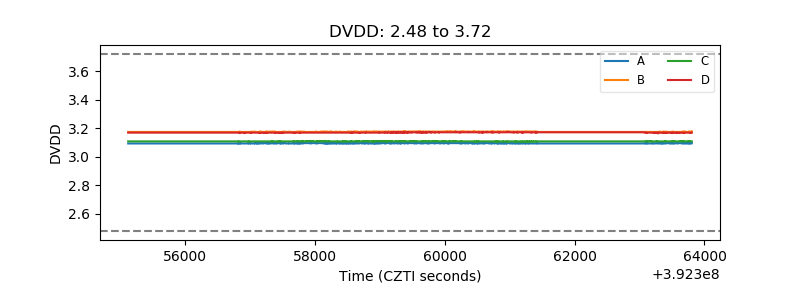 |
| Temperature 1 | 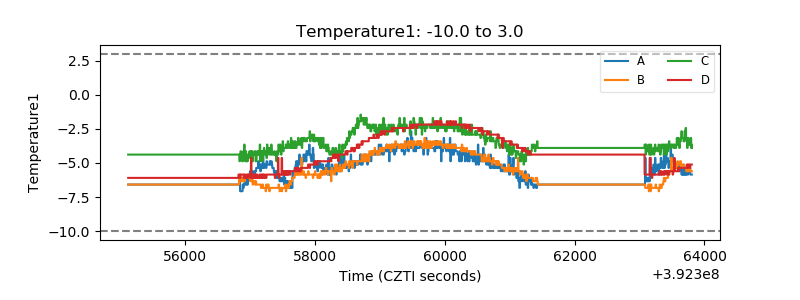 |
| Veto HV Monitor | 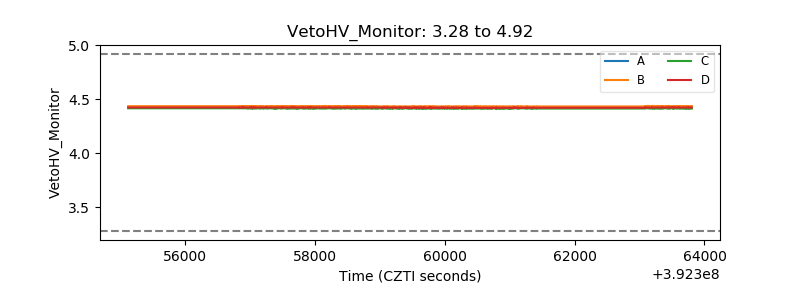 |
| Veto LLD | 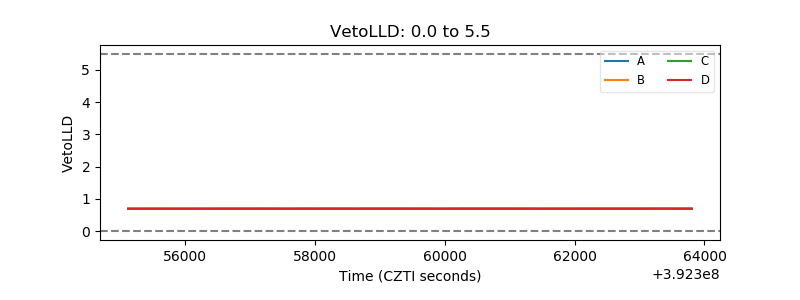 |
| Alpha Counter | 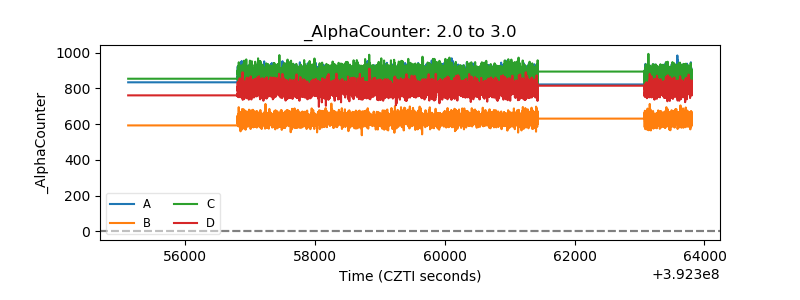 |
| _CPM_Rate | 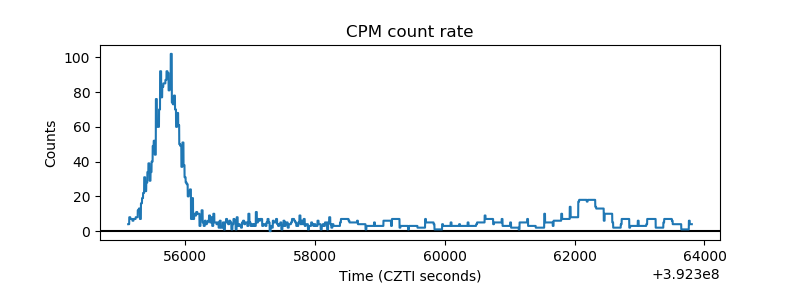 |
| CZT Counter | 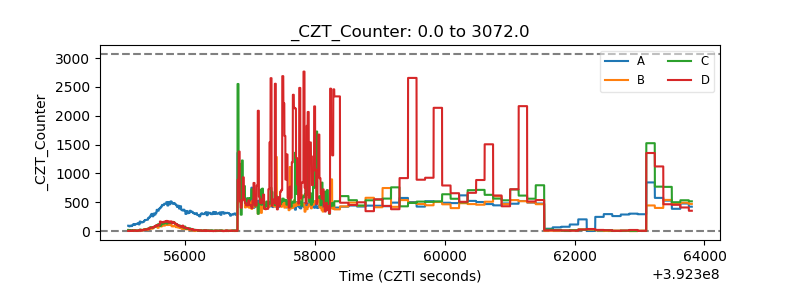 |
| +2.5 Volts monitor | 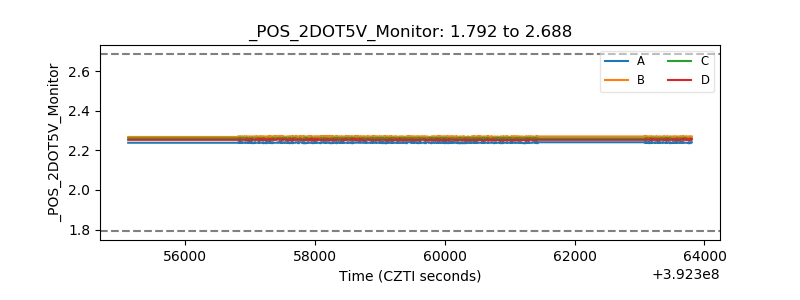 |
| +5 Volts monitor | 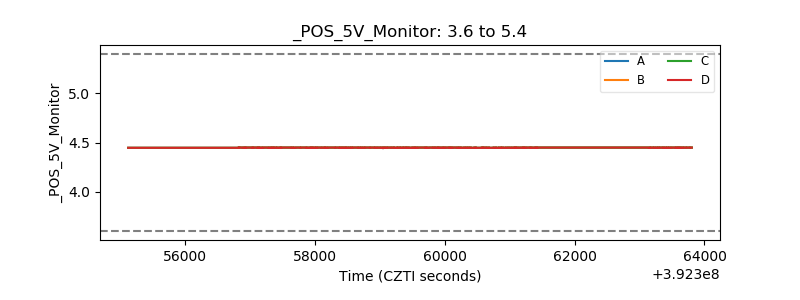 |
| _ROLL_ROT | 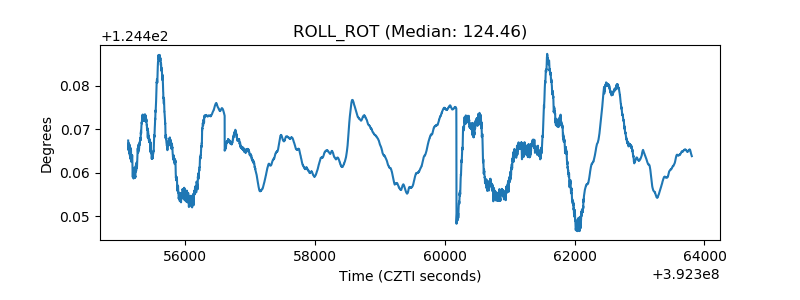 |
| _Roll_DEC | 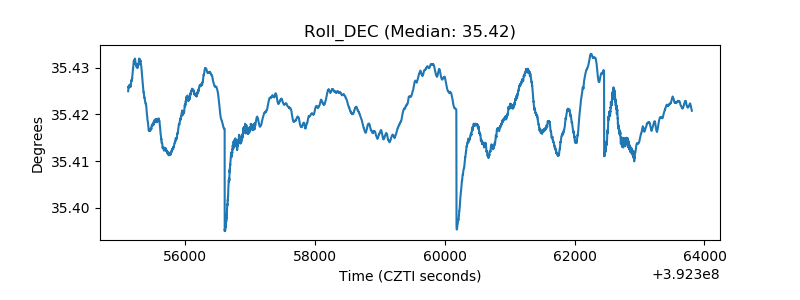 |
| _Roll_RA | 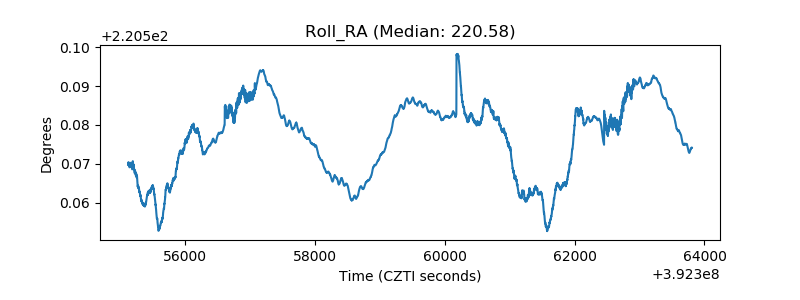 |
| Veto Counter | 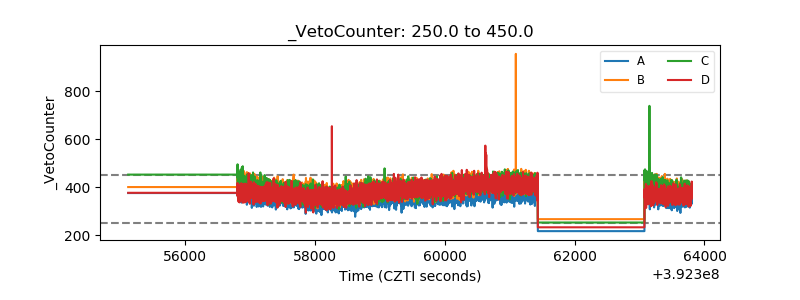 |