| Param | Original file | Final file |
|---|---|---|
| Filename | modeM0/AS1A10_071T50_9000005166_36182cztM0_level2.evt | modeM0/AS1A10_071T50_9000005166_36182cztM0_level2_quad_clean.evt |
| Size (bytes) | 1,030,106,880 | 141,678,720 |
| Size | 982.4 MB | 135.1 MB |
| Events in quadrant A | 4,965,019 | 942,399 |
| Events in quadrant B | 5,927,235 | 941,494 |
| Events in quadrant C | 9,489,546 | 895,863 |
| Events in quadrant D | 10,111,005 | 787,410 |
| Mode M0 | |||
|---|---|---|---|
| Quadrant | BADHDUFLAG | Total packets | Discarded packets |
| A | 0 | 21478 | 3 |
| B | 0 | 24354 | 2 |
| C | 0 | 34979 | 2 |
| D | 0 | 37000 | 2 |
| Mode M9 | |||
|---|---|---|---|
| Quadrant | BADHDUFLAG | Total packets | Discarded packets |
| A | 0 | 28 | 0 |
| B | 0 | 28 | 0 |
| C | 0 | 28 | 0 |
| D | 0 | 28 | 0 |
| Mode SS | |||
|---|---|---|---|
| Quadrant | BADHDUFLAG | Total packets | Discarded packets |
| A | 0 | 212 | 0 |
| B | 0 | 212 | 0 |
| C | 0 | 212 | 0 |
| D | 0 | 212 | 0 |
| Quadrant | Total seconds | Saturated seconds | Saturation percentage |
|---|---|---|---|
| A | 10435 | 15 | 0.143747% |
| B | 10435 | 171 | 1.638716% |
| C | 10435 | 1054 | 10.100623% |
| D | 10435 | 2052 | 19.664590% |
Noise dominated data is calculated using 1-second bins in cleaned event files. If a bin has >2000 counts, and if more than 50% of those come from <1% of pixels, then it is considered to be noise-dominated and hence unusable.
| Quadrant | # 1 sec bins | Bins with >0 counts | Bins with >2000 counts | High rate bins dominated by noise | Noise dominated (total time) | Noise dominated (detector-on time) | Marked lightcurve |
|---|---|---|---|---|---|---|---|
| A | 13271 | 10437 | 3 | 3 | 0.02% | 0.03% | 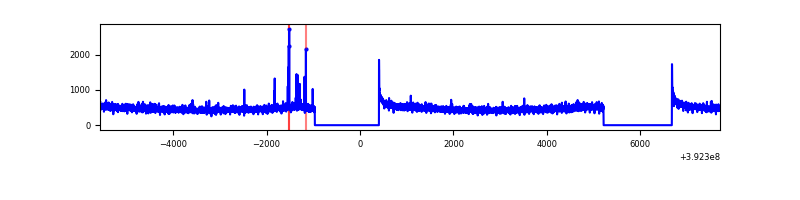 |
| B | 13271 | 10437 | 109 | 109 | 0.82% | 1.04% | 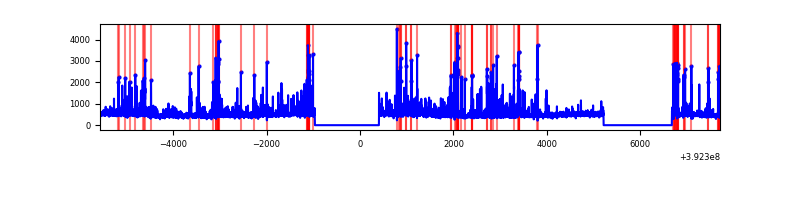 |
| C | 13271 | 10435 | 882 | 882 | 6.65% | 8.45% | 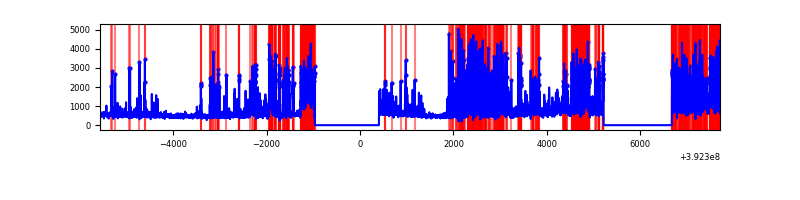 |
| D | 13271 | 10437 | 1929 | 1929 | 14.54% | 18.48% | 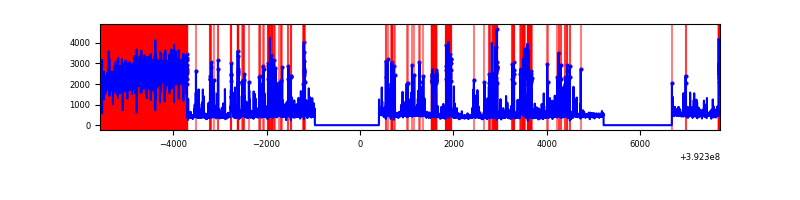 |
Top three noisy pixels from each quadrant. If the there are fewer than three noisy pixels in the level2.evt file, extra rows are filled as -1
| Pixel properties | Quadrant properties | ||||||
|---|---|---|---|---|---|---|---|
| Quadrant | DetID | PixID | Counts | Sigma | Mean | Median | Sigma |
| A | 10 | 83 | 265854 | 1097.94 | 1196 | 1172 | 241.1 |
| A | 9 | 143 | 31823 | 127.14 | 1196 | 1172 | 241.1 |
| A | 13 | 6 | 22763 | 89.56 | 1196 | 1172 | 241.1 |
| B | 5 | 172 | 759569 | 3333.55 | 1180 | 1149 | 227.5 |
| B | 5 | 236 | 214199 | 936.44 | 1180 | 1149 | 227.5 |
| B | 0 | 213 | 172628 | 753.72 | 1180 | 1149 | 227.5 |
| C | 4 | 254 | 2780457 | 10656.07 | 1124 | 1134 | 260.8 |
| C | 0 | 207 | 1173386 | 4494.47 | 1124 | 1134 | 260.8 |
| C | 15 | 214 | 452982 | 1732.41 | 1124 | 1134 | 260.8 |
| D | 2 | 31 | 3938735 | 14887.82 | 1079 | 1048 | 264.5 |
| D | 13 | 249 | 550041 | 2075.66 | 1079 | 1048 | 264.5 |
| D | 2 | 250 | 361710 | 1363.61 | 1079 | 1048 | 264.5 |
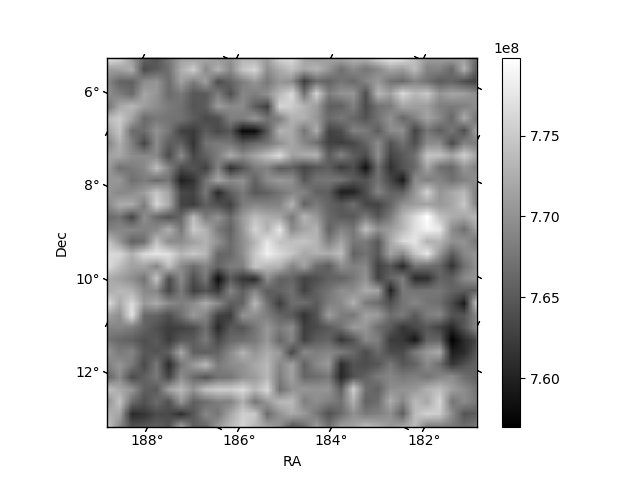
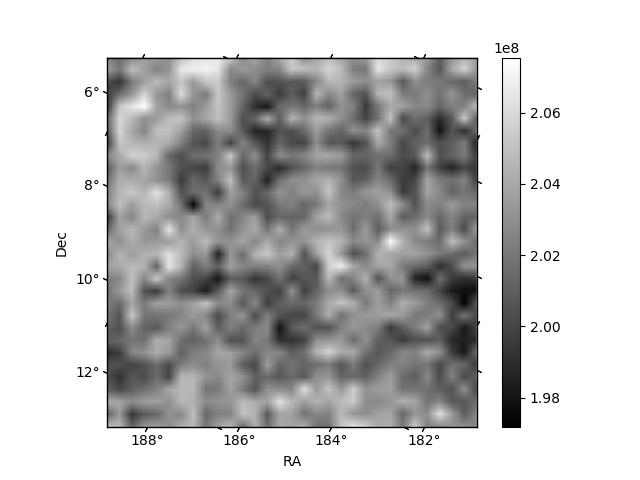
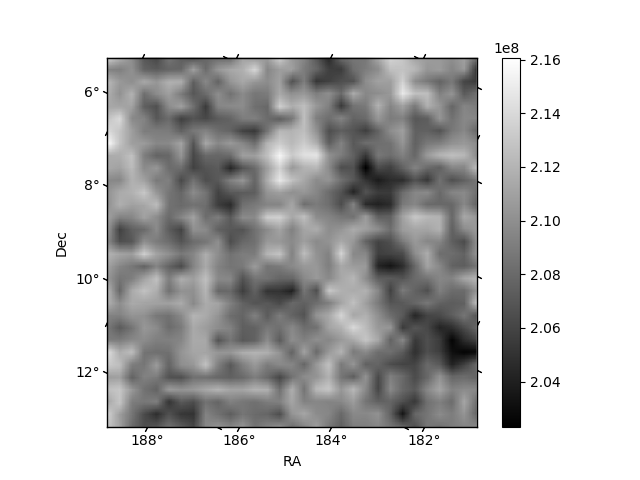
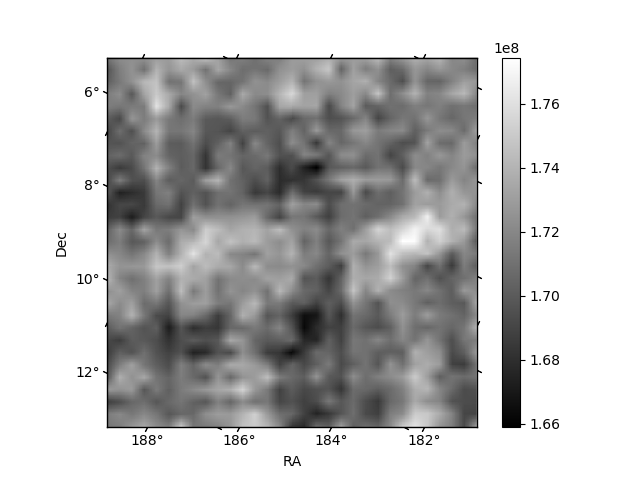
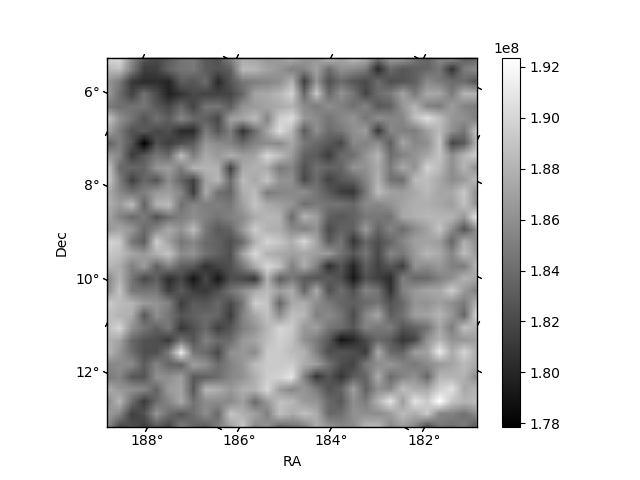
Histogram calculated using DETX and DETY for each event in the final _common_clean file
| Quadrant A | 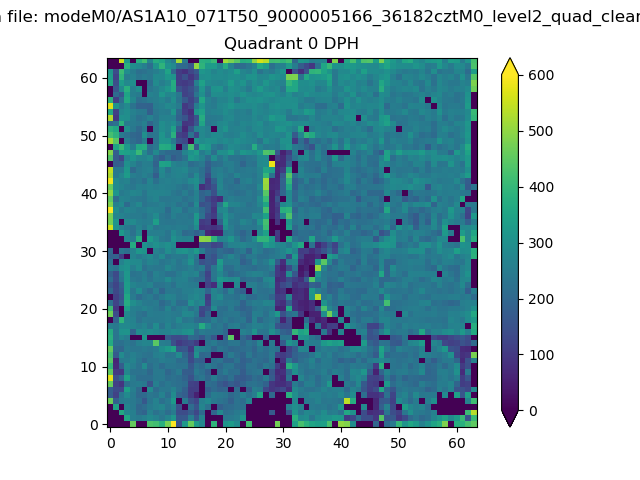 |
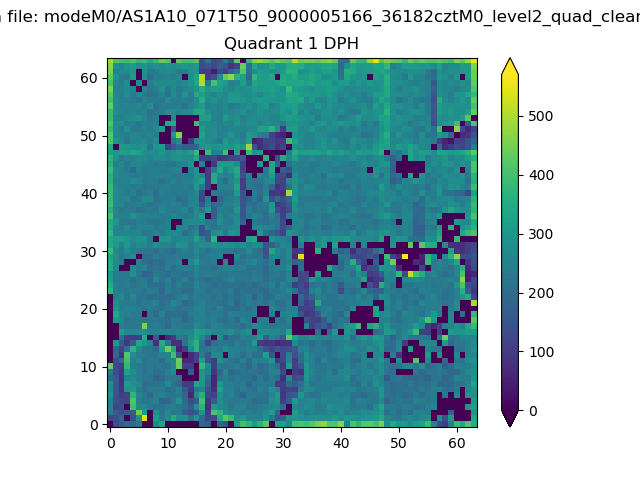 |
Quadrant B |
|---|---|---|---|
| Quadrant D | 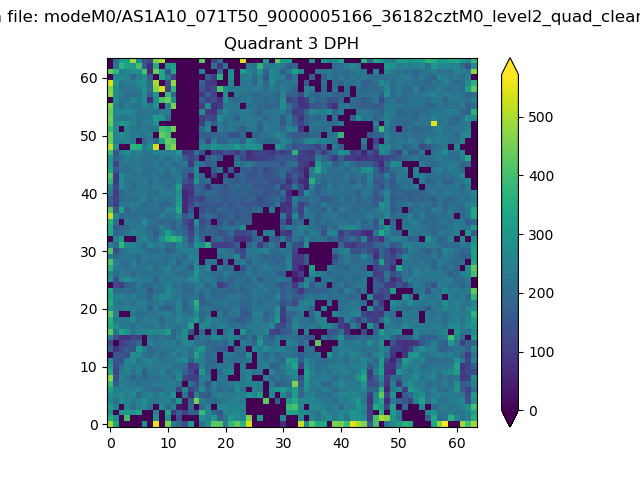 |
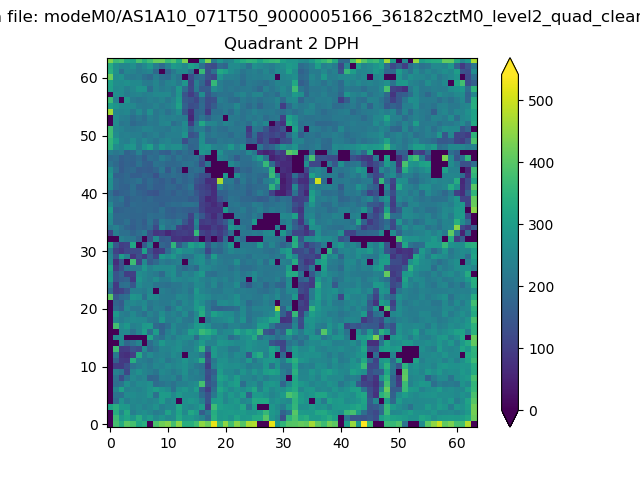 |
Quadrant C |
| Plot type | Count rate plots | Images |
|---|---|---|
| Comparison with Poisson distribution Blue bars denote a histogram of data divided into 1 sec bins. Red curve is a Poisson curve with rate = median count rate of data. |
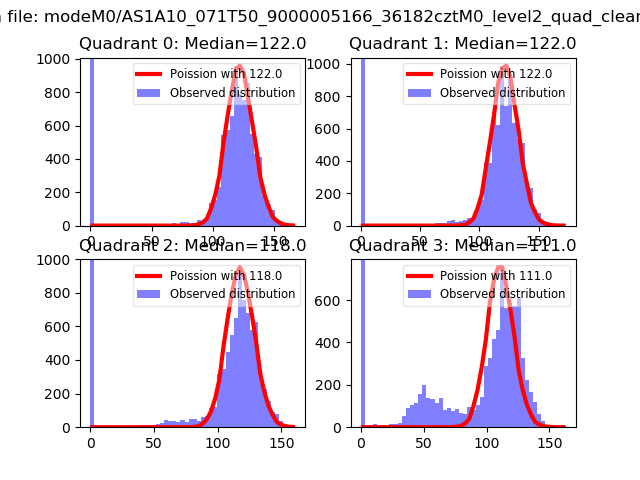 |
 |
| Quadrant-wise count rates Data is divided into 100 sec bins |
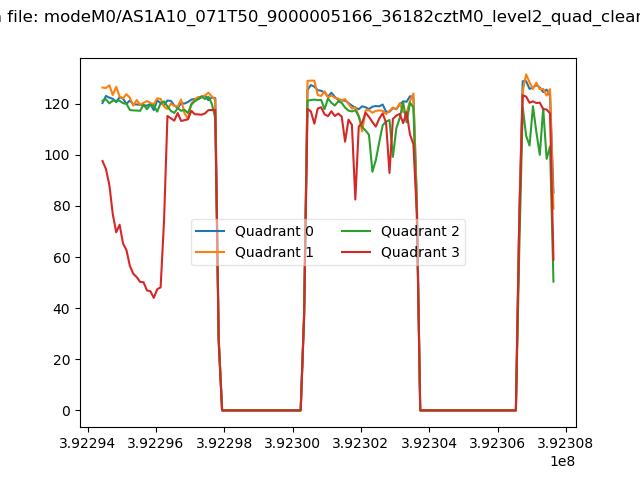 |
|
| Module-wise count rates for Quadrant A Data is divided into 100 sec bins |
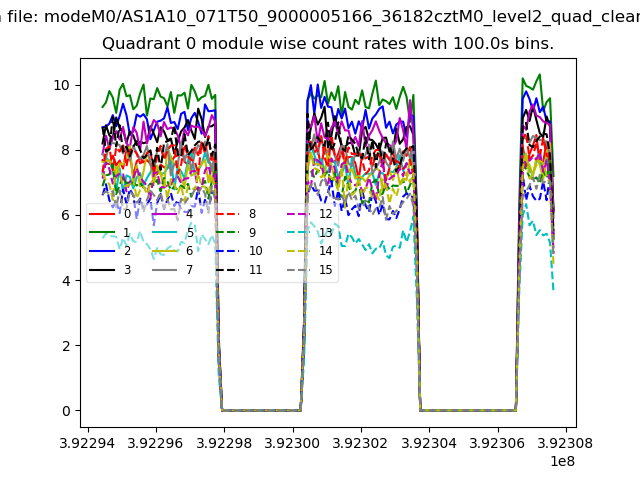 |
 |
| Module-wise count rates for Quadrant B Data is divided into 100 sec bins |
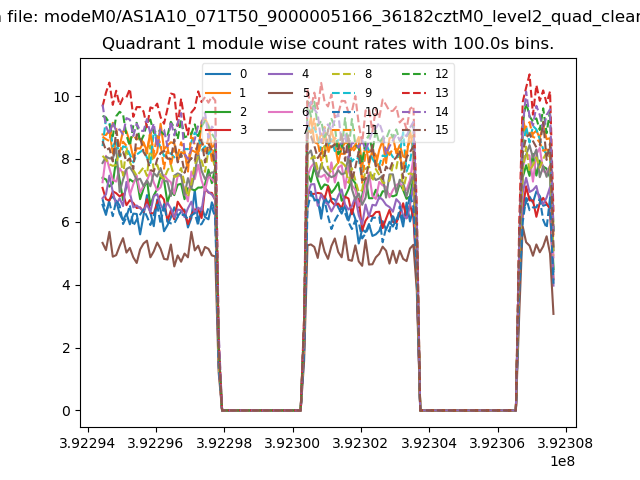 |
 |
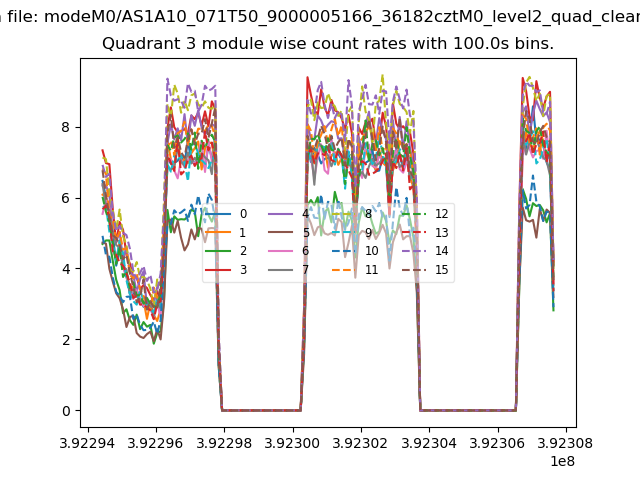
| Module-wise count rates for Quadrant C Data is divided into 100 sec bins |
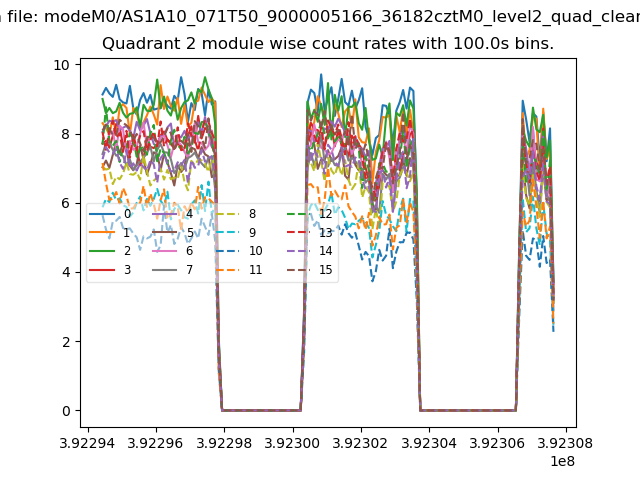 |
 |
| Module-wise count rates for Quadrant D Data is divided into 100 sec bins |
 |
 |
| Parameter | Plot |
|---|---|
| CZT HV Monitor | 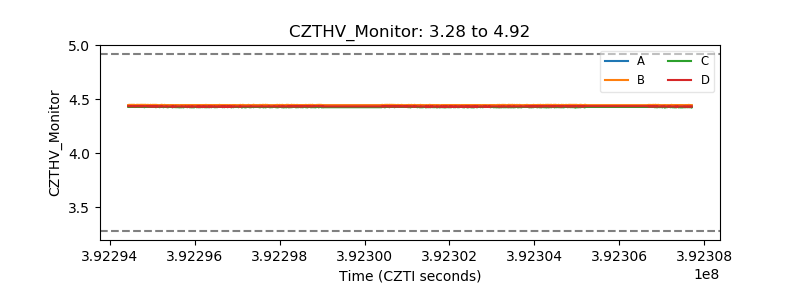 |
| D_VDD | 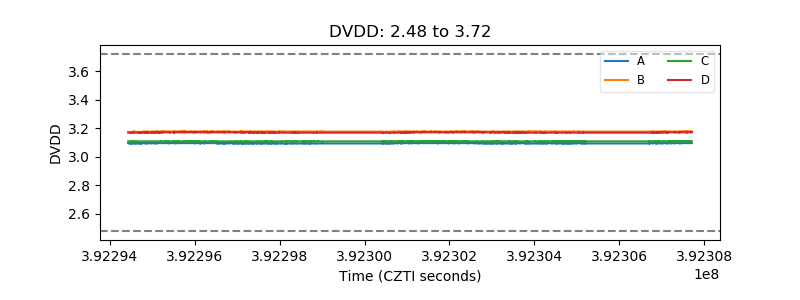 |
| Temperature 1 | 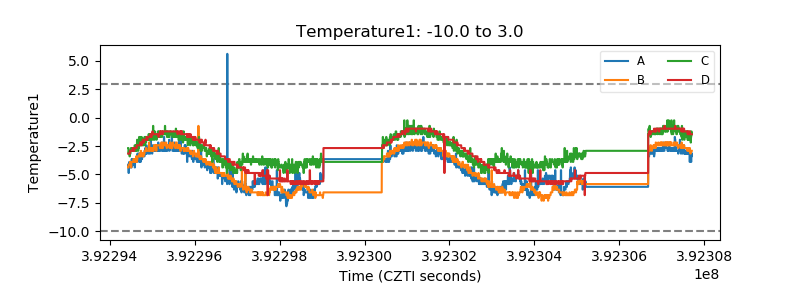 |
| Veto HV Monitor | 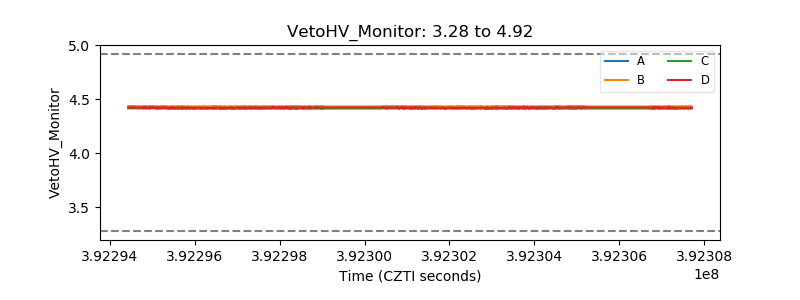 |
| Veto LLD | 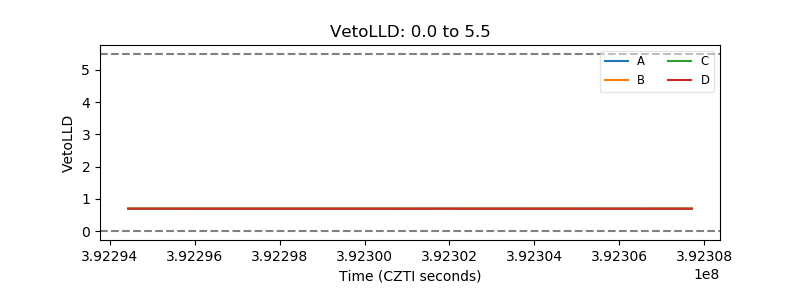 |
| Alpha Counter | 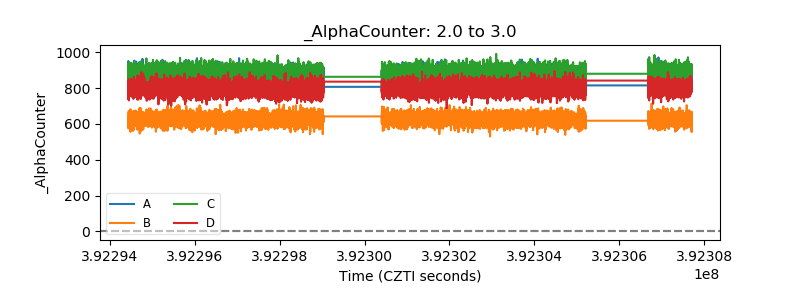 |
| _CPM_Rate | 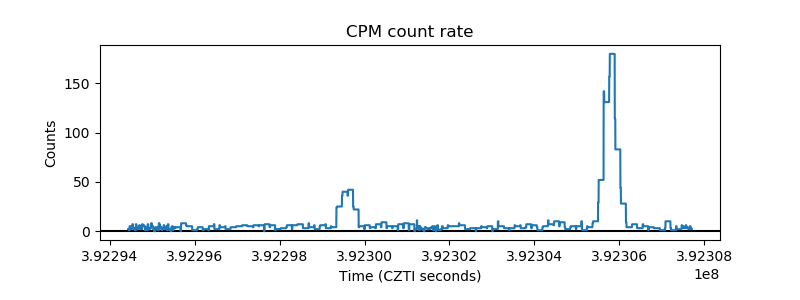 |
| CZT Counter | 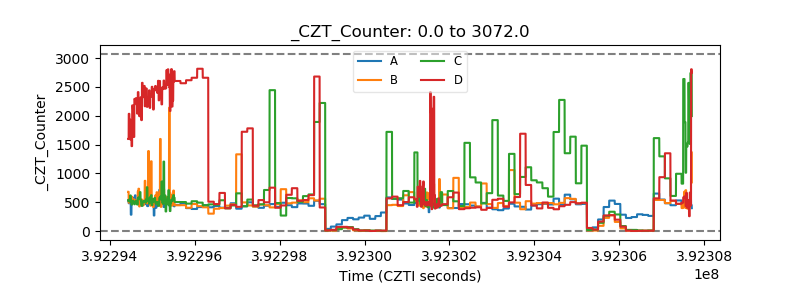 |
| +2.5 Volts monitor | 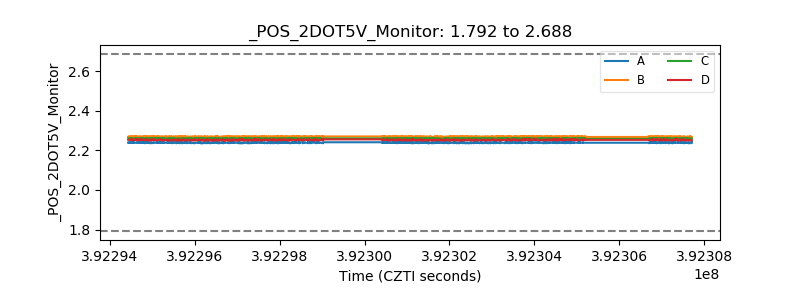 |
| +5 Volts monitor | 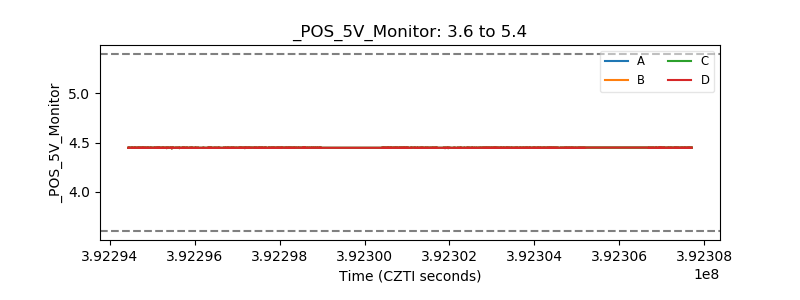 |
| _ROLL_ROT | 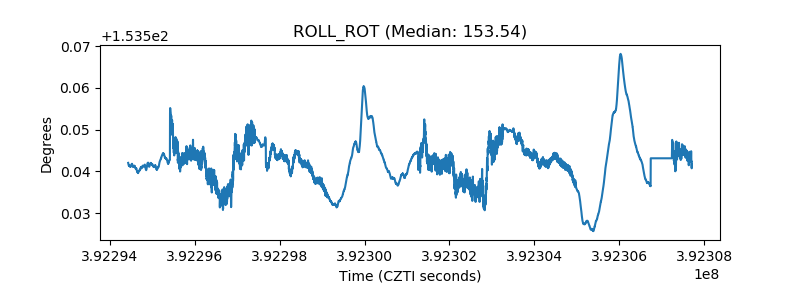 |
| _Roll_DEC | 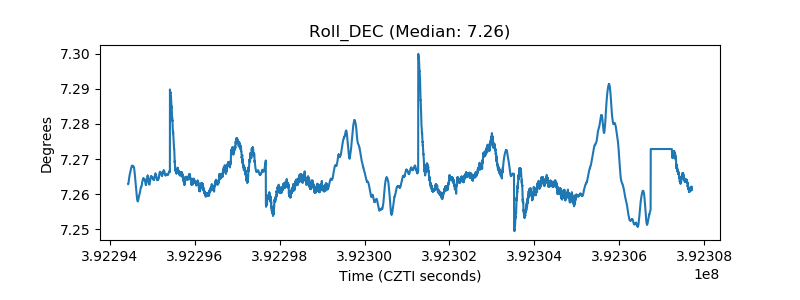 |
| _Roll_RA | 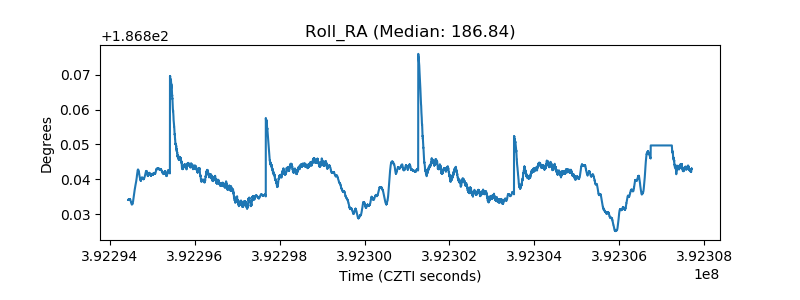 |
| Veto Counter | 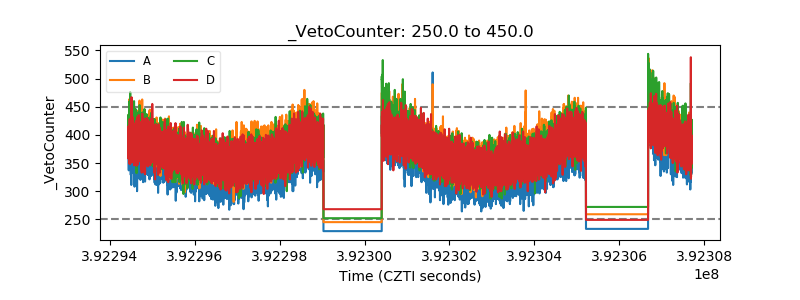 |