| Param | Original file | Final file |
|---|---|---|
| Filename | modeM0/AS1A10_071T50_9000005166_36180cztM0_level2.evt | modeM0/AS1A10_071T50_9000005166_36180cztM0_level2_quad_clean.evt |
| Size (bytes) | 795,096,000 | 77,290,560 |
| Size | 758.3 MB | 73.7 MB |
| Events in quadrant A | 2,937,592 | 548,213 |
| Events in quadrant B | 3,786,804 | 544,040 |
| Events in quadrant C | 3,600,467 | 543,247 |
| Events in quadrant D | 13,347,224 | 282,160 |
| Mode M0 | |||
|---|---|---|---|
| Quadrant | BADHDUFLAG | Total packets | Discarded packets |
| A | 0 | 12464 | 3 |
| B | 0 | 15066 | 2 |
| C | 0 | 14359 | 2 |
| D | 0 | 43770 | 2 |
| Mode M9 | |||
|---|---|---|---|
| Quadrant | BADHDUFLAG | Total packets | Discarded packets |
| A | 0 | 18 | 0 |
| B | 0 | 18 | 0 |
| C | 0 | 18 | 0 |
| D | 0 | 19 | 0 |
| Mode SS | |||
|---|---|---|---|
| Quadrant | BADHDUFLAG | Total packets | Discarded packets |
| A | 0 | 122 | 0 |
| B | 0 | 122 | 0 |
| C | 0 | 122 | 0 |
| D | 0 | 122 | 0 |
| Quadrant | Total seconds | Saturated seconds | Saturation percentage |
|---|---|---|---|
| A | 6027 | 10 | 0.165920% |
| B | 6027 | 206 | 3.417953% |
| C | 6027 | 85 | 1.410320% |
| D | 6027 | 4776 | 79.243405% |
Noise dominated data is calculated using 1-second bins in cleaned event files. If a bin has >2000 counts, and if more than 50% of those come from <1% of pixels, then it is considered to be noise-dominated and hence unusable.
| Quadrant | # 1 sec bins | Bins with >0 counts | Bins with >2000 counts | High rate bins dominated by noise | Noise dominated (total time) | Noise dominated (detector-on time) | Marked lightcurve |
|---|---|---|---|---|---|---|---|
| A | 7340 | 6028 | 2 | 2 | 0.03% | 0.03% | 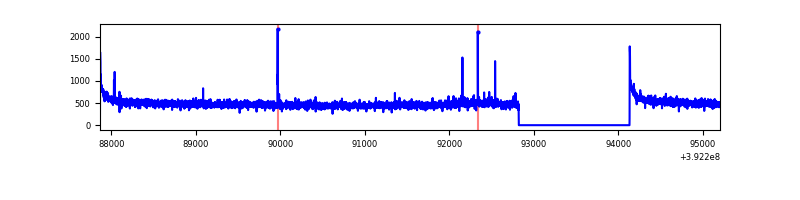 |
| B | 7340 | 6028 | 156 | 156 | 2.13% | 2.59% | 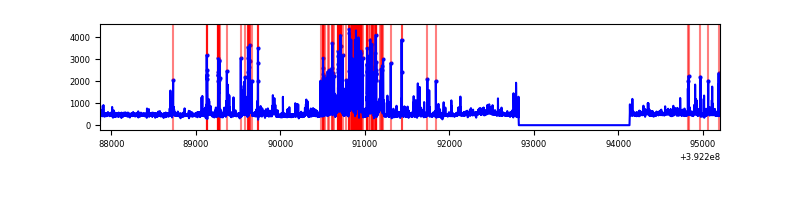 |
| C | 7340 | 6028 | 65 | 65 | 0.89% | 1.08% | 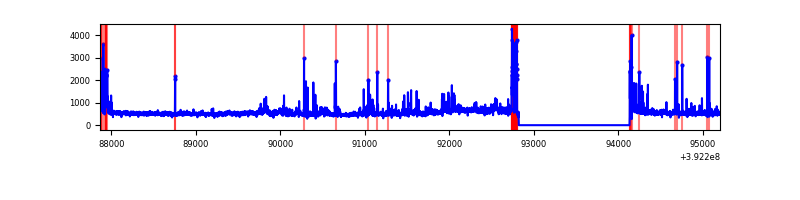 |
| D | 7340 | 6028 | 4431 | 4431 | 60.37% | 73.51% | 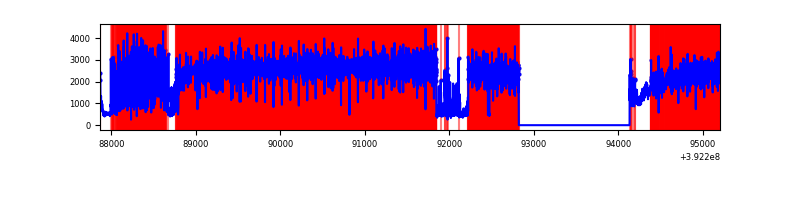 |
Top three noisy pixels from each quadrant. If the there are fewer than three noisy pixels in the level2.evt file, extra rows are filled as -1
| Pixel properties | Quadrant properties | ||||||
|---|---|---|---|---|---|---|---|
| Quadrant | DetID | PixID | Counts | Sigma | Mean | Median | Sigma |
| A | 10 | 83 | 188301 | 1313.2 | 700 | 685 | 142.9 |
| A | 9 | 143 | 14300 | 95.3 | 700 | 685 | 142.9 |
| A | 8 | 144 | 14190 | 94.53 | 700 | 685 | 142.9 |
| B | 5 | 172 | 445892 | 3304.46 | 686 | 667 | 134.7 |
| B | 5 | 236 | 420809 | 3118.29 | 686 | 667 | 134.7 |
| B | 0 | 213 | 111383 | 821.73 | 686 | 667 | 134.7 |
| C | 15 | 214 | 275884 | 1723.02 | 678 | 683 | 159.7 |
| C | 15 | 208 | 267148 | 1668.32 | 678 | 683 | 159.7 |
| C | 0 | 10 | 221868 | 1384.83 | 678 | 683 | 159.7 |
| D | 2 | 31 | 9399221 | 83463.02 | 458 | 445 | 112.6 |
| D | 2 | 250 | 1360112 | 12074.12 | 458 | 445 | 112.6 |
| D | 12 | 235 | 245999 | 2180.57 | 458 | 445 | 112.6 |
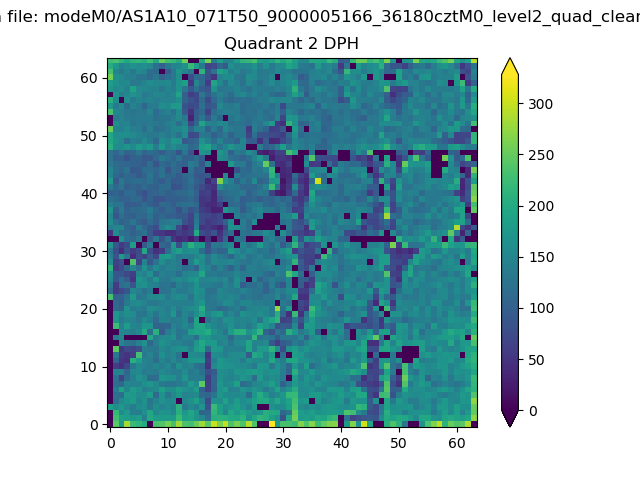
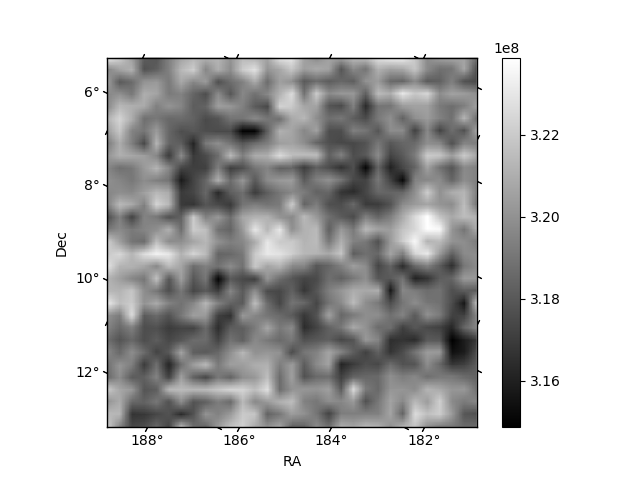
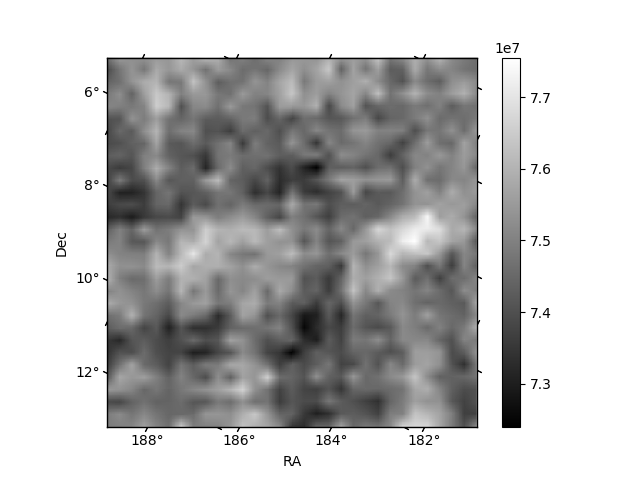
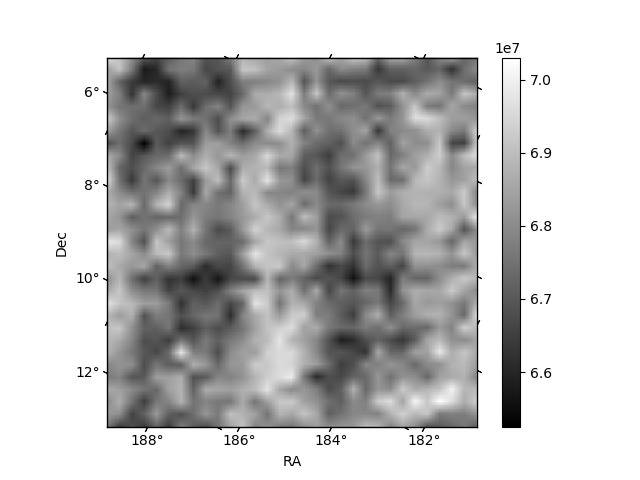
Histogram calculated using DETX and DETY for each event in the final _common_clean file
| Quadrant A | 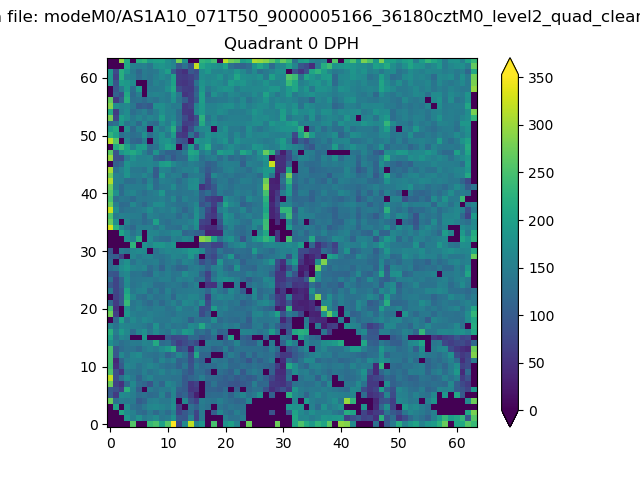 |
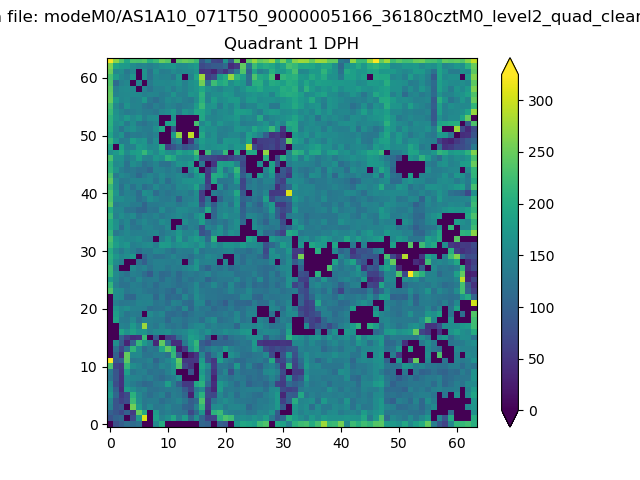 |
Quadrant B |
|---|---|---|---|
| Quadrant D | 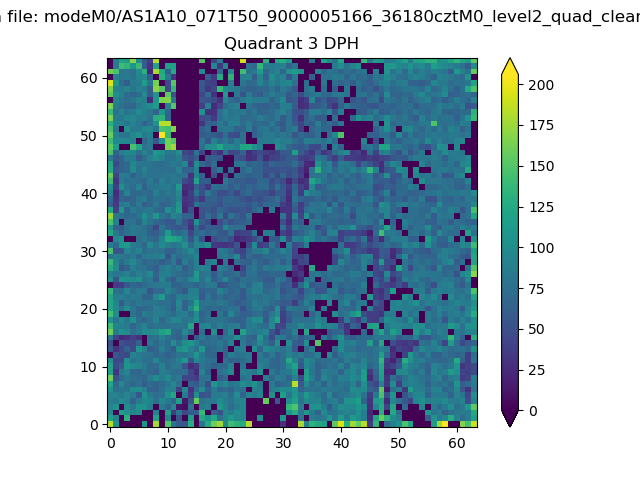 |
 |
Quadrant C |
| Plot type | Count rate plots | Images |
|---|---|---|
| Comparison with Poisson distribution Blue bars denote a histogram of data divided into 1 sec bins. Red curve is a Poisson curve with rate = median count rate of data. |
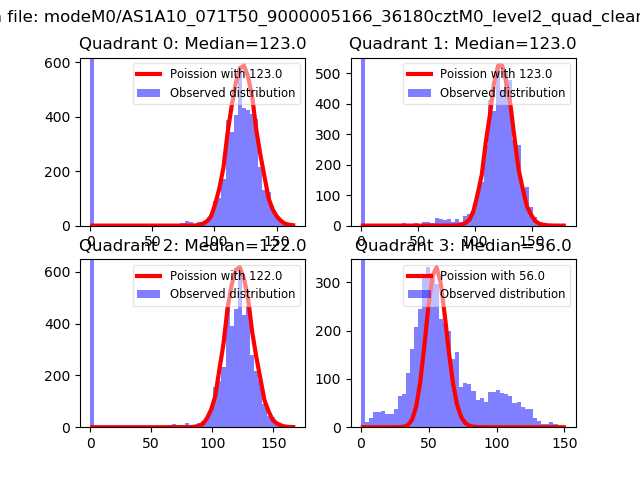 |
 |
| Quadrant-wise count rates Data is divided into 100 sec bins |
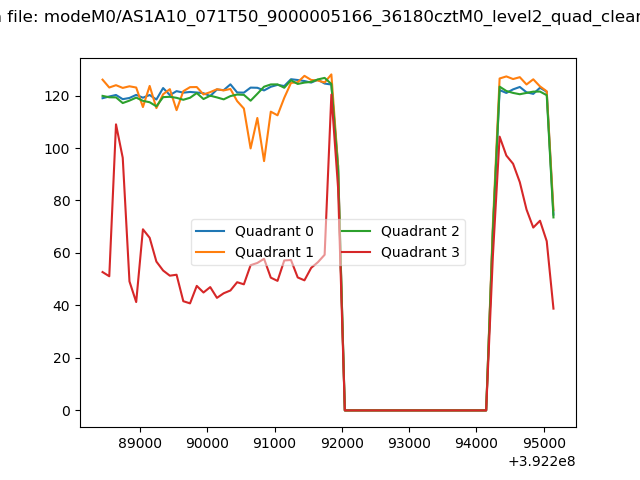 |
|
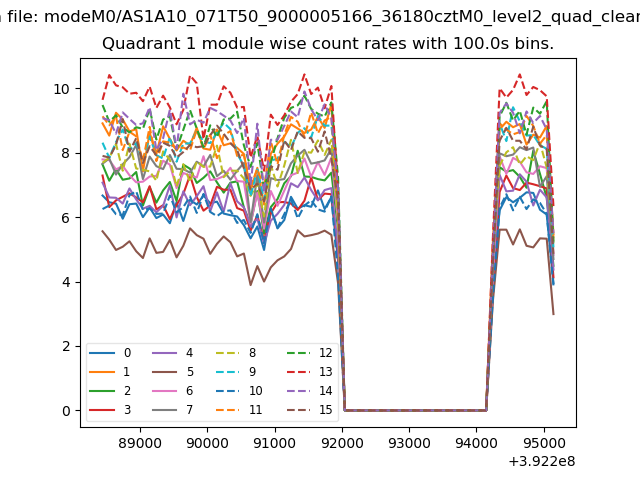
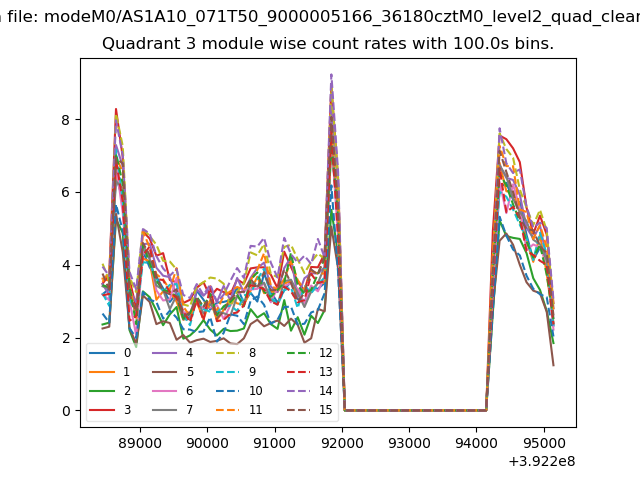
| Module-wise count rates for Quadrant A Data is divided into 100 sec bins |
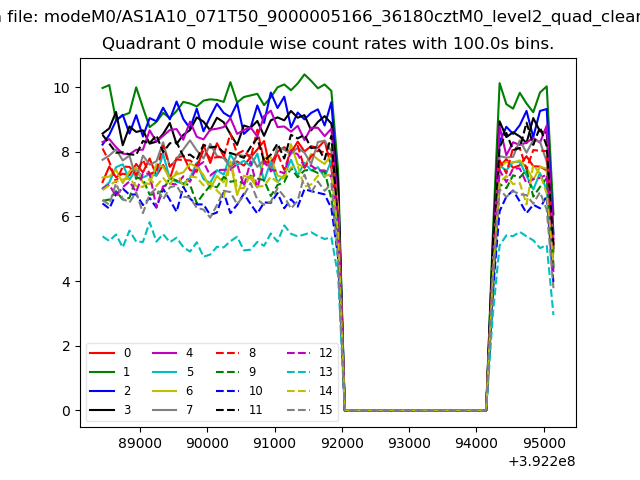 |
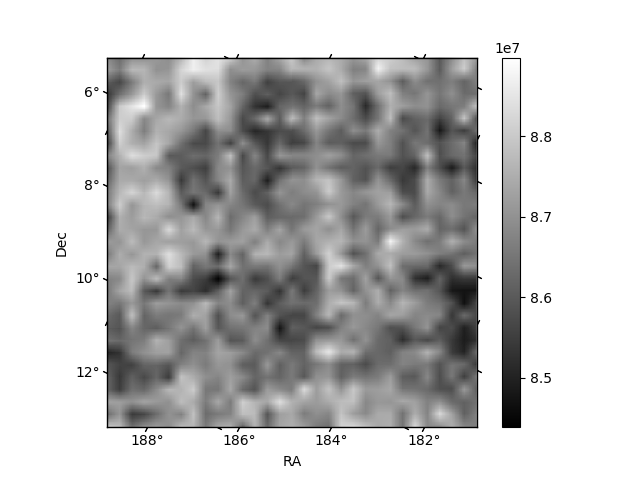 |
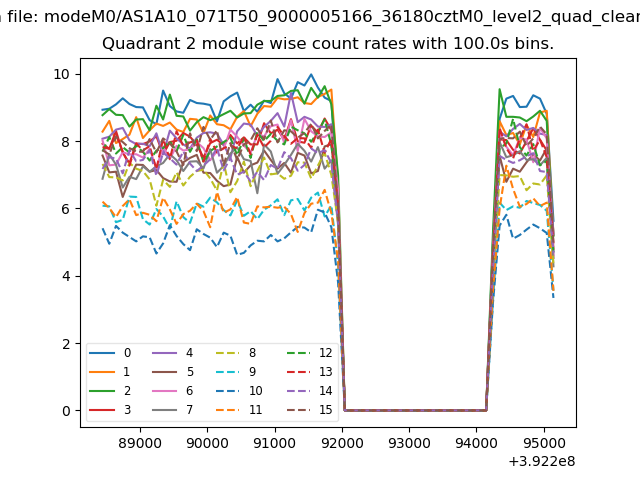
| Module-wise count rates for Quadrant B Data is divided into 100 sec bins |
 |
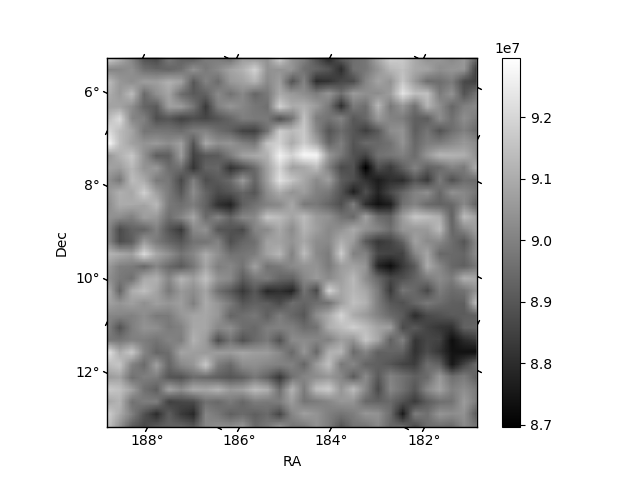 |
| Module-wise count rates for Quadrant C Data is divided into 100 sec bins |
 |
 |
| Module-wise count rates for Quadrant D Data is divided into 100 sec bins |
 |
 |
| Parameter | Plot |
|---|---|
| CZT HV Monitor | 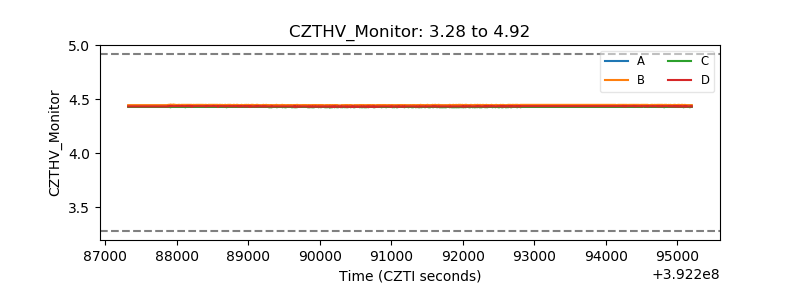 |
| D_VDD | 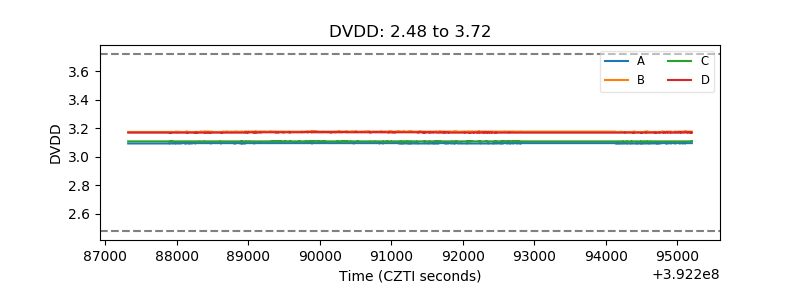 |
| Temperature 1 | 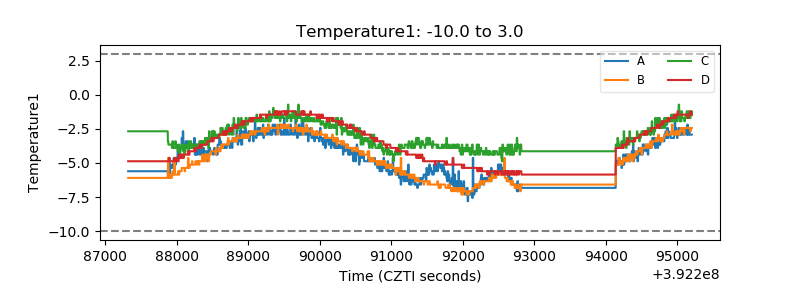 |
| Veto HV Monitor | 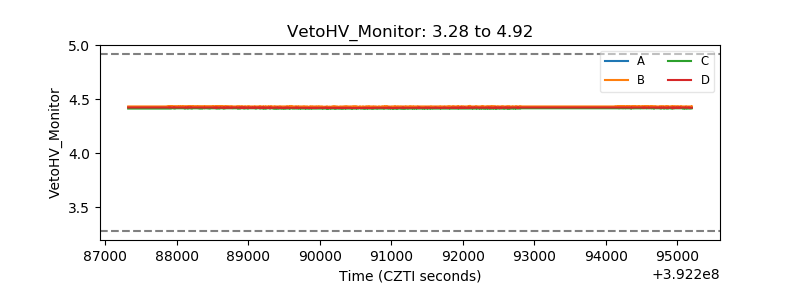 |
| Veto LLD | 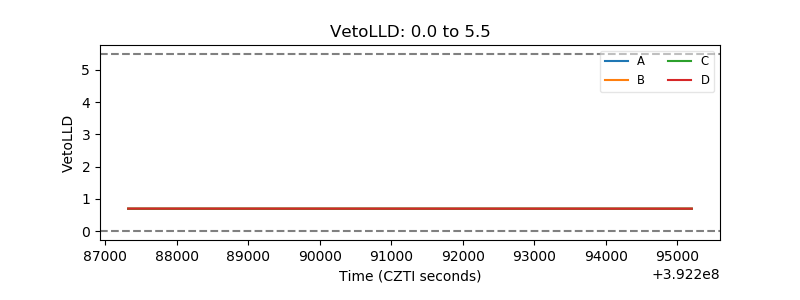 |
| Alpha Counter | 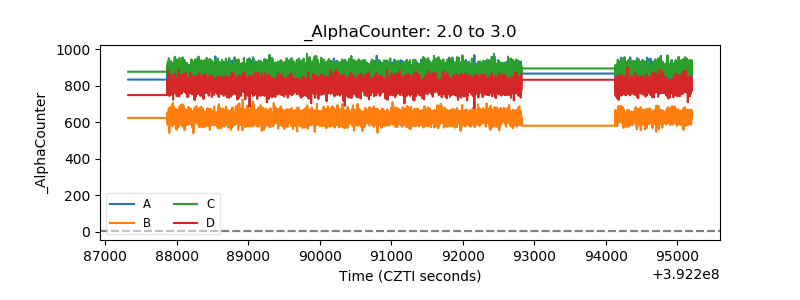 |
| _CPM_Rate | 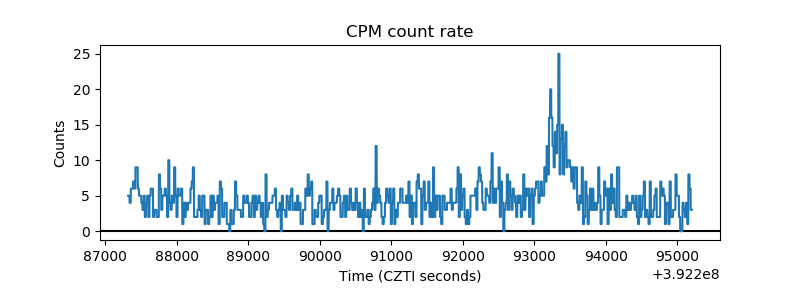 |
| CZT Counter | 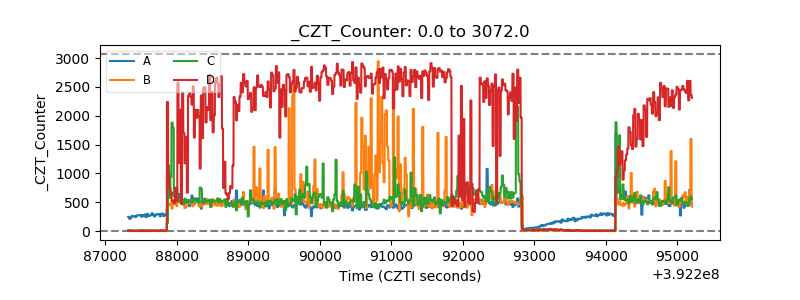 |
| +2.5 Volts monitor | 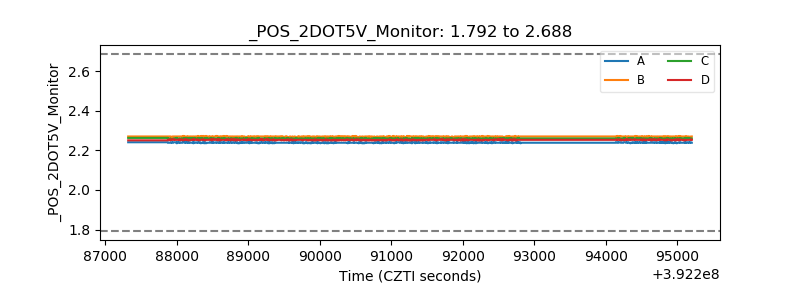 |
| +5 Volts monitor | 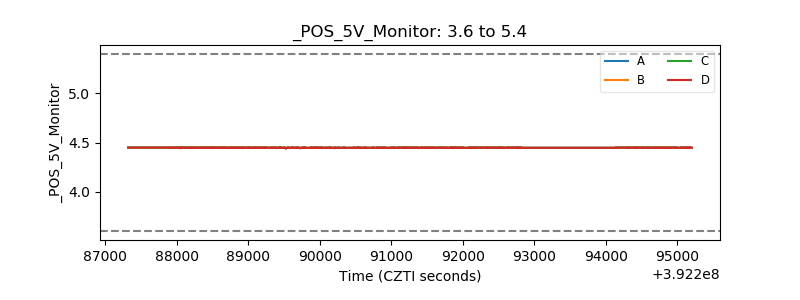 |
| _ROLL_ROT | 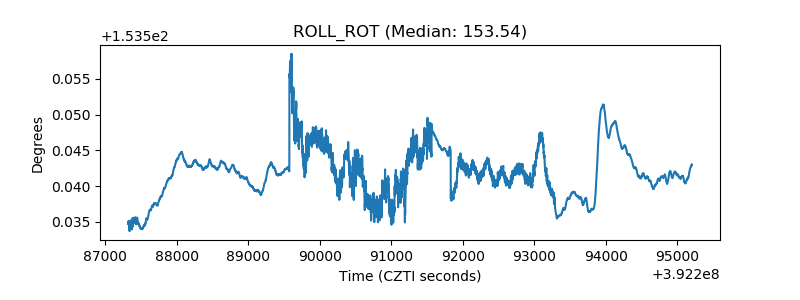 |
| _Roll_DEC | 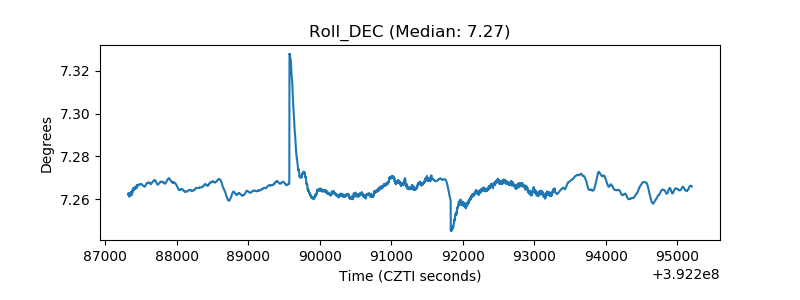 |
| _Roll_RA | 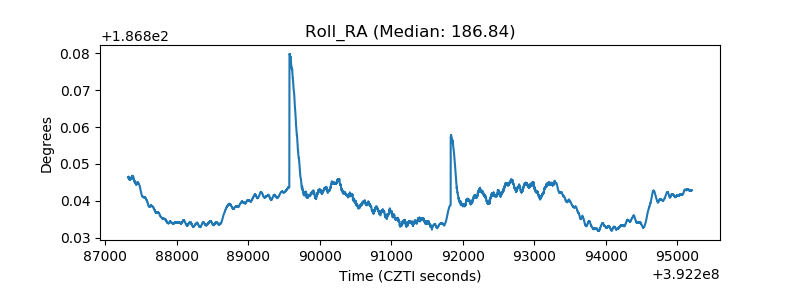 |
| Veto Counter | 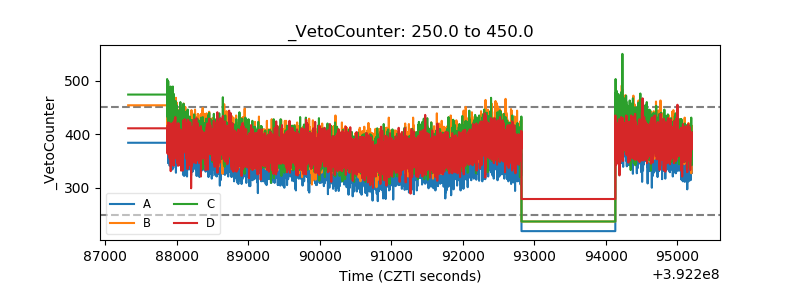 |