| Param | Original file | Final file |
|---|---|---|
| Filename | modeM0/AS1A10_071T50_9000005166_36178cztM0_level2.evt | modeM0/AS1A10_071T50_9000005166_36178cztM0_level2_quad_clean.evt |
| Size (bytes) | 500,970,240 | 66,061,440 |
| Size | 477.8 MB | 63.0 MB |
| Events in quadrant A | 2,722,061 | 419,406 |
| Events in quadrant B | 3,407,077 | 422,930 |
| Events in quadrant C | 3,377,245 | 415,971 |
| Events in quadrant D | 5,287,351 | 351,615 |
| Mode M0 | |||
|---|---|---|---|
| Quadrant | BADHDUFLAG | Total packets | Discarded packets |
| A | 0 | 11463 | 3 |
| B | 0 | 13709 | 2 |
| C | 0 | 13216 | 2 |
| D | 0 | 19389 | 2 |
| Mode M9 | |||
|---|---|---|---|
| Quadrant | BADHDUFLAG | Total packets | Discarded packets |
| A | 0 | 25 | 0 |
| B | 0 | 25 | 0 |
| C | 0 | 25 | 0 |
| D | 0 | 26 | 0 |
| Mode SS | |||
|---|---|---|---|
| Quadrant | BADHDUFLAG | Total packets | Discarded packets |
| A | 0 | 112 | 0 |
| B | 0 | 112 | 0 |
| C | 0 | 112 | 0 |
| D | 0 | 112 | 0 |
| Quadrant | Total seconds | Saturated seconds | Saturation percentage |
|---|---|---|---|
| A | 5580 | 6 | 0.107527% |
| B | 5580 | 137 | 2.455197% |
| C | 5580 | 79 | 1.415771% |
| D | 5580 | 833 | 14.928315% |
Noise dominated data is calculated using 1-second bins in cleaned event files. If a bin has >2000 counts, and if more than 50% of those come from <1% of pixels, then it is considered to be noise-dominated and hence unusable.
| Quadrant | # 1 sec bins | Bins with >0 counts | Bins with >2000 counts | High rate bins dominated by noise | Noise dominated (total time) | Noise dominated (detector-on time) | Marked lightcurve |
|---|---|---|---|---|---|---|---|
| A | 7073 | 5581 | 1 | 1 | 0.01% | 0.02% | 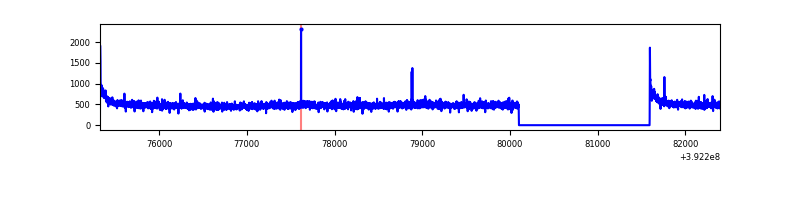 |
| B | 7073 | 5581 | 79 | 79 | 1.12% | 1.42% | 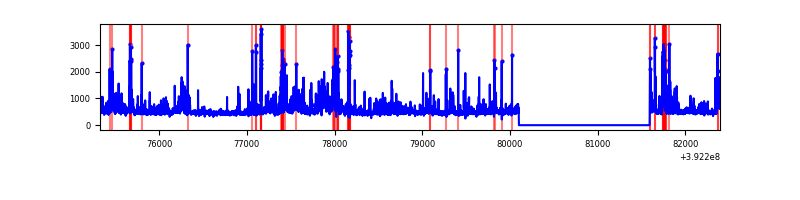 |
| C | 7073 | 5581 | 66 | 66 | 0.93% | 1.18% | 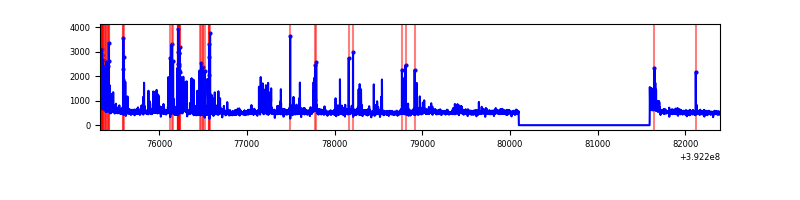 |
| D | 7073 | 5580 | 733 | 733 | 10.36% | 13.14% | 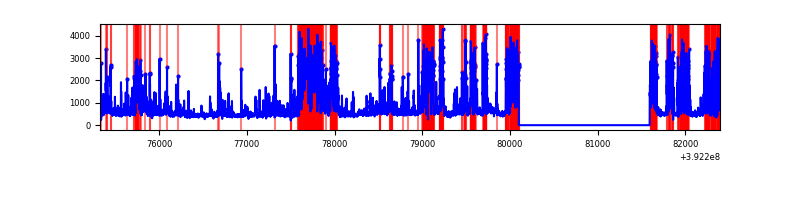 |
Top three noisy pixels from each quadrant. If the there are fewer than three noisy pixels in the level2.evt file, extra rows are filled as -1
| Pixel properties | Quadrant properties | ||||||
|---|---|---|---|---|---|---|---|
| Quadrant | DetID | PixID | Counts | Sigma | Mean | Median | Sigma |
| A | 10 | 83 | 176237 | 1334.05 | 646 | 632 | 131.6 |
| A | 8 | 144 | 30050 | 223.48 | 646 | 632 | 131.6 |
| A | 13 | 254 | 9735 | 69.15 | 646 | 632 | 131.6 |
| B | 5 | 236 | 378479 | 3042.26 | 637 | 619 | 124.2 |
| B | 5 | 172 | 304618 | 2447.59 | 637 | 619 | 124.2 |
| B | 0 | 213 | 77454 | 618.62 | 637 | 619 | 124.2 |
| C | 0 | 207 | 279447 | 1899.47 | 626 | 631 | 146.8 |
| C | 0 | 10 | 264309 | 1796.34 | 626 | 631 | 146.8 |
| C | 15 | 214 | 256099 | 1740.41 | 626 | 631 | 146.8 |
| D | 2 | 250 | 1706533 | 11921.36 | 581 | 565 | 143.1 |
| D | 12 | 235 | 775486 | 5415.18 | 581 | 565 | 143.1 |
| D | 13 | 249 | 221403 | 1543.22 | 581 | 565 | 143.1 |
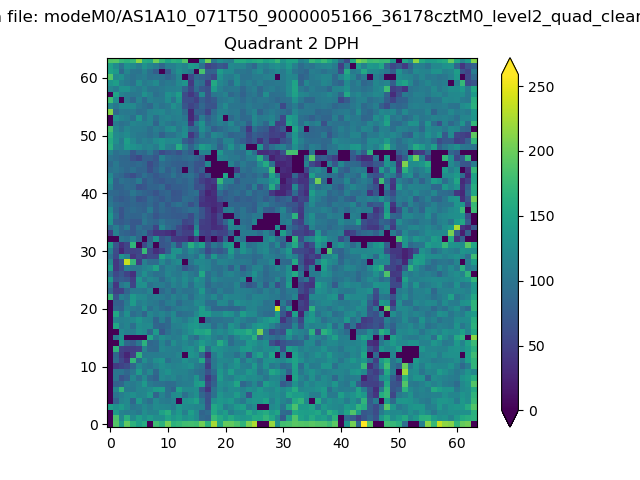
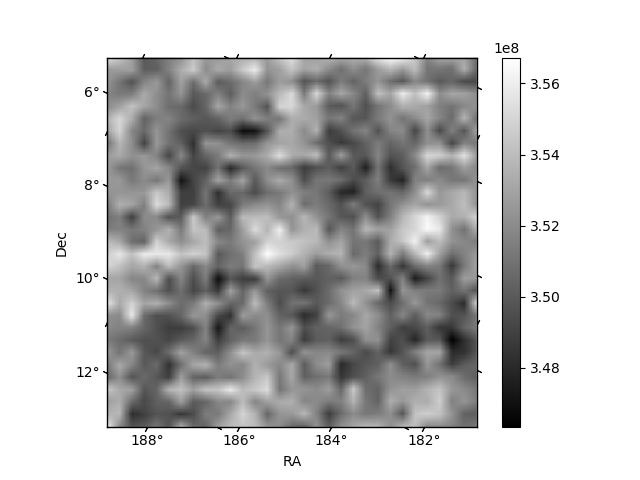
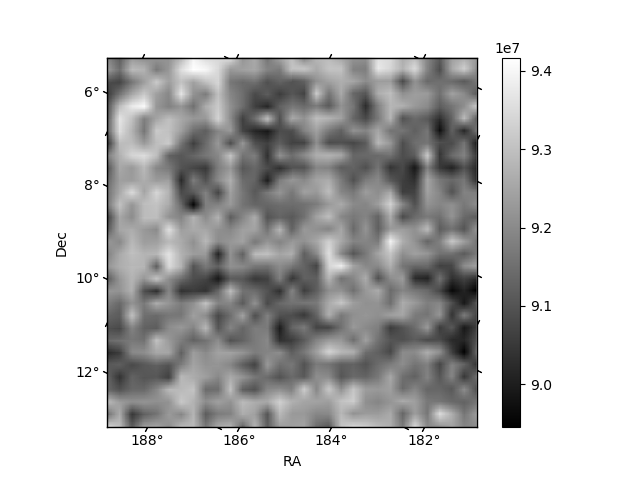
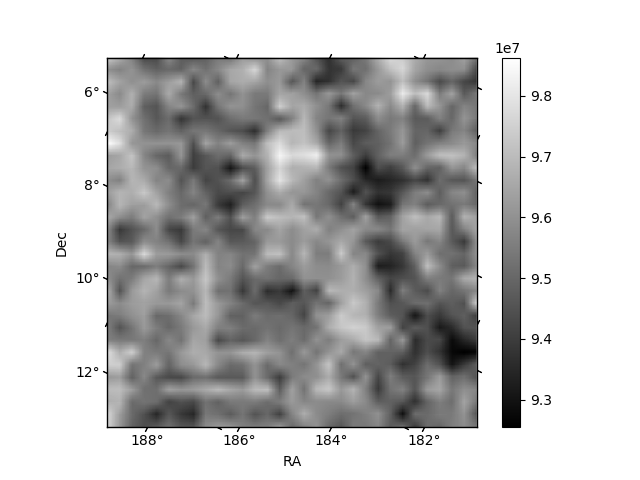
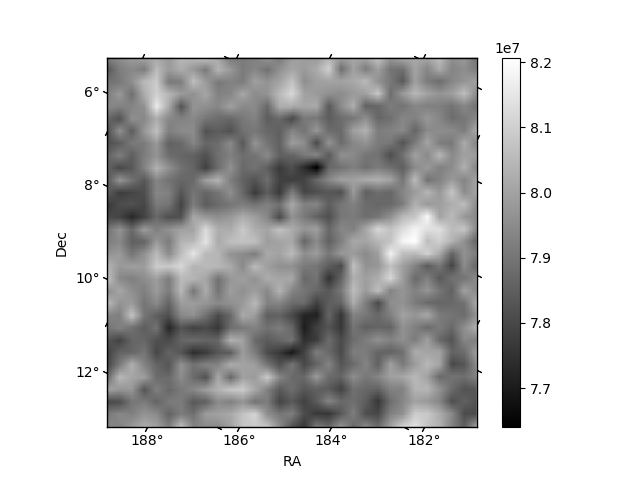
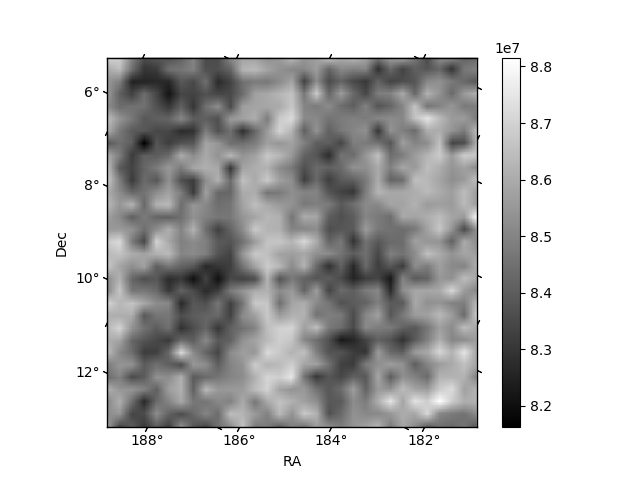
Histogram calculated using DETX and DETY for each event in the final _common_clean file
| Quadrant A | 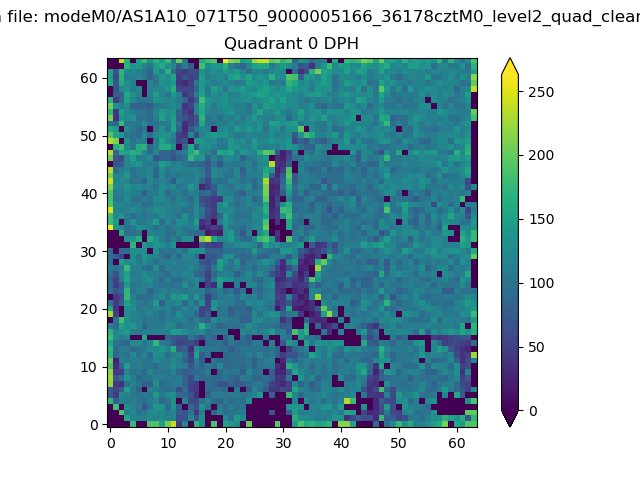 |
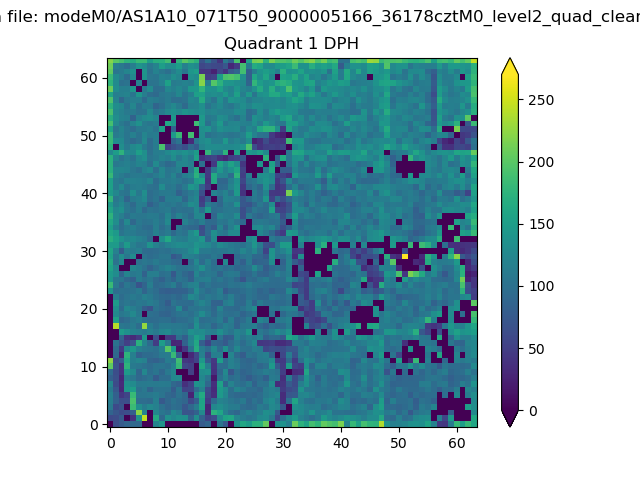 |
Quadrant B |
|---|---|---|---|
| Quadrant D | 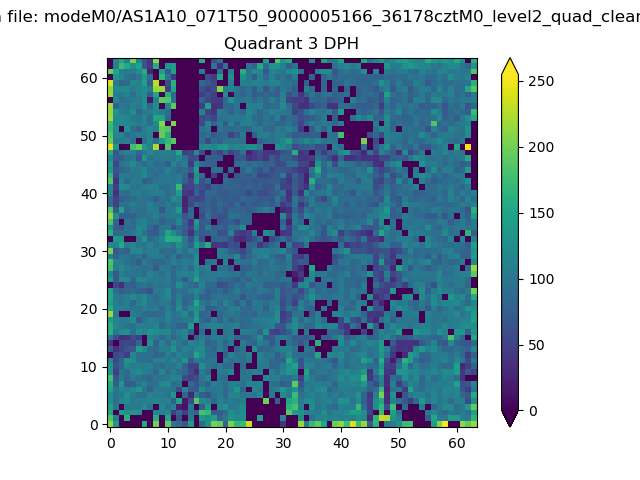 |
 |
Quadrant C |
| Plot type | Count rate plots | Images |
|---|---|---|
| Comparison with Poisson distribution Blue bars denote a histogram of data divided into 1 sec bins. Red curve is a Poisson curve with rate = median count rate of data. |
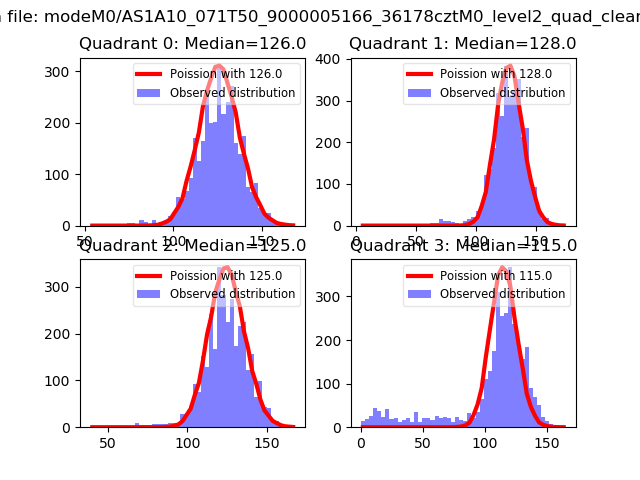 |
 |
| Quadrant-wise count rates Data is divided into 100 sec bins |
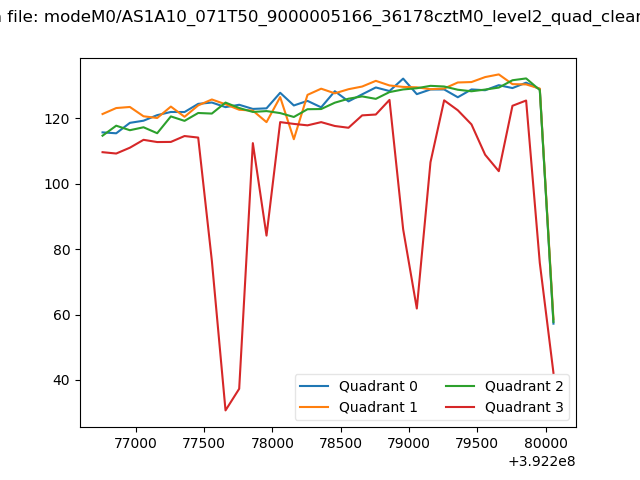 |
|
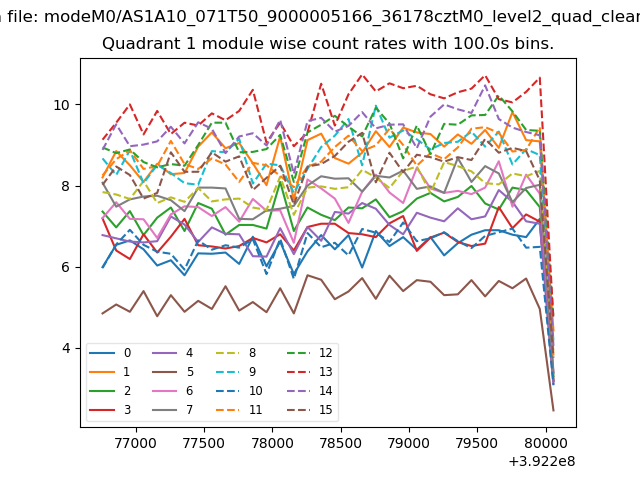
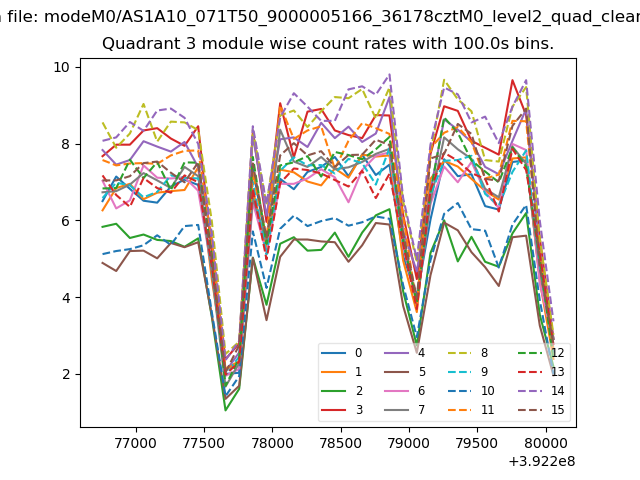
| Module-wise count rates for Quadrant A Data is divided into 100 sec bins |
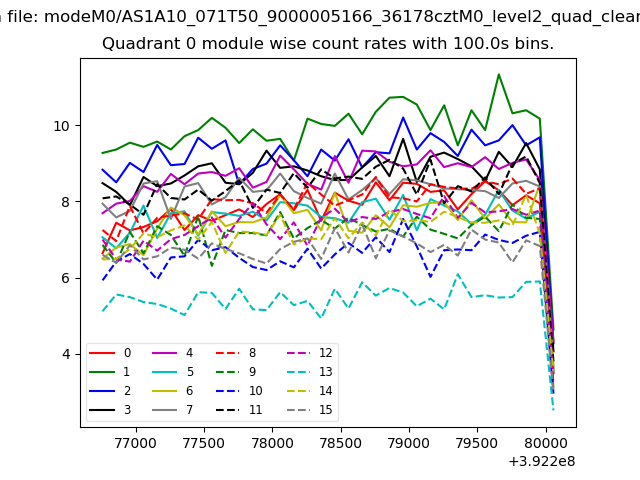 |
 |
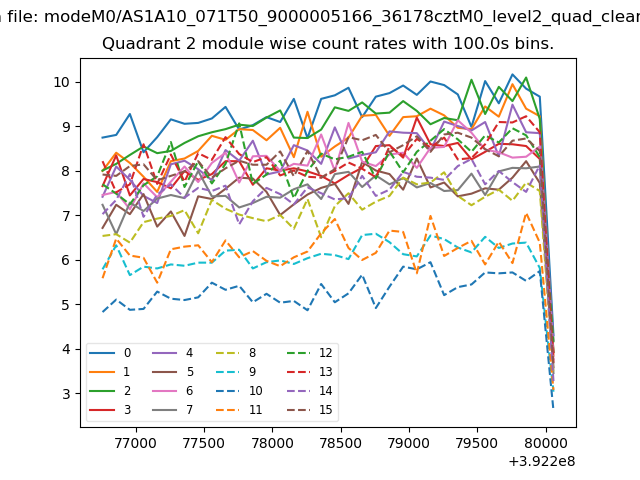
| Module-wise count rates for Quadrant B Data is divided into 100 sec bins |
 |
 |
| Module-wise count rates for Quadrant C Data is divided into 100 sec bins |
 |
 |
| Module-wise count rates for Quadrant D Data is divided into 100 sec bins |
 |
 |
| Parameter | Plot |
|---|---|
| CZT HV Monitor | 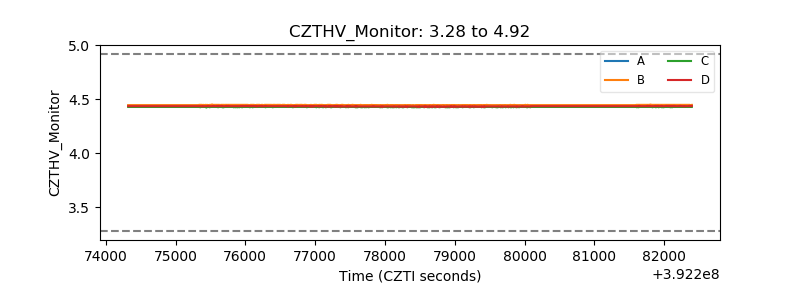 |
| D_VDD | 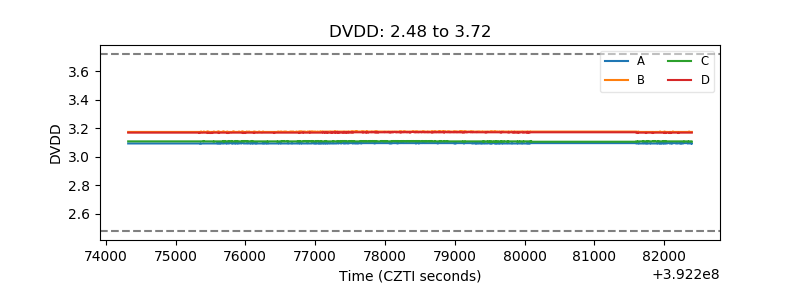 |
| Temperature 1 | 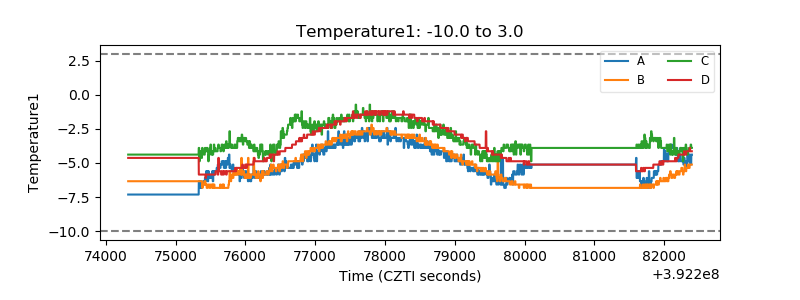 |
| Veto HV Monitor | 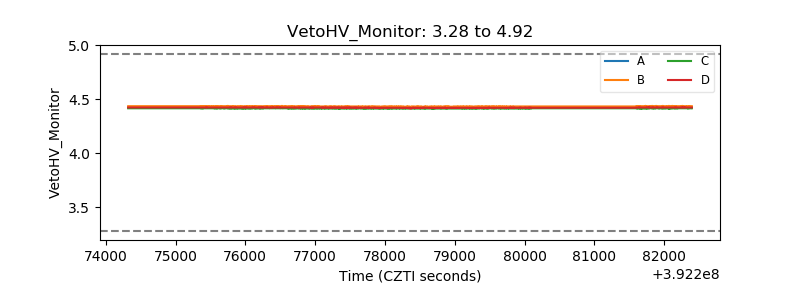 |
| Veto LLD | 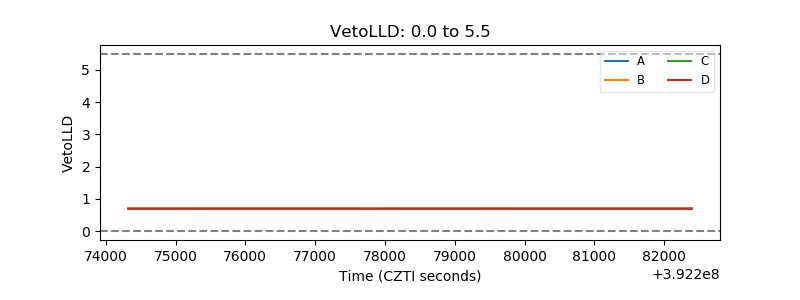 |
| Alpha Counter | 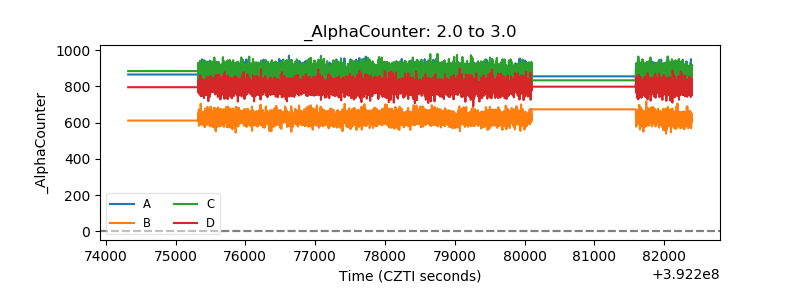 |
| _CPM_Rate | 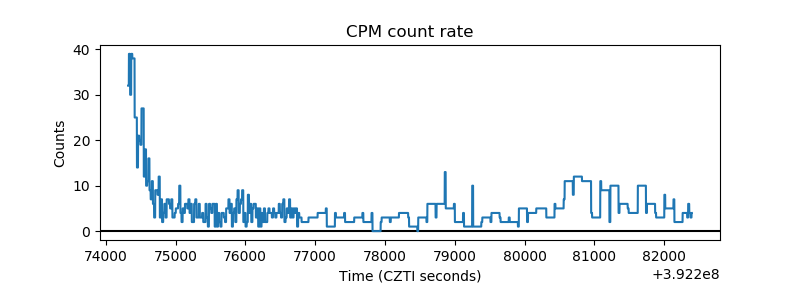 |
| CZT Counter | 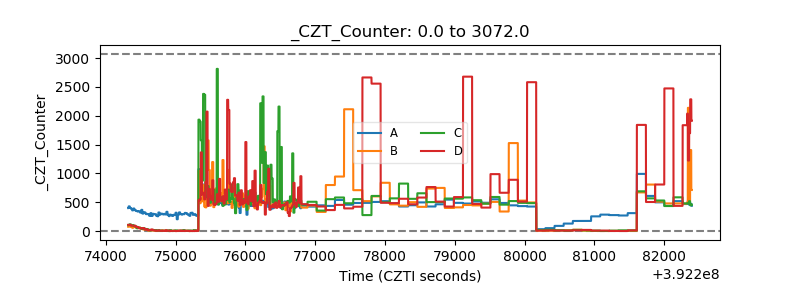 |
| +2.5 Volts monitor | 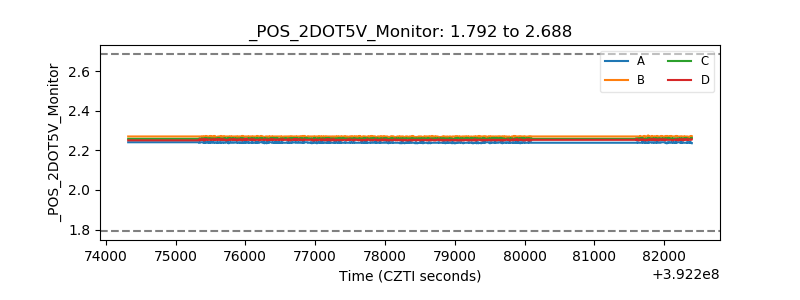 |
| +5 Volts monitor | 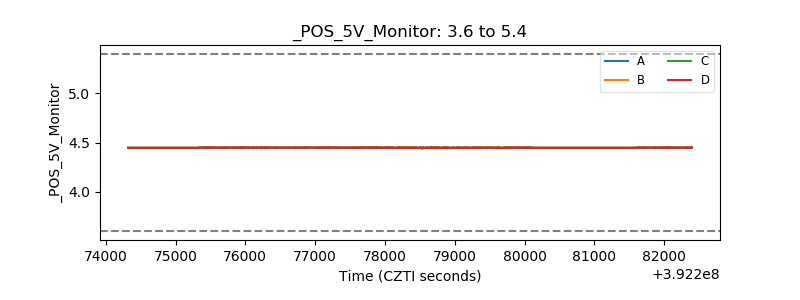 |
| _ROLL_ROT | 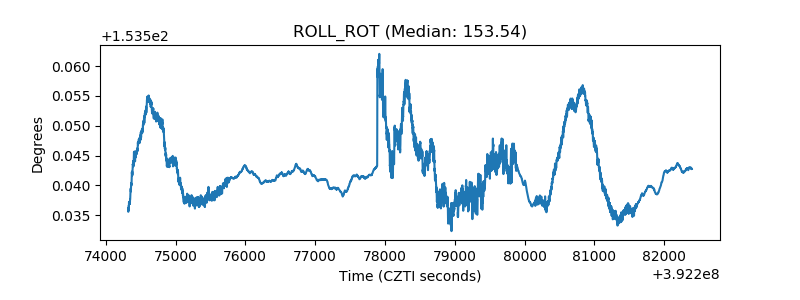 |
| _Roll_DEC | 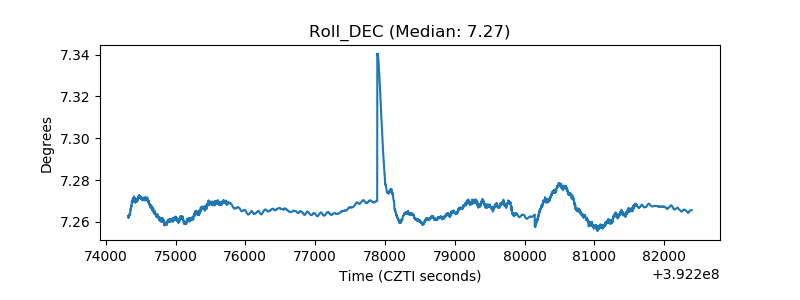 |
| _Roll_RA | 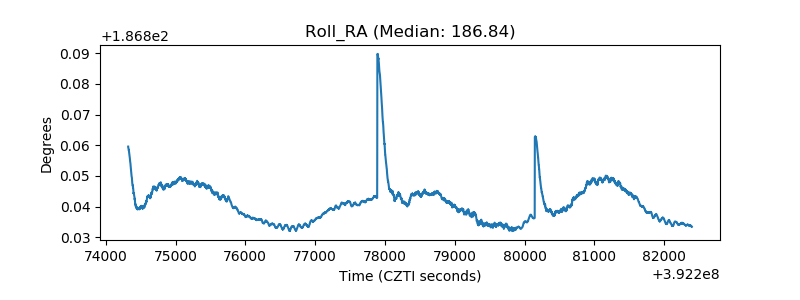 |
| Veto Counter | 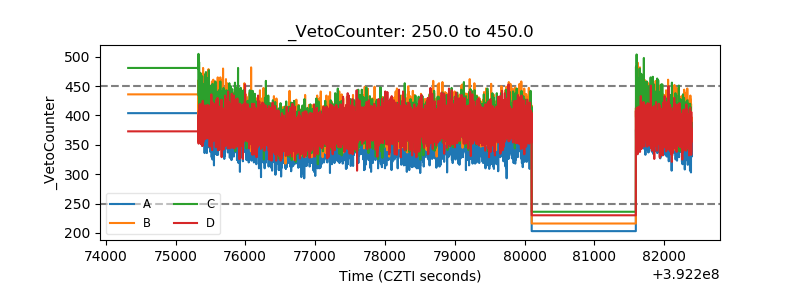 |