| Param | Original file | Final file |
|---|---|---|
| Filename | modeM0/AS1T05_009T05_9000005162_36174cztM0_level2.evt | modeM0/AS1T05_009T05_9000005162_36174cztM0_level2_quad_clean.evt |
| Size (bytes) | 246,430,080 | 62,017,920 |
| Size | 235.0 MB | 59.1 MB |
| Events in quadrant A | 1,420,471 | 416,097 |
| Events in quadrant B | 1,896,724 | 422,003 |
| Events in quadrant C | 2,198,018 | 423,266 |
| Events in quadrant D | 1,741,825 | 402,168 |
| Mode M9 | |||
|---|---|---|---|
| Quadrant | BADHDUFLAG | Total packets | Discarded packets |
| A | 0 | 17 | 0 |
| B | 0 | 17 | 0 |
| C | 0 | 17 | 0 |
| D | 0 | 18 | 0 |
| Mode SS | |||
|---|---|---|---|
| Quadrant | BADHDUFLAG | Total packets | Discarded packets |
| A | 0 | 60 | 0 |
| B | 0 | 60 | 0 |
| C | 0 | 60 | 0 |
| D | 0 | 60 | 0 |
| Mode M0 | |||
|---|---|---|---|
| Quadrant | BADHDUFLAG | Total packets | Discarded packets |
| A | 0 | 6254 | 1 |
| B | 0 | 7661 | 1 |
| C | 0 | 8394 | 1 |
| D | 0 | 7234 | 1 |
| Quadrant | Total seconds | Saturated seconds | Saturation percentage |
|---|---|---|---|
| A | 3010 | 6 | 0.199336% |
| B | 3010 | 94 | 3.122924% |
| C | 3010 | 173 | 5.747508% |
| D | 3010 | 53 | 1.760797% |
Noise dominated data is calculated using 1-second bins in cleaned event files. If a bin has >2000 counts, and if more than 50% of those come from <1% of pixels, then it is considered to be noise-dominated and hence unusable.
| Quadrant | # 1 sec bins | Bins with >0 counts | Bins with >2000 counts | High rate bins dominated by noise | Noise dominated (total time) | Noise dominated (detector-on time) | Marked lightcurve |
|---|---|---|---|---|---|---|---|
| A | 3010 | 3010 | 0 | 0 | 0.00% | 0.00% | 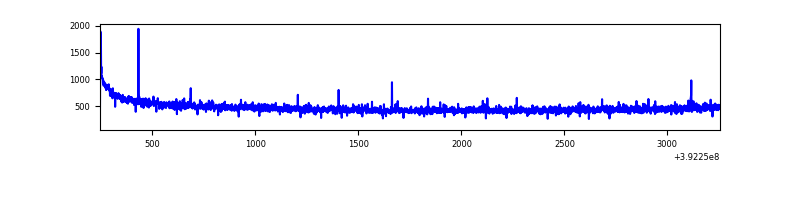 |
| B | 3010 | 3010 | 65 | 65 | 2.16% | 2.16% | 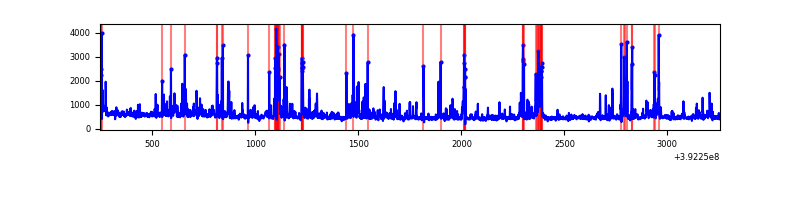 |
| C | 3010 | 3010 | 166 | 166 | 5.51% | 5.51% | 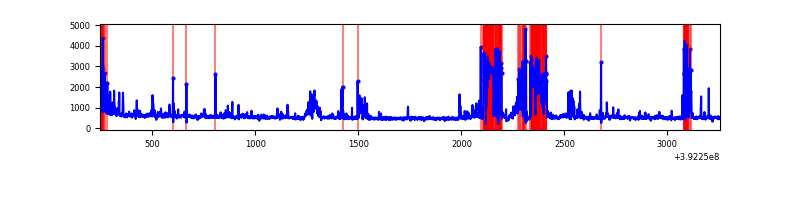 |
| D | 3010 | 3010 | 43 | 43 | 1.43% | 1.43% | 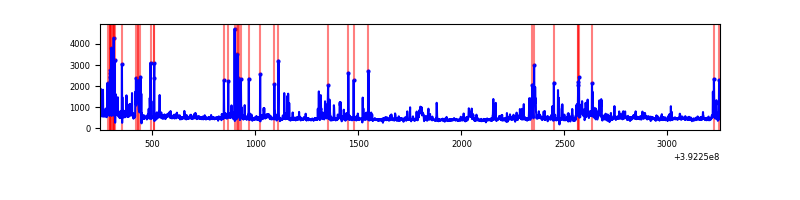 |
Top three noisy pixels from each quadrant. If the there are fewer than three noisy pixels in the level2.evt file, extra rows are filled as -1
| Pixel properties | Quadrant properties | ||||||
|---|---|---|---|---|---|---|---|
| Quadrant | DetID | PixID | Counts | Sigma | Mean | Median | Sigma |
| A | 10 | 83 | 90691 | 1299.49 | 340 | 334 | 69.5 |
| A | 9 | 143 | 6939 | 94.99 | 340 | 334 | 69.5 |
| A | 13 | 254 | 5639 | 76.3 | 340 | 334 | 69.5 |
| B | 5 | 172 | 363567 | 5571.78 | 342 | 335 | 65.2 |
| B | 4 | 171 | 127111 | 1944.67 | 342 | 335 | 65.2 |
| B | 0 | 190 | 29571 | 448.46 | 342 | 335 | 65.2 |
| C | 15 | 208 | 482300 | 6219.2 | 335 | 337 | 77.5 |
| C | 15 | 214 | 132875 | 1710.26 | 335 | 337 | 77.5 |
| C | 1 | 23 | 125542 | 1615.63 | 335 | 337 | 77.5 |
| D | 13 | 249 | 187011 | 2336.05 | 330 | 322 | 79.9 |
| D | 12 | 6 | 105349 | 1314.21 | 330 | 322 | 79.9 |
| D | 13 | 171 | 59935 | 745.94 | 330 | 322 | 79.9 |
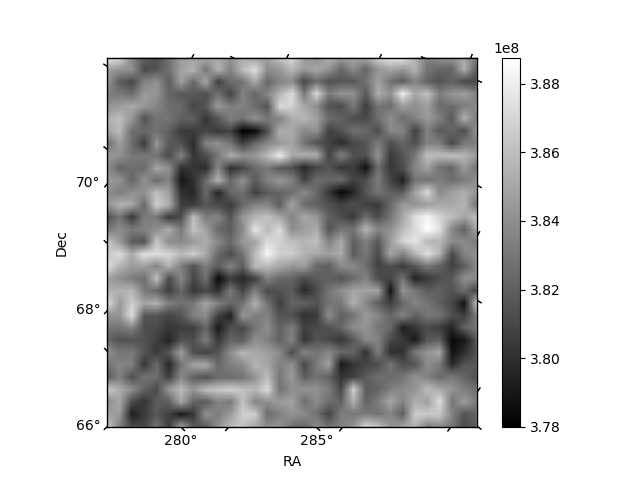
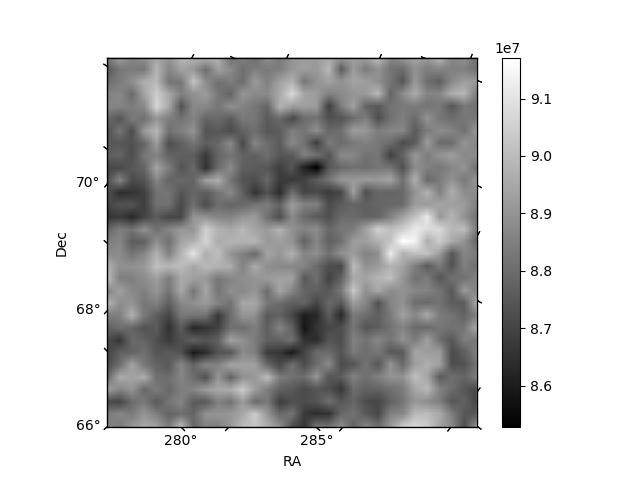
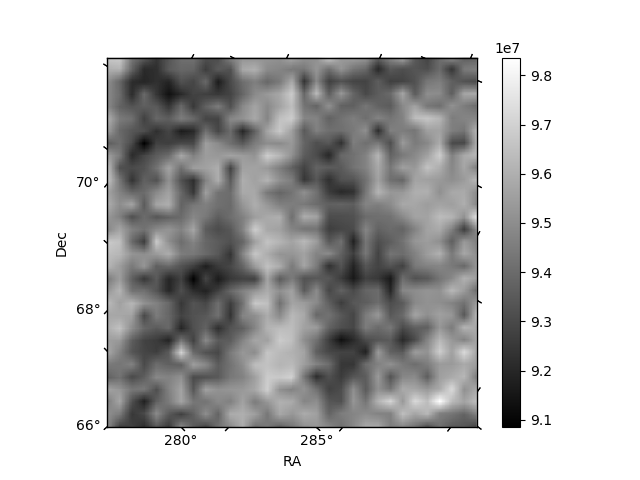
Histogram calculated using DETX and DETY for each event in the final _common_clean file
| Quadrant A | 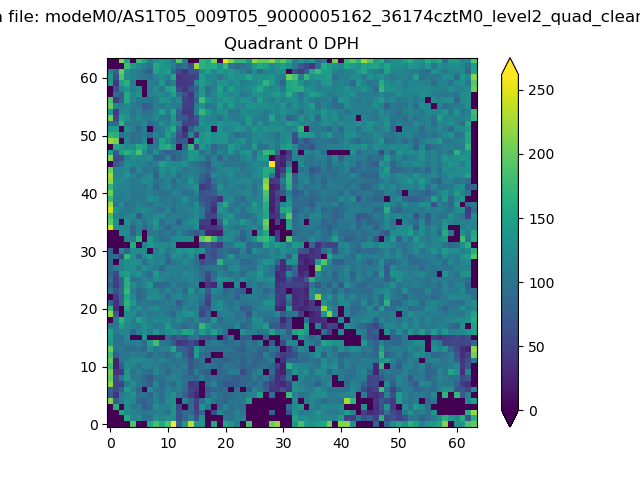 |
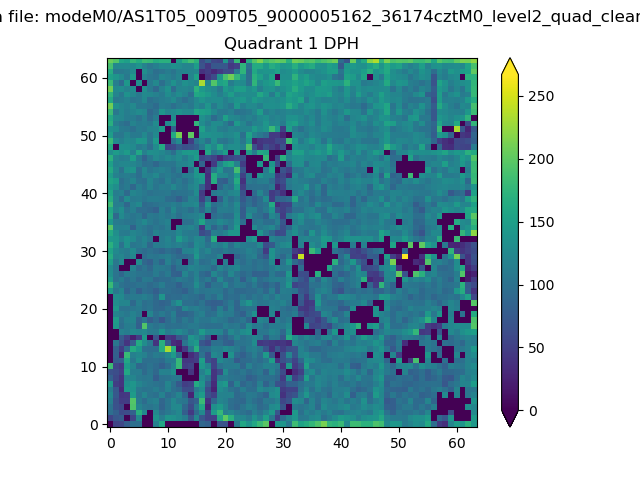 |
Quadrant B |
|---|---|---|---|
| Quadrant D | 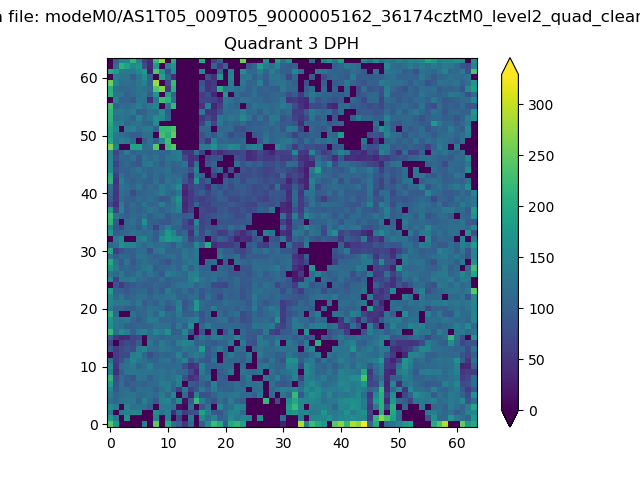 |
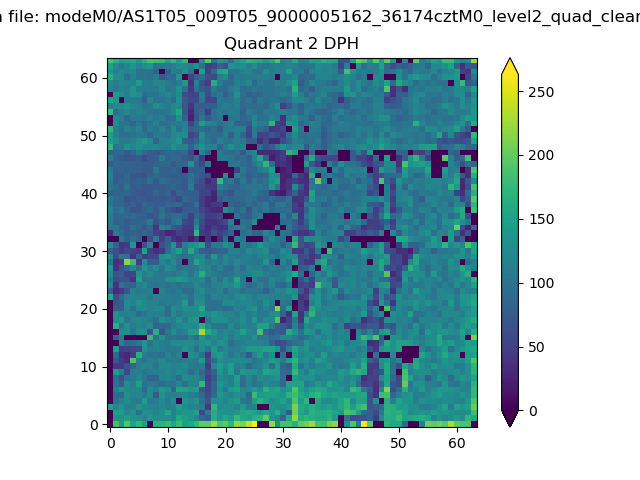 |
Quadrant C |
| Plot type | Count rate plots | Images |
|---|---|---|
| Comparison with Poisson distribution Blue bars denote a histogram of data divided into 1 sec bins. Red curve is a Poisson curve with rate = median count rate of data. |
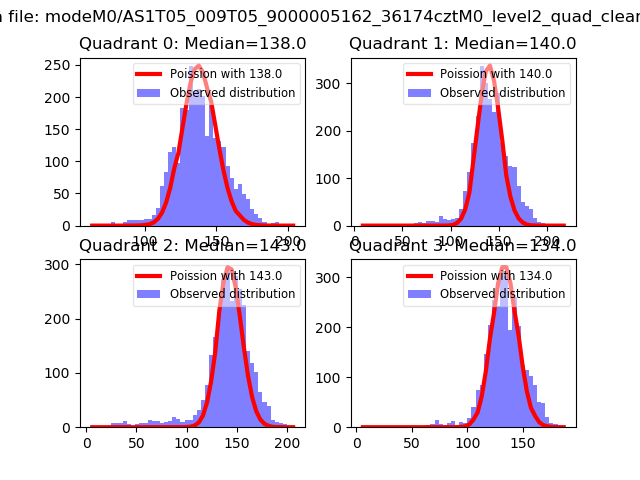 |
 |
| Quadrant-wise count rates Data is divided into 100 sec bins |
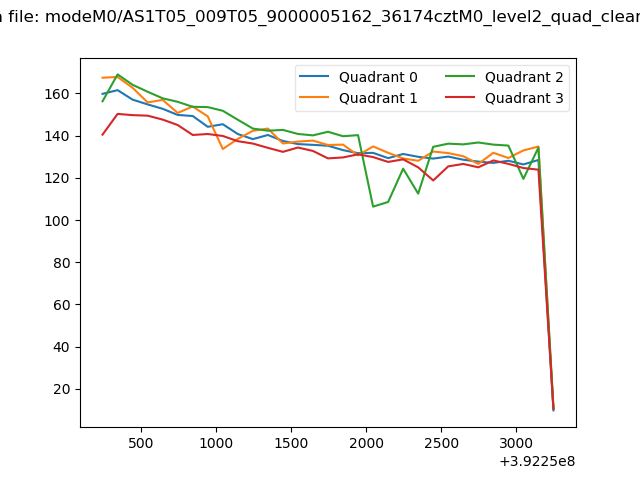 |
|
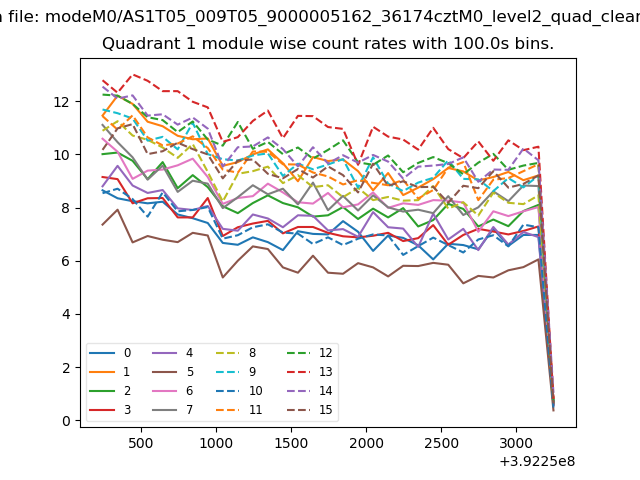
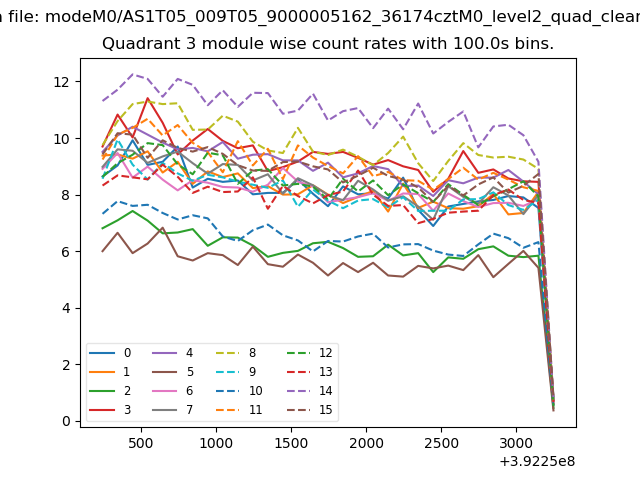
| Module-wise count rates for Quadrant A Data is divided into 100 sec bins |
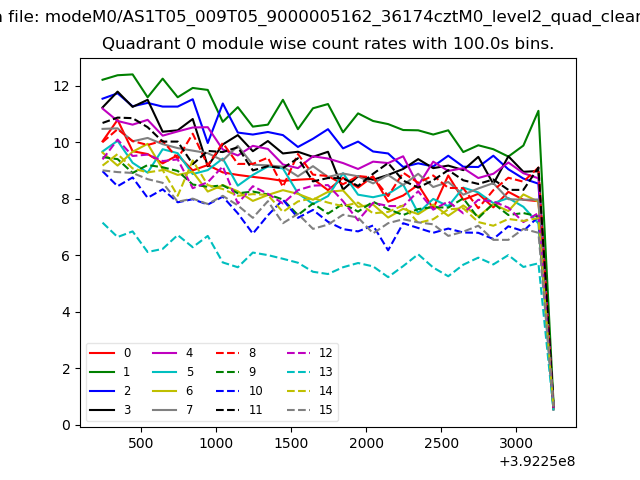 |
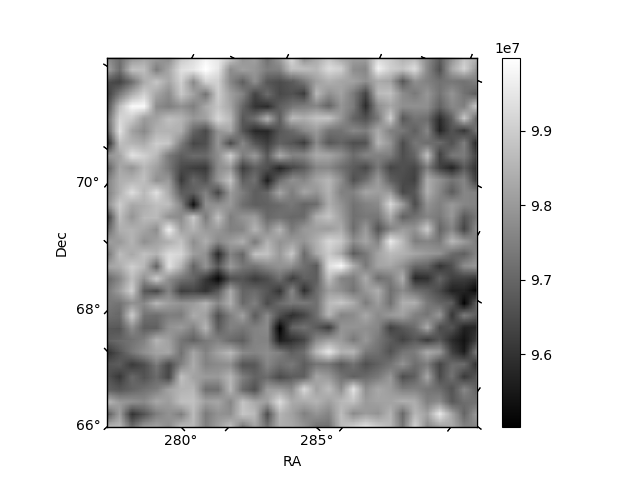 |
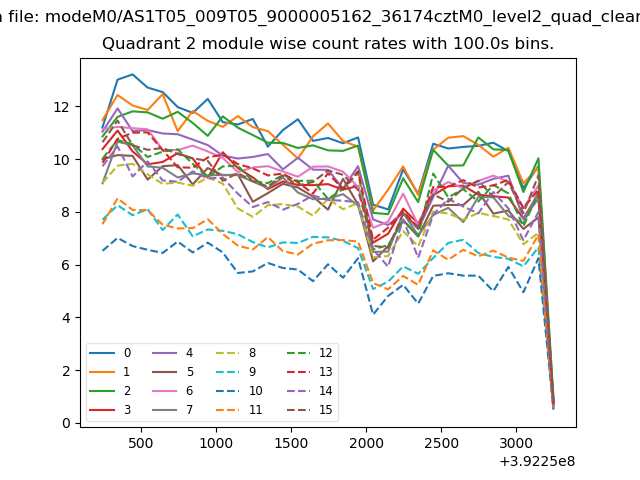
| Module-wise count rates for Quadrant B Data is divided into 100 sec bins |
 |
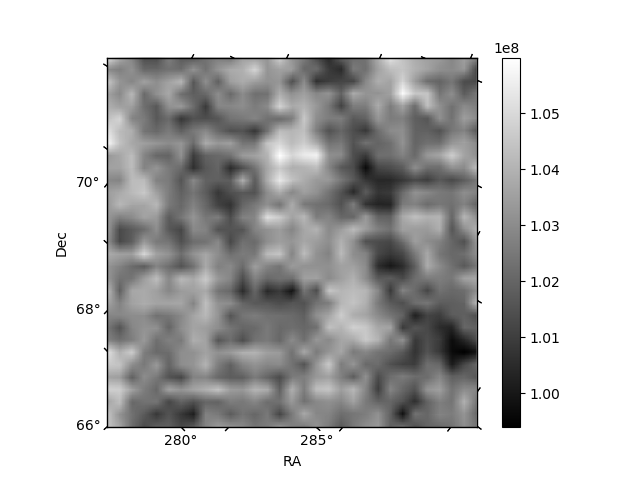 |
| Module-wise count rates for Quadrant C Data is divided into 100 sec bins |
 |
 |
| Module-wise count rates for Quadrant D Data is divided into 100 sec bins |
 |
 |
| Parameter | Plot |
|---|---|
| CZT HV Monitor | 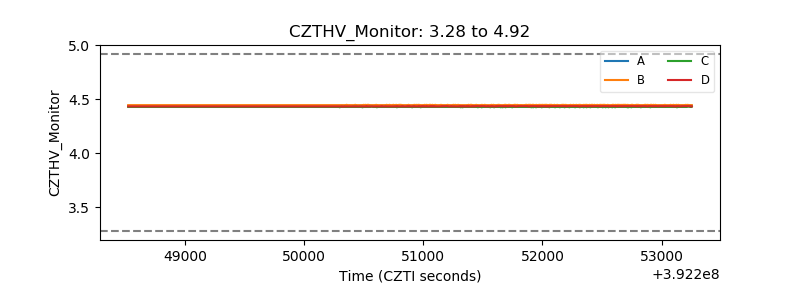 |
| D_VDD | 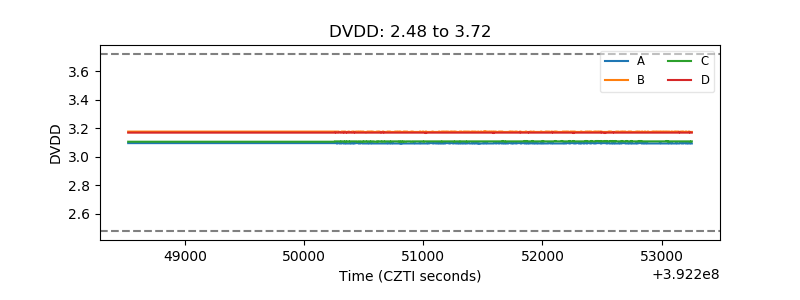 |
| Temperature 1 | 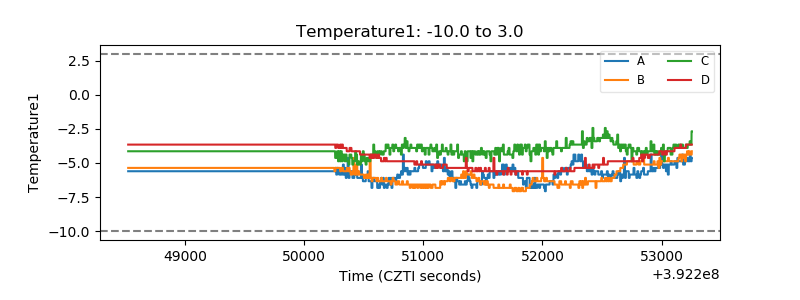 |
| Veto HV Monitor | 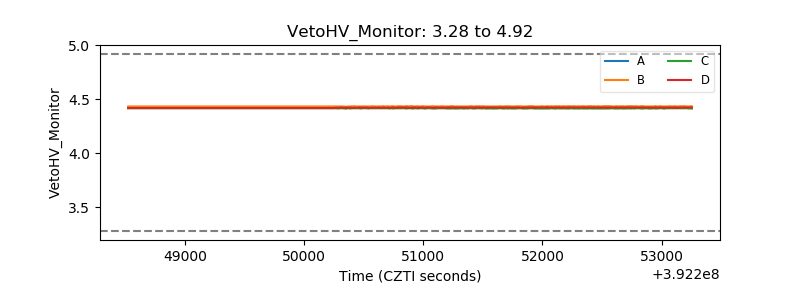 |
| Veto LLD | 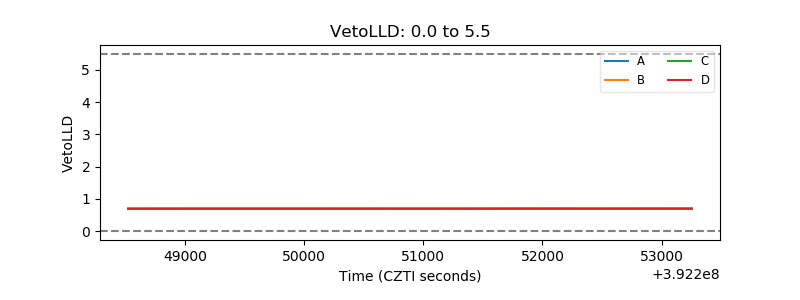 |
| Alpha Counter | 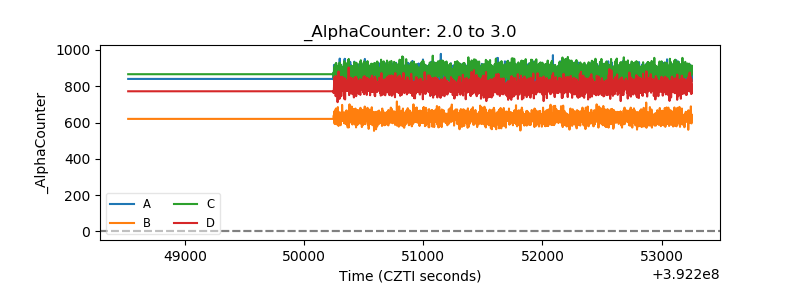 |
| _CPM_Rate | 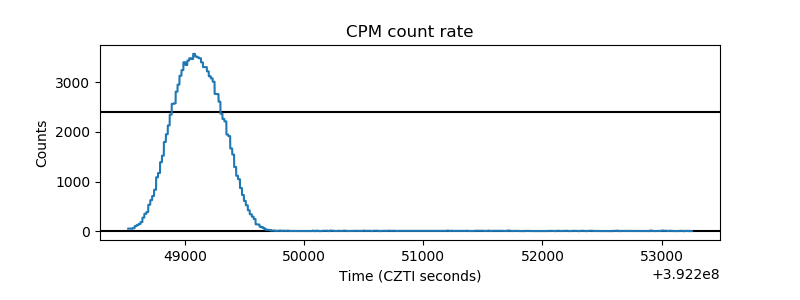 |
| CZT Counter | 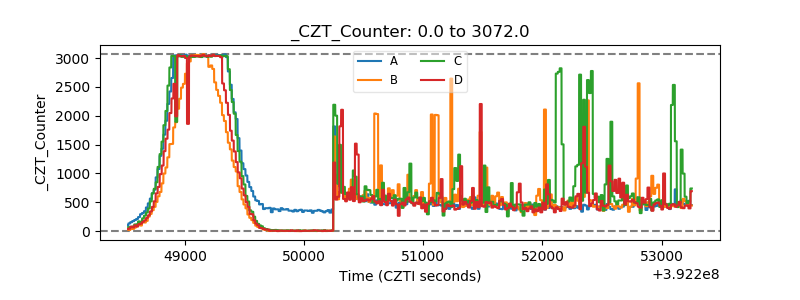 |
| +2.5 Volts monitor | 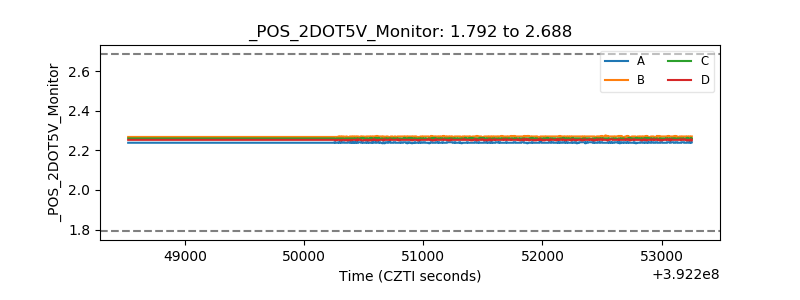 |
| +5 Volts monitor | 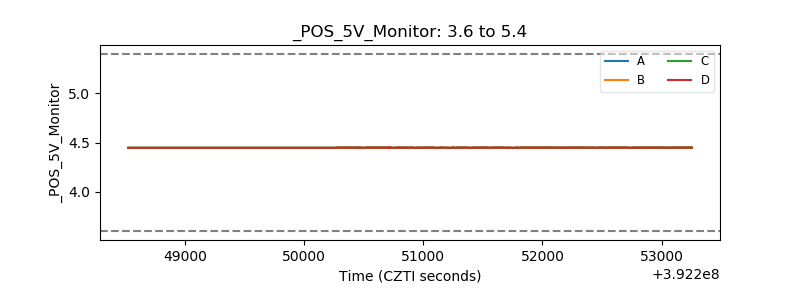 |
| _ROLL_ROT | 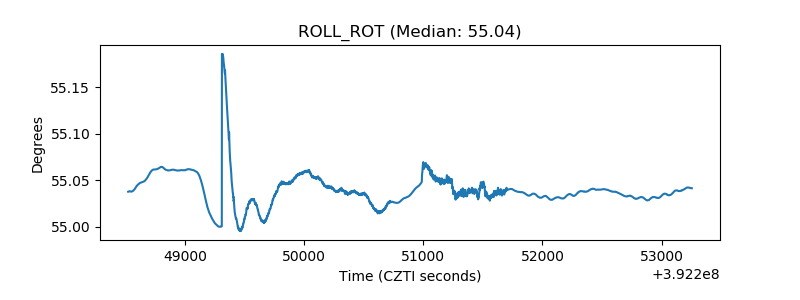 |
| _Roll_DEC | 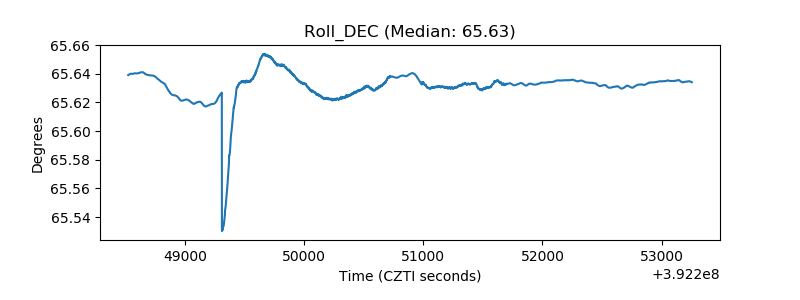 |
| _Roll_RA | 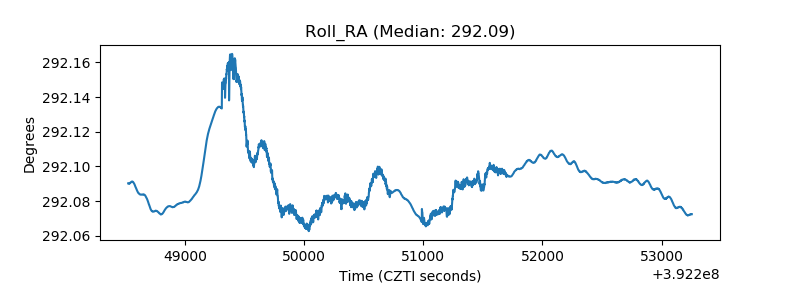 |
| Veto Counter | 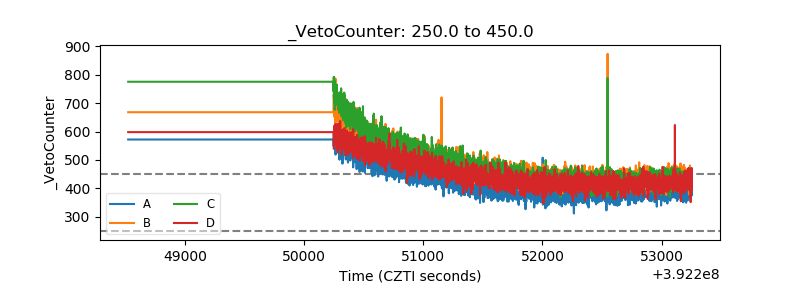 |