| Param | Original file | Final file |
|---|---|---|
| Filename | modeM0/AS1T05_009T03_9000005164_36174cztM0_level2.evt | modeM0/AS1T05_009T03_9000005164_36174cztM0_level2_quad_clean.evt |
| Size (bytes) | 144,446,400 | 20,018,880 |
| Size | 137.8 MB | 19.1 MB |
| Events in quadrant A | 891,544 | 120,301 |
| Events in quadrant B | 1,273,792 | 121,777 |
| Events in quadrant C | 1,072,791 | 123,085 |
| Events in quadrant D | 1,018,774 | 115,786 |
| Mode M9 | |||
|---|---|---|---|
| Quadrant | BADHDUFLAG | Total packets | Discarded packets |
| A | 0 | 20 | 0 |
| B | 0 | 20 | 0 |
| C | 0 | 20 | 0 |
| D | 0 | 20 | 0 |
| Mode M0 | |||
|---|---|---|---|
| Quadrant | BADHDUFLAG | Total packets | Discarded packets |
| A | 0 | 3610 | 2 |
| B | 0 | 4912 | 1 |
| C | 0 | 4190 | 1 |
| D | 0 | 4082 | 1 |
| Mode SS | |||
|---|---|---|---|
| Quadrant | BADHDUFLAG | Total packets | Discarded packets |
| A | 0 | 38 | 0 |
| B | 0 | 38 | 0 |
| C | 0 | 38 | 0 |
| D | 0 | 38 | 0 |
| Quadrant | Total seconds | Saturated seconds | Saturation percentage |
|---|---|---|---|
| A | 1688 | 2 | 0.118483% |
| B | 1688 | 85 | 5.035545% |
| C | 1688 | 27 | 1.599526% |
| D | 1688 | 39 | 2.310427% |
Noise dominated data is calculated using 1-second bins in cleaned event files. If a bin has >2000 counts, and if more than 50% of those come from <1% of pixels, then it is considered to be noise-dominated and hence unusable.
| Quadrant | # 1 sec bins | Bins with >0 counts | Bins with >2000 counts | High rate bins dominated by noise | Noise dominated (total time) | Noise dominated (detector-on time) | Marked lightcurve |
|---|---|---|---|---|---|---|---|
| A | 3781 | 1689 | 0 | 0 | 0.00% | 0.00% | 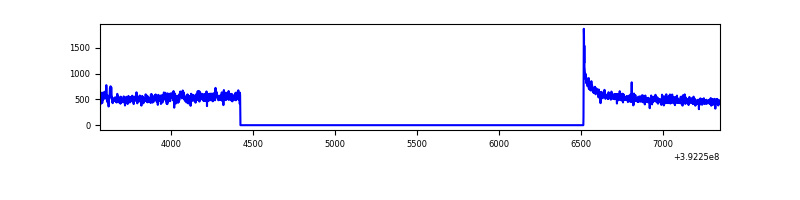 |
| B | 3781 | 1689 | 49 | 49 | 1.30% | 2.90% | 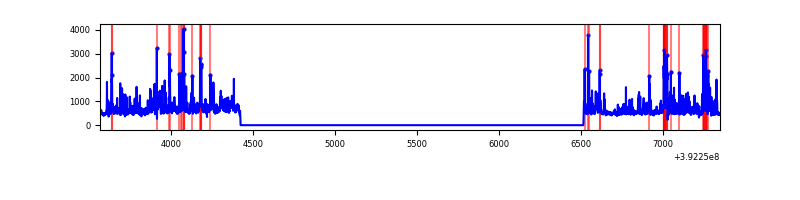 |
| C | 3781 | 1689 | 21 | 21 | 0.56% | 1.24% | 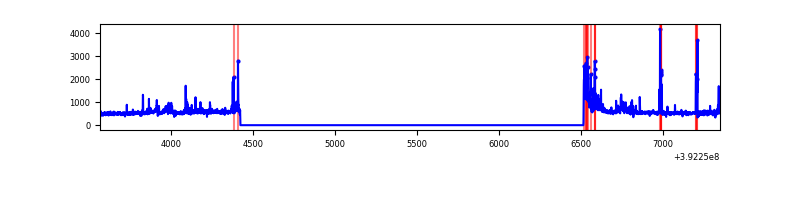 |
| D | 3781 | 1689 | 30 | 30 | 0.79% | 1.78% | 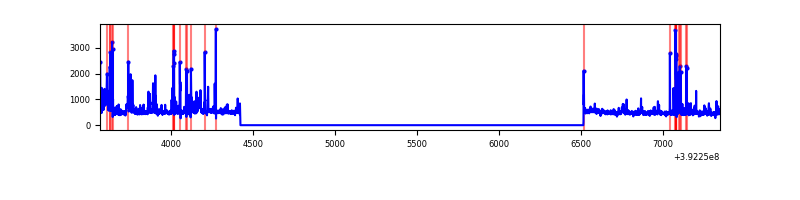 |
Top three noisy pixels from each quadrant. If the there are fewer than three noisy pixels in the level2.evt file, extra rows are filled as -1
| Pixel properties | Quadrant properties | ||||||
|---|---|---|---|---|---|---|---|
| Quadrant | DetID | PixID | Counts | Sigma | Mean | Median | Sigma |
| A | 10 | 83 | 71812 | 1675.68 | 207 | 203 | 42.7 |
| A | 8 | 144 | 9626 | 220.5 | 207 | 203 | 42.7 |
| A | 9 | 143 | 6680 | 151.56 | 207 | 203 | 42.7 |
| B | 4 | 171 | 211630 | 5221.56 | 205 | 200 | 40.5 |
| B | 5 | 172 | 175701 | 4334.24 | 205 | 200 | 40.5 |
| B | 0 | 213 | 33131 | 813.28 | 205 | 200 | 40.5 |
| C | 15 | 208 | 103239 | 2135.08 | 203 | 204 | 48.3 |
| C | 15 | 214 | 78773 | 1628.1 | 203 | 204 | 48.3 |
| C | 0 | 10 | 71511 | 1477.62 | 203 | 204 | 48.3 |
| D | 13 | 249 | 122095 | 2466.9 | 199 | 193 | 49.4 |
| D | 10 | 118 | 44760 | 901.89 | 199 | 193 | 49.4 |
| D | 13 | 171 | 18610 | 372.7 | 199 | 193 | 49.4 |
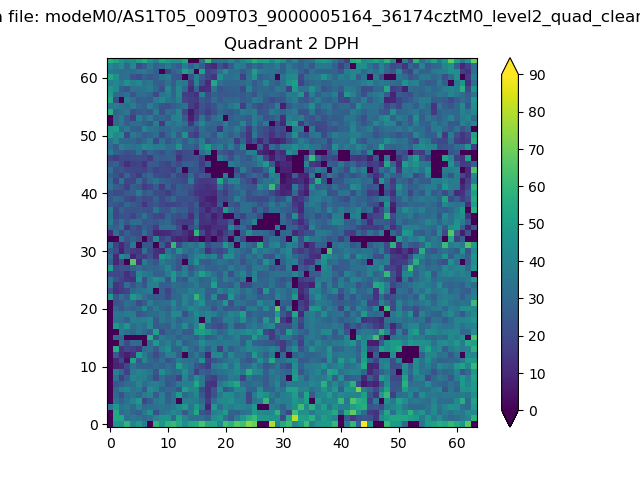
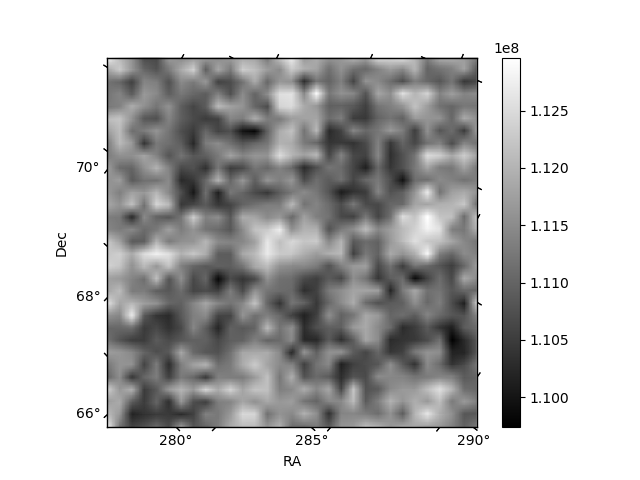
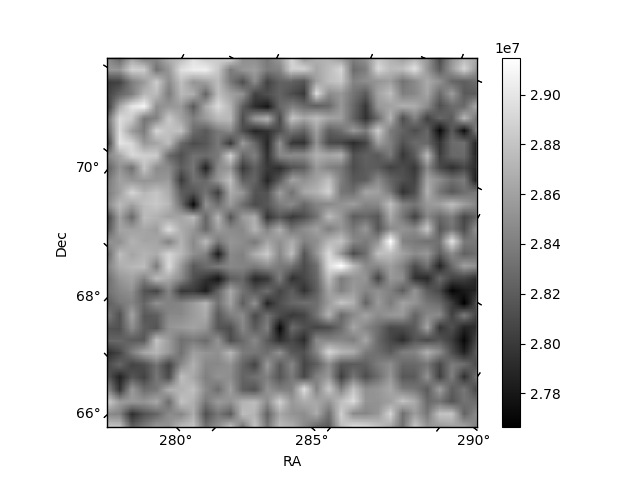
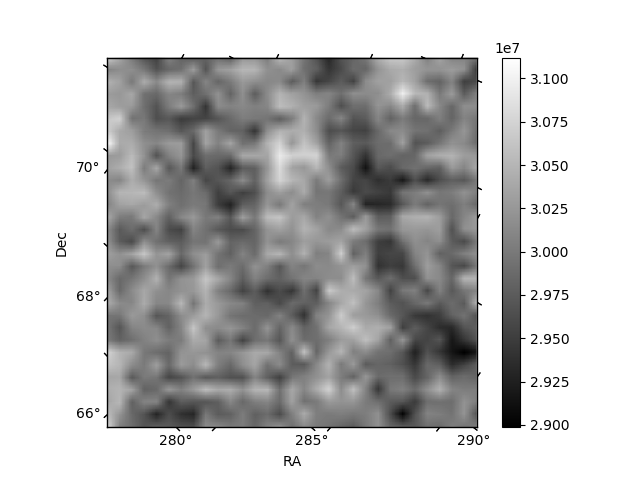
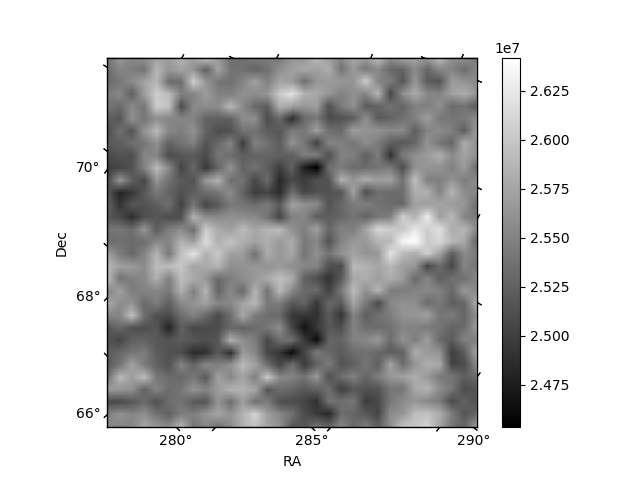
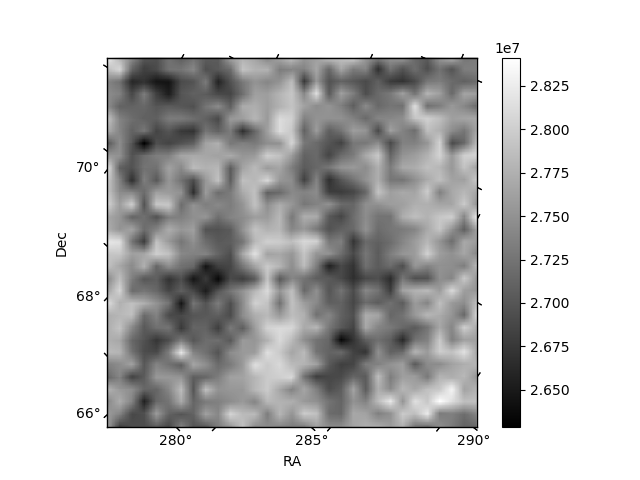
Histogram calculated using DETX and DETY for each event in the final _common_clean file
| Quadrant A | 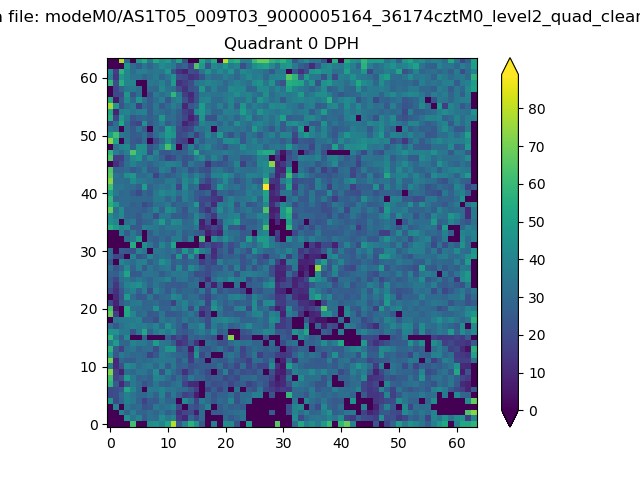 |
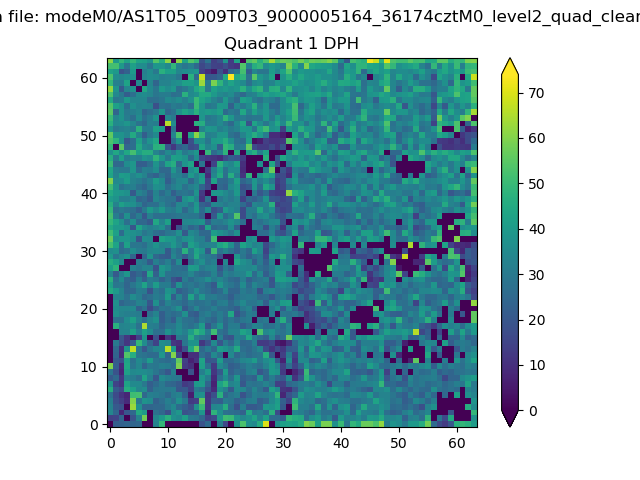 |
Quadrant B |
|---|---|---|---|
| Quadrant D | 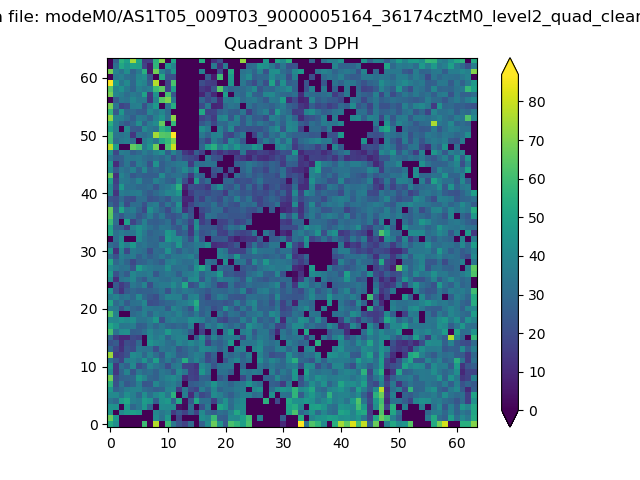 |
 |
Quadrant C |
| Plot type | Count rate plots | Images |
|---|---|---|
| Comparison with Poisson distribution Blue bars denote a histogram of data divided into 1 sec bins. Red curve is a Poisson curve with rate = median count rate of data. |
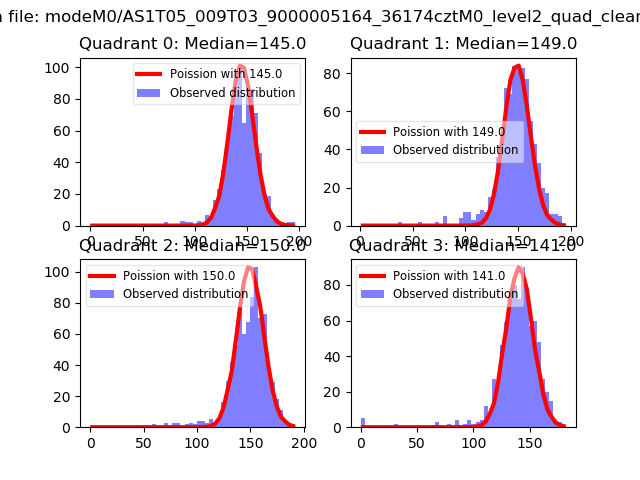 |
 |
| Quadrant-wise count rates Data is divided into 100 sec bins |
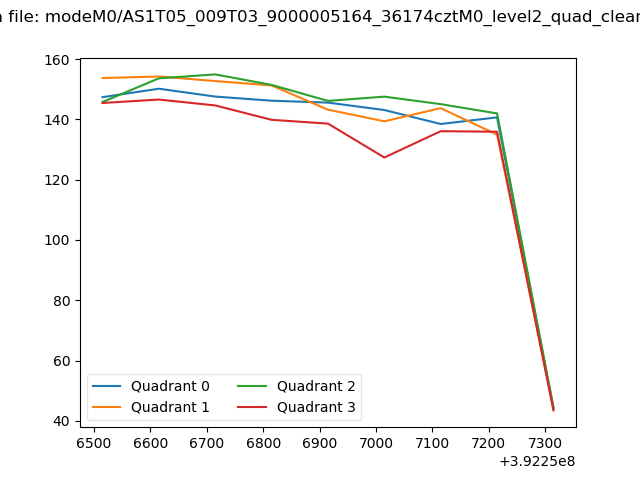 |
|
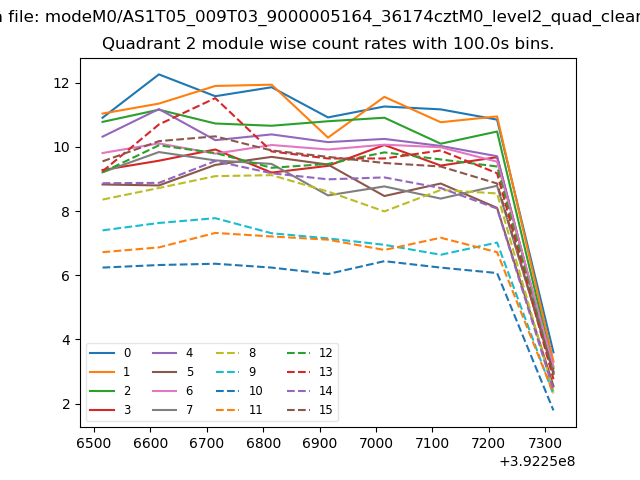
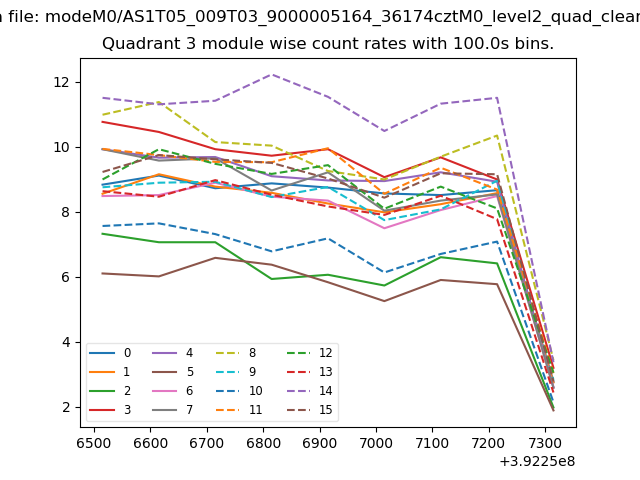
| Module-wise count rates for Quadrant A Data is divided into 100 sec bins |
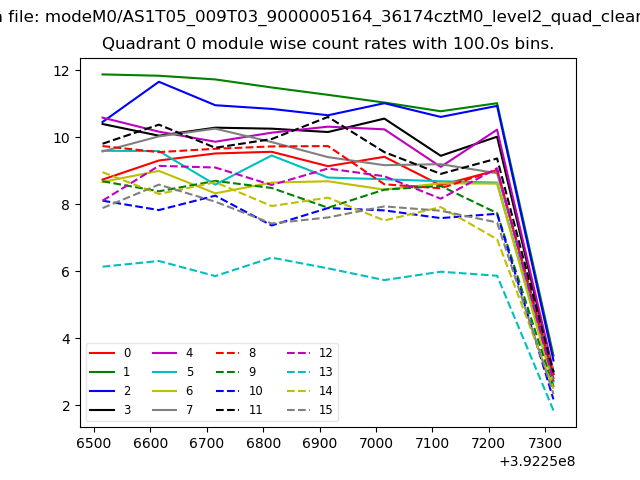 |
 |
| Module-wise count rates for Quadrant B Data is divided into 100 sec bins |
 |
 |
| Module-wise count rates for Quadrant C Data is divided into 100 sec bins |
 |
 |
| Module-wise count rates for Quadrant D Data is divided into 100 sec bins |
 |
 |
| Parameter | Plot |
|---|---|
| CZT HV Monitor | 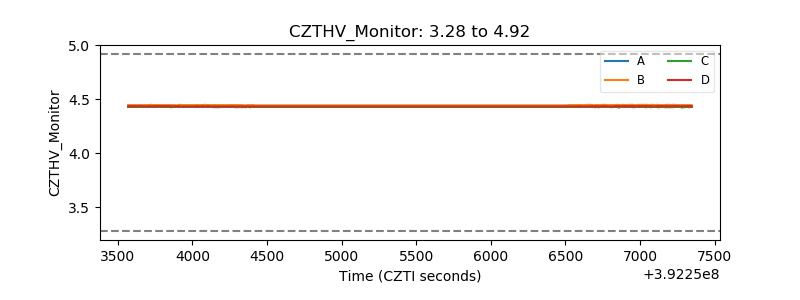 |
| D_VDD | 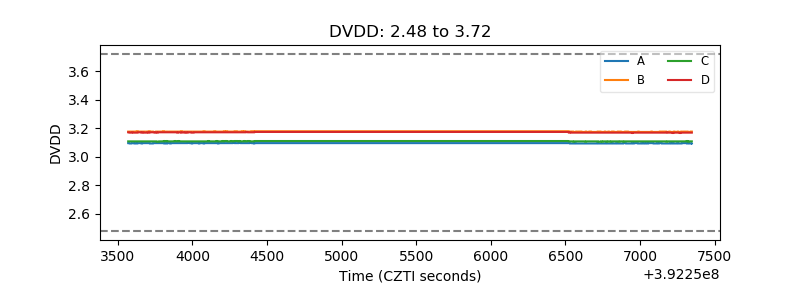 |
| Temperature 1 | 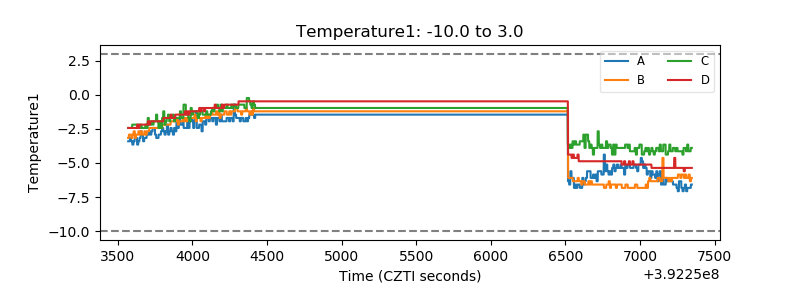 |
| Veto HV Monitor | 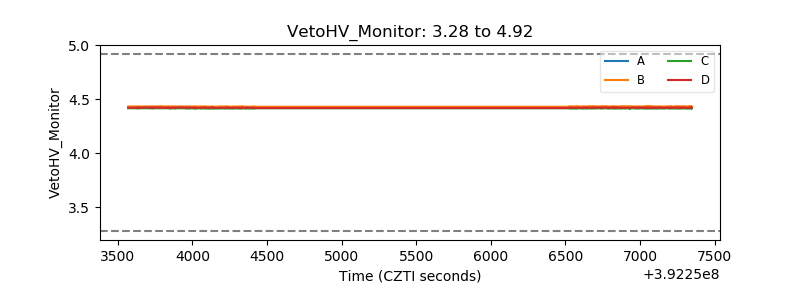 |
| Veto LLD | 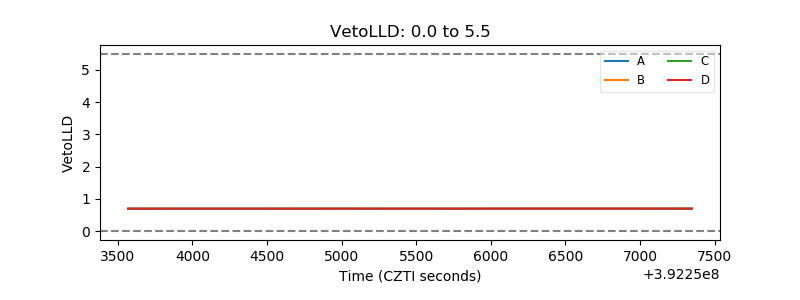 |
| Alpha Counter | 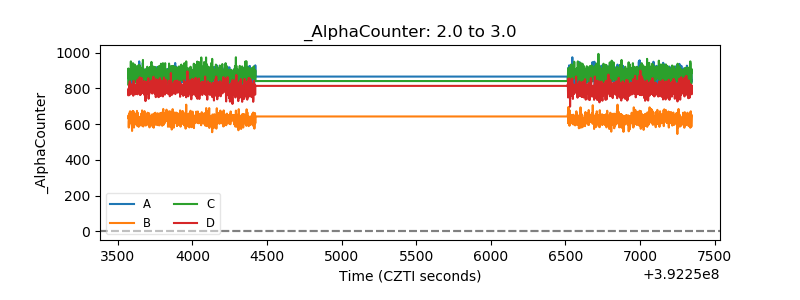 |
| _CPM_Rate | 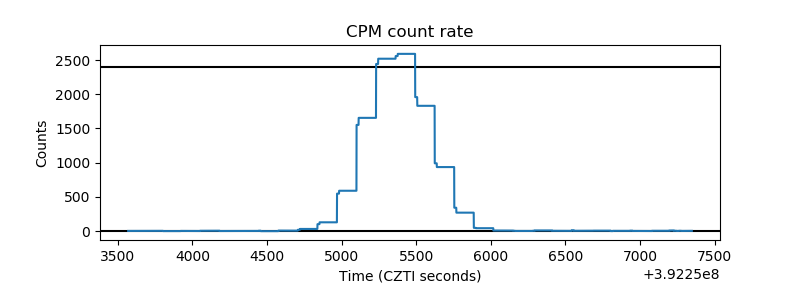 |
| CZT Counter | 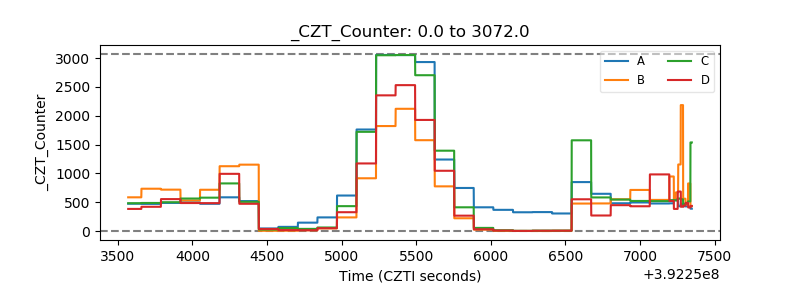 |
| +2.5 Volts monitor | 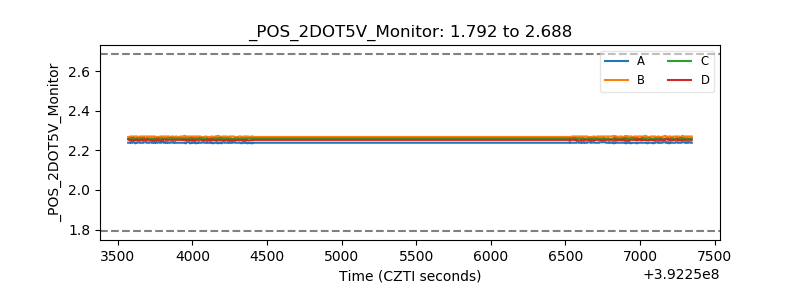 |
| +5 Volts monitor | 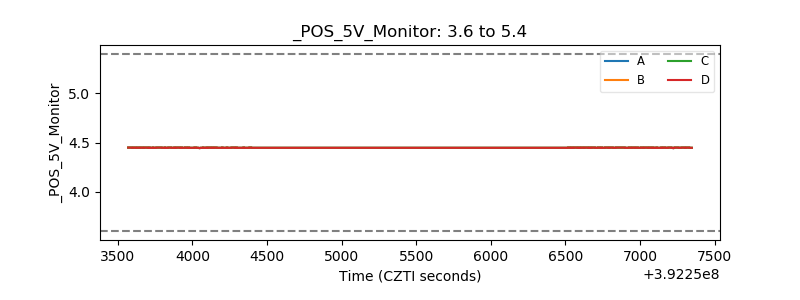 |
| _ROLL_ROT | 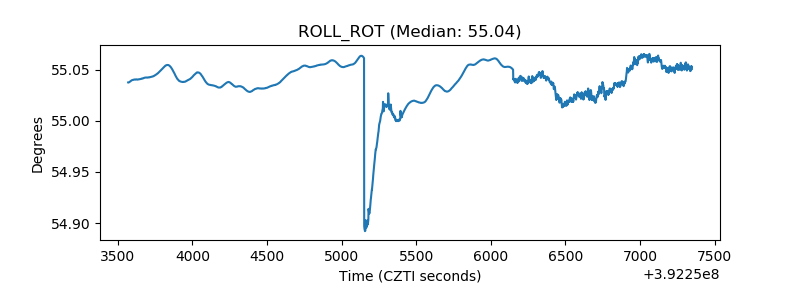 |
| _Roll_DEC | 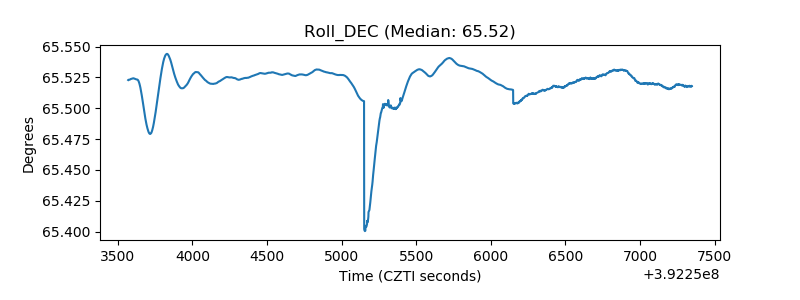 |
| _Roll_RA | 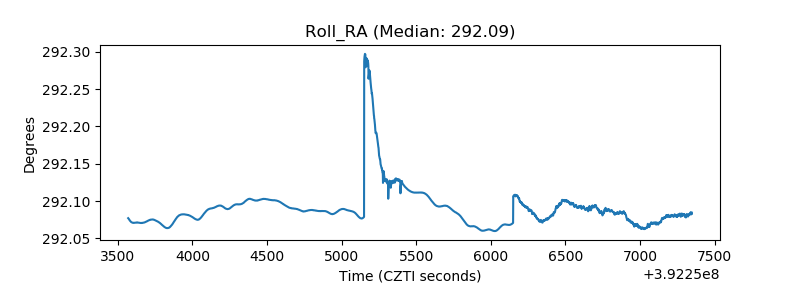 |
| Veto Counter | 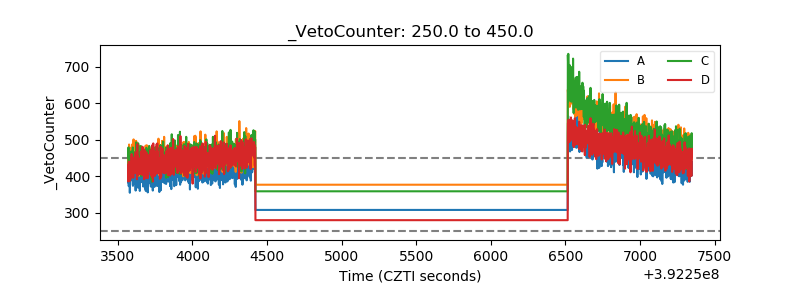 |