| Param | Original file | Final file |
|---|---|---|
| Filename | modeM0/AS1T05_009T03_9000005164cztM0_level2_bc.evt | modeM0/AS1T05_009T03_9000005164cztM0_level2_quad_clean.evt |
| Size (bytes) | 155,589,120 | 55,938,240 |
| Size | 148.4 MB | 53.3 MB |
| Events in quadrant A | 854,090 | 357,948 |
| Events in quadrant B | 1,350,498 | 364,134 |
| Events in quadrant C | 1,248,989 | 370,084 |
| Events in quadrant D | 1,009,314 | 350,656 |
| Mode M9 | |||
|---|---|---|---|
| Quadrant | BADHDUFLAG | Total packets | Discarded packets |
| A | 0 | 20 | 0 |
| B | 0 | 20 | 0 |
| C | 0 | 20 | 0 |
| D | 0 | 20 | 0 |
| Mode M0 | |||
|---|---|---|---|
| Quadrant | BADHDUFLAG | Total packets | Discarded packets |
| A | 0 | 7317 | 0 |
| B | 0 | 9637 | 0 |
| C | 0 | 8503 | 0 |
| D | 0 | 8035 | 0 |
| Mode SS | |||
|---|---|---|---|
| Quadrant | BADHDUFLAG | Total packets | Discarded packets |
| A | 0 | 74 | 0 |
| B | 0 | 74 | 0 |
| C | 0 | 74 | 0 |
| D | 0 | 74 | 0 |
| Quadrant | Total seconds | Saturated seconds | Saturation percentage |
|---|---|---|---|
| A | 3540 | 3 | 0.084746% |
| B | 3540 | 141 | 3.983051% |
| C | 3540 | 57 | 1.610169% |
| D | 3540 | 47 | 1.327684% |
Noise dominated data is calculated using 1-second bins in cleaned event files. If a bin has >2000 counts, and if more than 50% of those come from <1% of pixels, then it is considered to be noise-dominated and hence unusable.
| Quadrant | # 1 sec bins | Bins with >0 counts | Bins with >2000 counts | High rate bins dominated by noise | Noise dominated (total time) | Noise dominated (detector-on time) | Marked lightcurve |
|---|---|---|---|---|---|---|---|
| A | 5633 | 3541 | 0 | 0 | 0.00% | 0.00% | 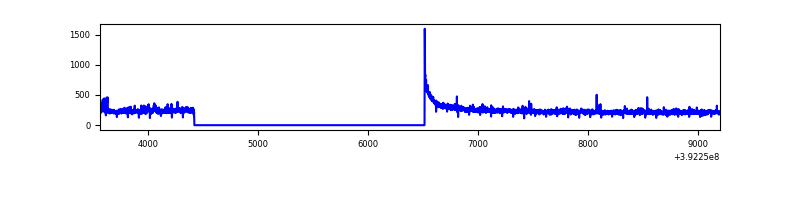 |
| B | 5633 | 3541 | 13 | 13 | 0.23% | 0.37% | 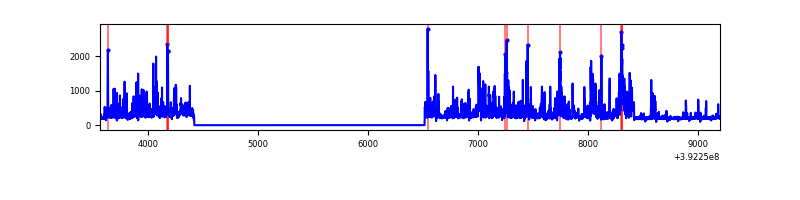 |
| C | 5633 | 3540 | 11 | 11 | 0.20% | 0.31% | 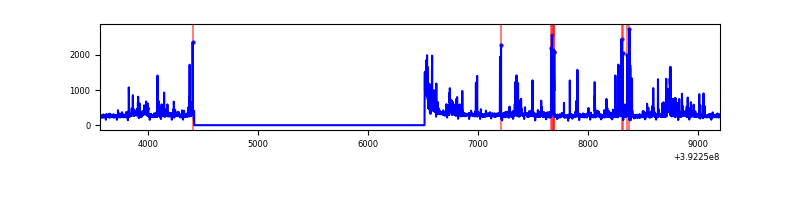 |
| D | 5633 | 3540 | 2 | 2 | 0.04% | 0.06% | 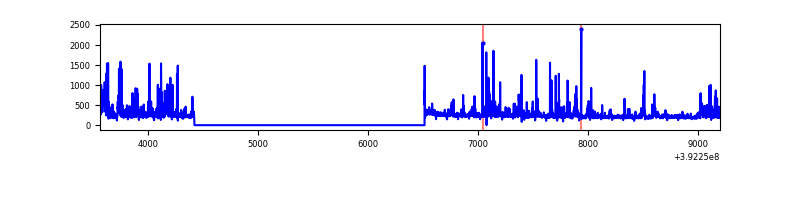 |
Top three noisy pixels from each quadrant. If the there are fewer than three noisy pixels in the level2.evt file, extra rows are filled as -1
| Pixel properties | Quadrant properties | ||||||
|---|---|---|---|---|---|---|---|
| Quadrant | DetID | PixID | Counts | Sigma | Mean | Median | Sigma |
| A | 10 | 83 | 96572 | 2236.29 | 189 | 186 | 43.1 |
| A | 8 | 144 | 14192 | 324.96 | 189 | 186 | 43.1 |
| A | 9 | 143 | 6798 | 153.41 | 189 | 186 | 43.1 |
| B | 5 | 172 | 276653 | 7004.59 | 190 | 186 | 39.5 |
| B | 4 | 171 | 264759 | 6703.24 | 190 | 186 | 39.5 |
| B | 0 | 213 | 29731 | 748.55 | 190 | 186 | 39.5 |
| C | 15 | 208 | 210812 | 4576.72 | 190 | 188 | 46.0 |
| C | 15 | 214 | 150824 | 3273.22 | 190 | 188 | 46.0 |
| C | 0 | 10 | 89891 | 1949.19 | 190 | 188 | 46.0 |
| D | 13 | 249 | 108934 | 2351.41 | 187 | 180 | 46.3 |
| D | 13 | 171 | 29742 | 639.17 | 187 | 180 | 46.3 |
| D | 10 | 118 | 21788 | 467.19 | 187 | 180 | 46.3 |
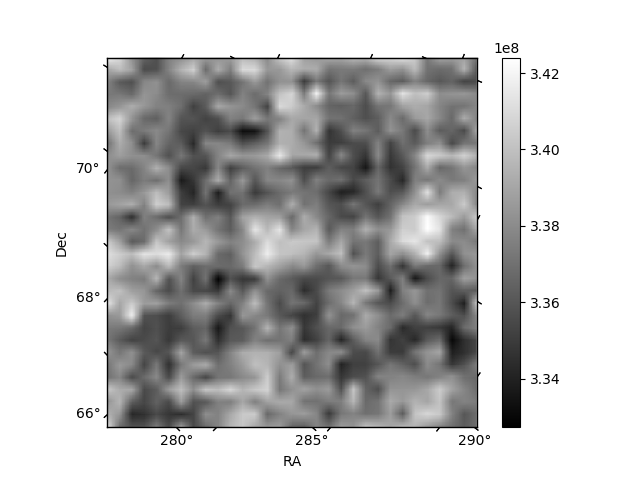
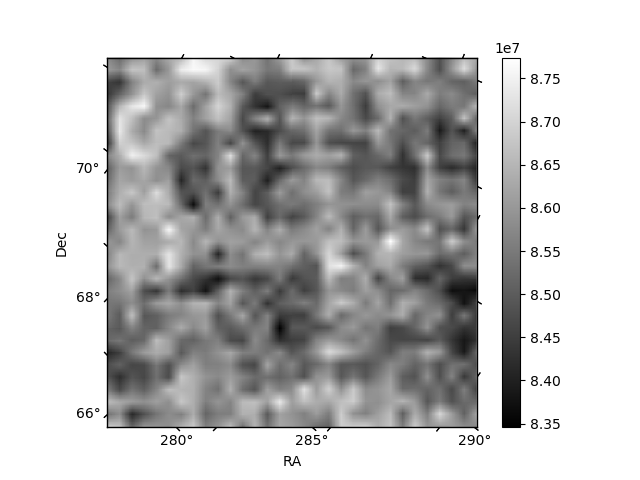
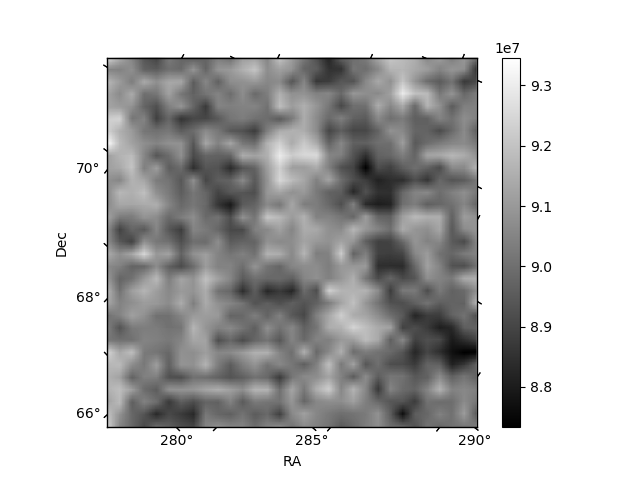
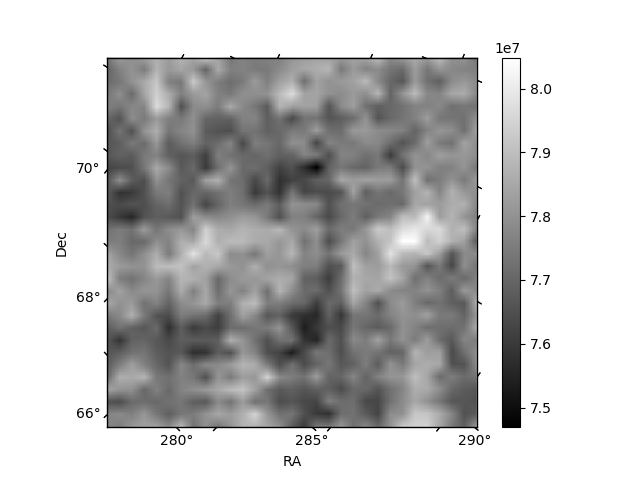
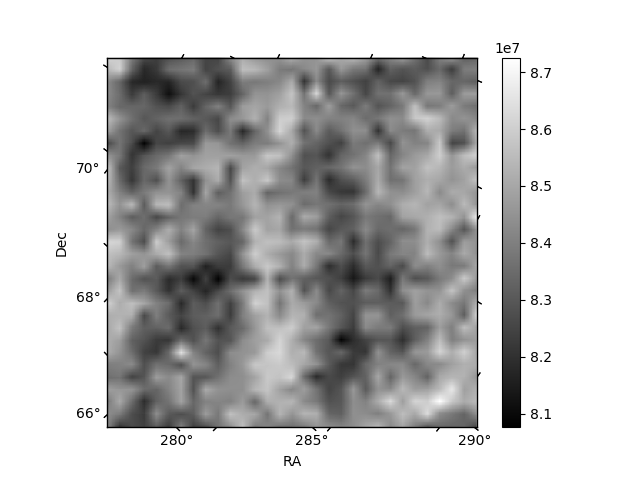
Histogram calculated using DETX and DETY for each event in the final _common_clean file
| Quadrant A | 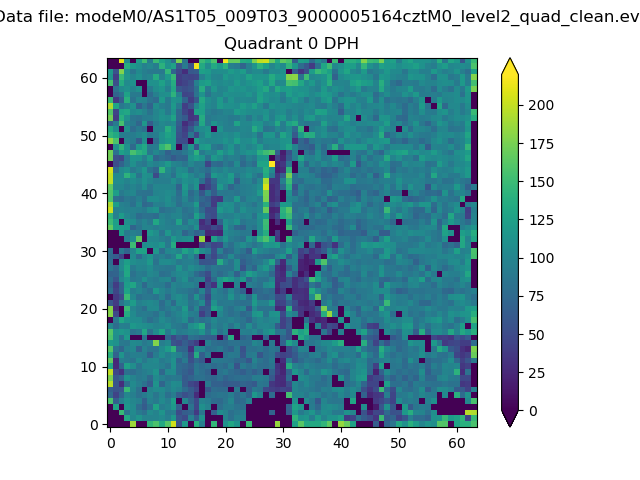 |
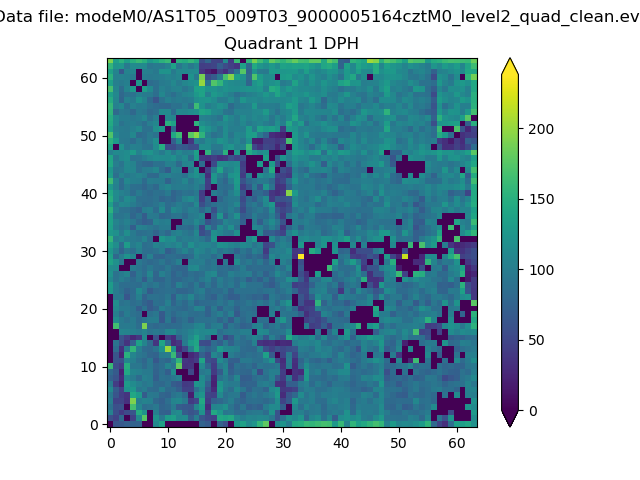 |
Quadrant B |
|---|---|---|---|
| Quadrant D |  |
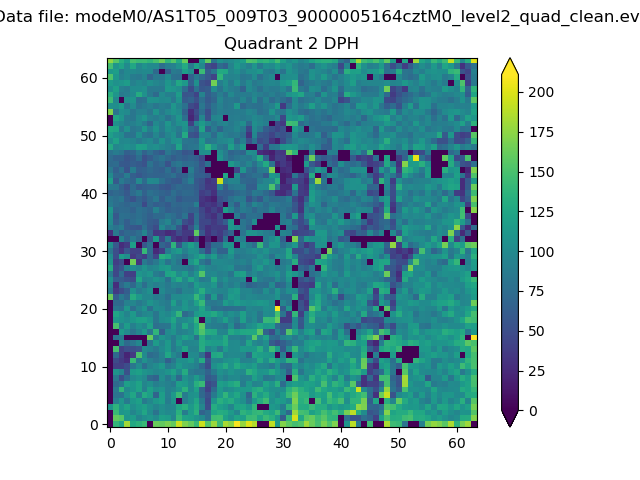 |
Quadrant C |
| Plot type | Count rate plots | Images |
|---|---|---|
| Comparison with Poisson distribution Blue bars denote a histogram of data divided into 1 sec bins. Red curve is a Poisson curve with rate = median count rate of data. |
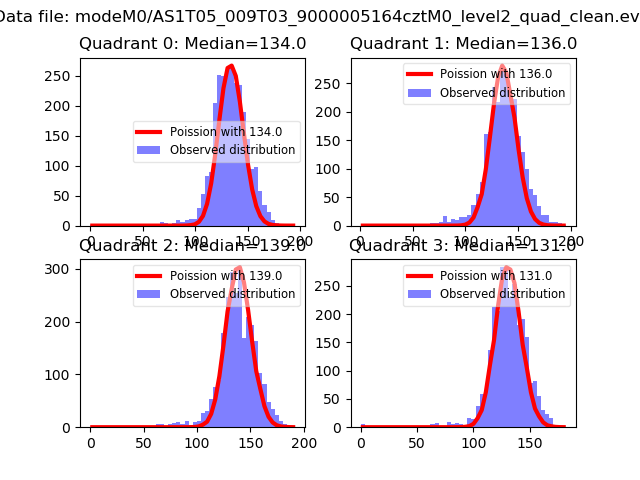 |
 |
| Quadrant-wise count rates Data is divided into 100 sec bins |
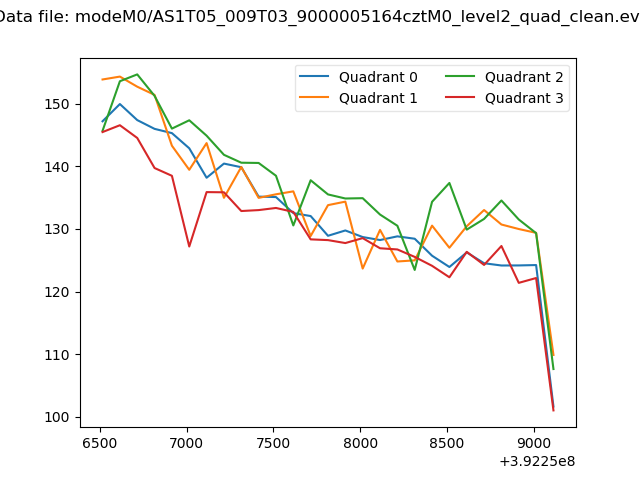 |
|
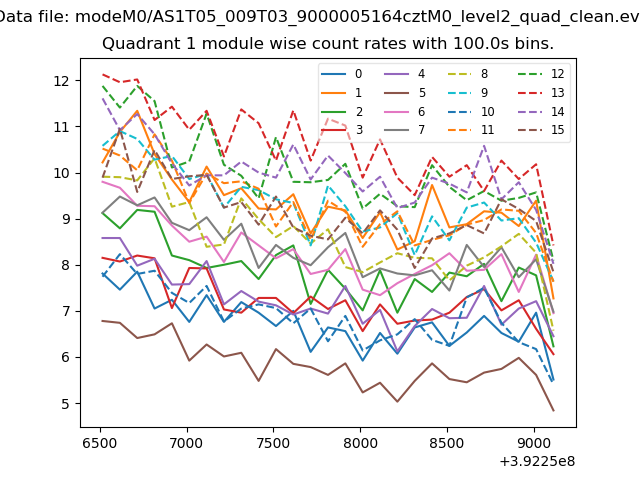
| Module-wise count rates for Quadrant A Data is divided into 100 sec bins |
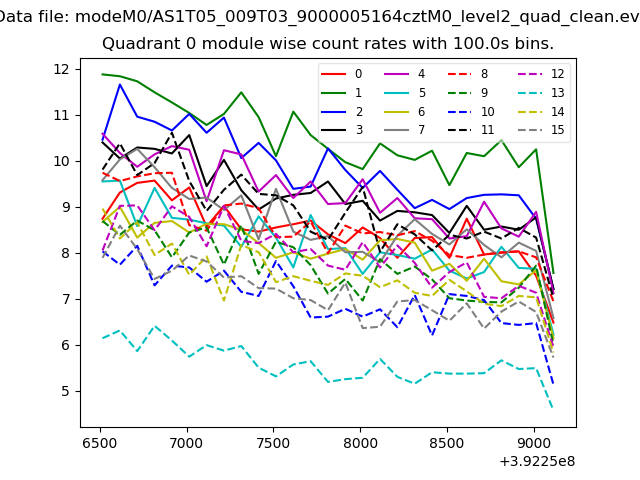 |
 |
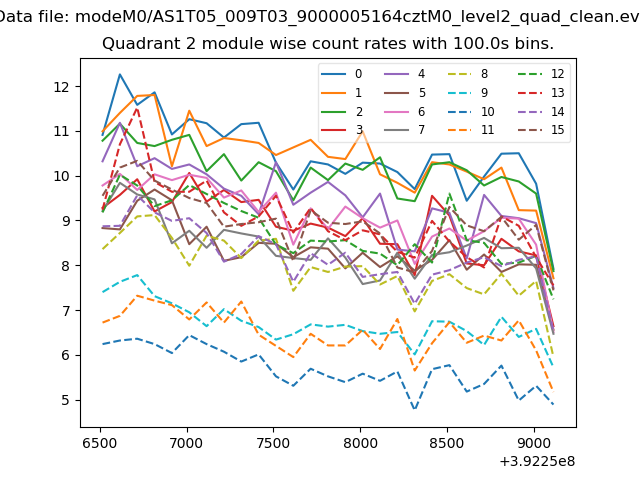
| Module-wise count rates for Quadrant B Data is divided into 100 sec bins |
 |
 |
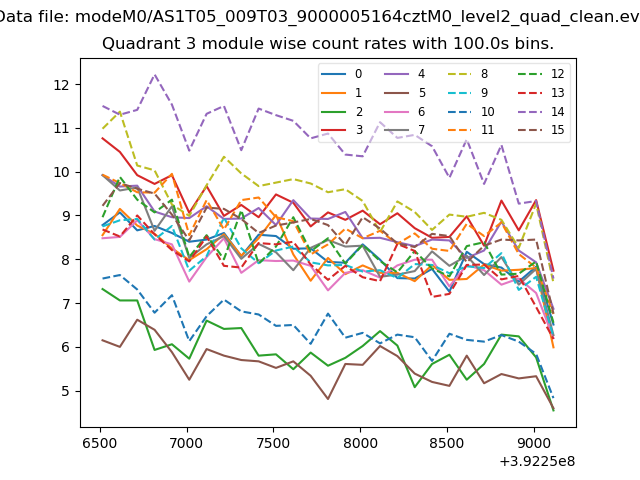
| Module-wise count rates for Quadrant C Data is divided into 100 sec bins |
 |
 |
| Module-wise count rates for Quadrant D Data is divided into 100 sec bins |
 |
 |
| Parameter | Plot |
|---|---|
| CZT HV Monitor |  |
| D_VDD | 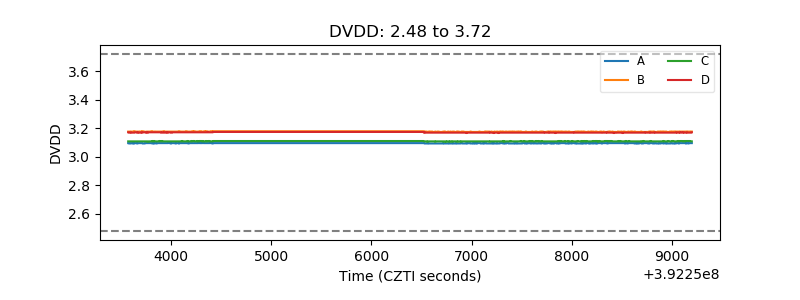 |
| Temperature 1 | 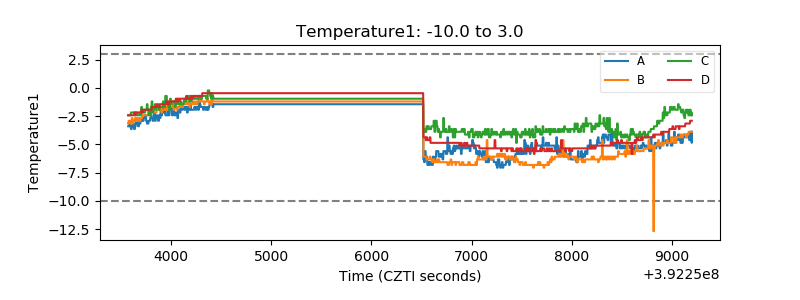 |
| Veto HV Monitor | 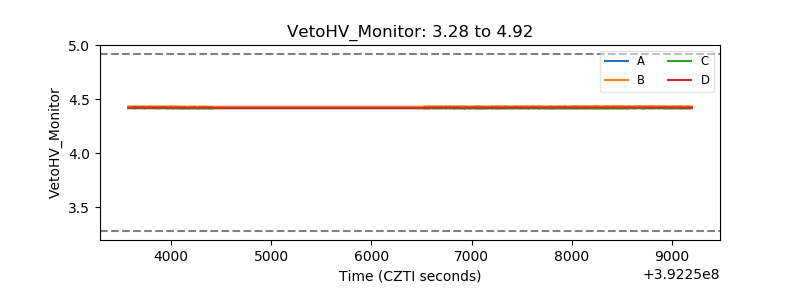 |
| Veto LLD | 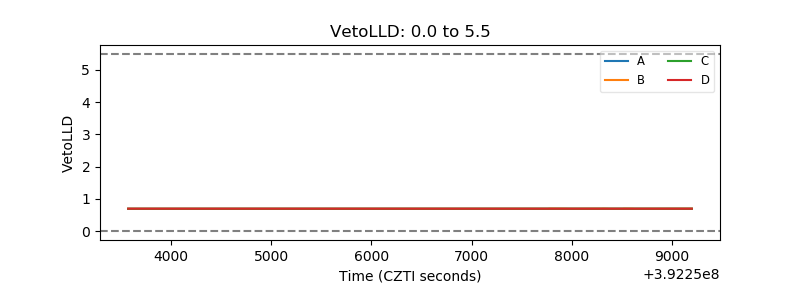 |
| Alpha Counter | 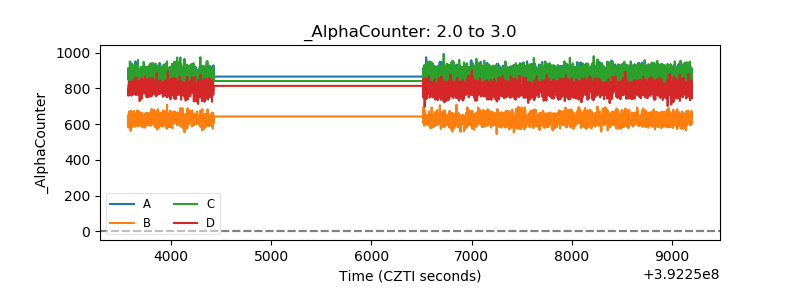 |
| _CPM_Rate | 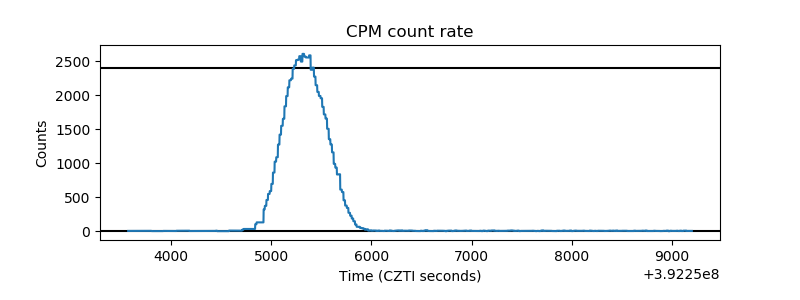 |
| CZT Counter | 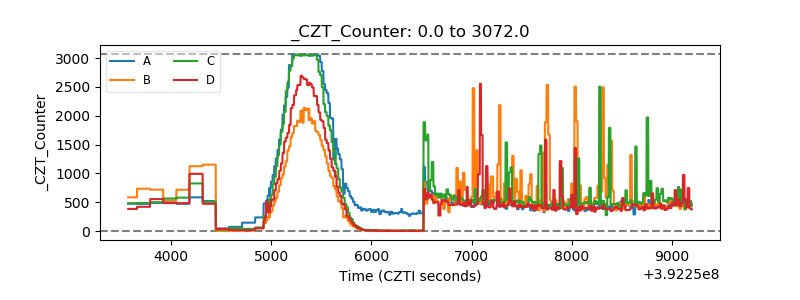 |
| +2.5 Volts monitor | 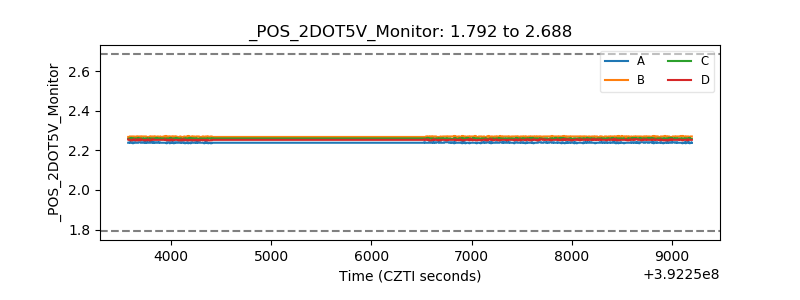 |
| +5 Volts monitor | 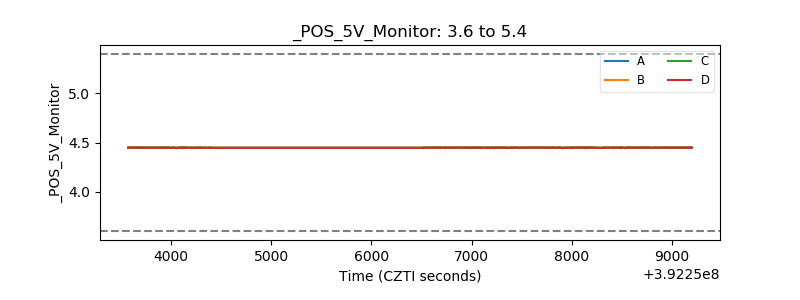 |
| _ROLL_ROT | 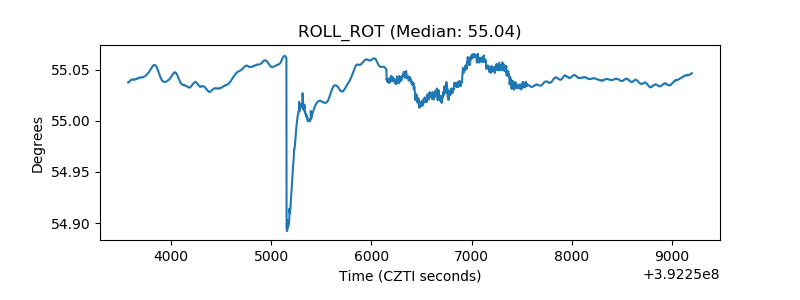 |
| _Roll_DEC | 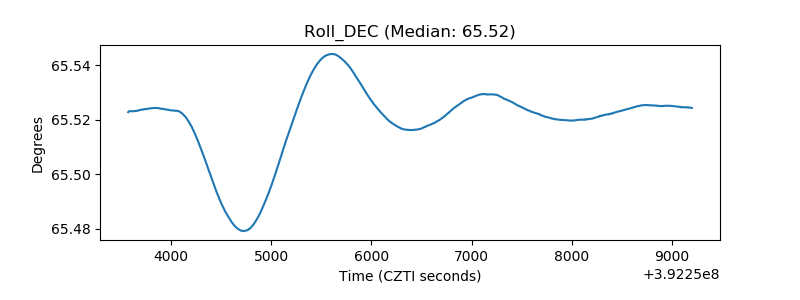 |
| _Roll_RA | 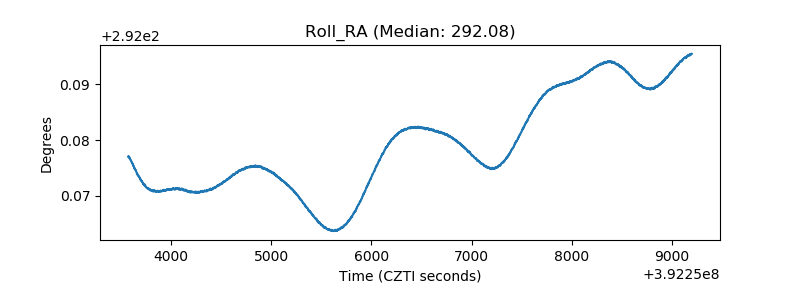 |
| Veto Counter | 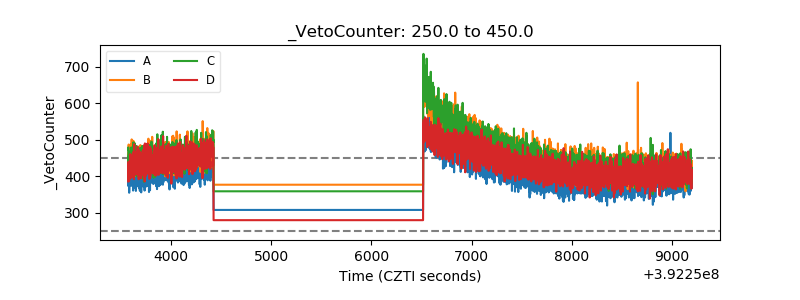 |