| Param | Original file | Final file |
|---|---|---|
| Filename | modeM0/AS1A11_059T08_9000005160_36172cztM0_level2.evt | modeM0/AS1A11_059T08_9000005160_36172cztM0_level2_quad_clean.evt |
| Size (bytes) | 436,210,560 | 79,608,960 |
| Size | 416.0 MB | 75.9 MB |
| Events in quadrant A | 2,598,632 | 514,767 |
| Events in quadrant B | 3,201,085 | 543,948 |
| Events in quadrant C | 3,536,248 | 509,699 |
| Events in quadrant D | 3,525,450 | 481,667 |
| Mode M9 | |||
|---|---|---|---|
| Quadrant | BADHDUFLAG | Total packets | Discarded packets |
| A | 0 | 36 | 0 |
| B | 0 | 36 | 0 |
| C | 0 | 36 | 0 |
| D | 0 | 36 | 0 |
| Mode M0 | |||
|---|---|---|---|
| Quadrant | BADHDUFLAG | Total packets | Discarded packets |
| A | 0 | 10941 | 2 |
| B | 0 | 12825 | 2 |
| C | 0 | 13583 | 2 |
| D | 0 | 13922 | 2 |
| Mode SS | |||
|---|---|---|---|
| Quadrant | BADHDUFLAG | Total packets | Discarded packets |
| A | 0 | 108 | 0 |
| B | 0 | 108 | 0 |
| C | 0 | 108 | 0 |
| D | 0 | 108 | 0 |
| Quadrant | Total seconds | Saturated seconds | Saturation percentage |
|---|---|---|---|
| A | 5140 | 15 | 0.291829% |
| B | 5140 | 110 | 2.140078% |
| C | 5140 | 205 | 3.988327% |
| D | 5140 | 227 | 4.416342% |
Noise dominated data is calculated using 1-second bins in cleaned event files. If a bin has >2000 counts, and if more than 50% of those come from <1% of pixels, then it is considered to be noise-dominated and hence unusable.
| Quadrant | # 1 sec bins | Bins with >0 counts | Bins with >2000 counts | High rate bins dominated by noise | Noise dominated (total time) | Noise dominated (detector-on time) | Marked lightcurve |
|---|---|---|---|---|---|---|---|
| A | 8785 | 5142 | 4 | 4 | 0.05% | 0.08% | 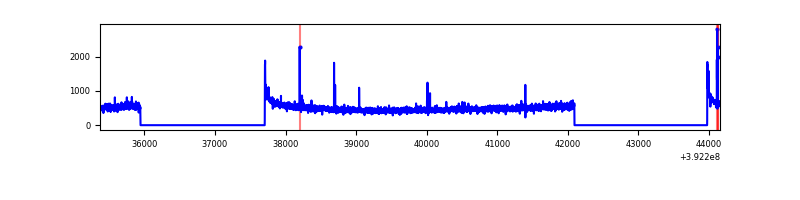 |
| B | 8785 | 5142 | 56 | 56 | 0.64% | 1.09% | 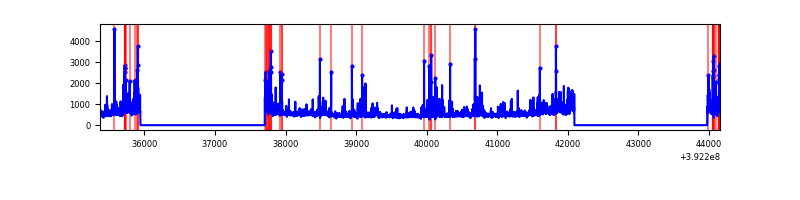 |
| C | 8785 | 5142 | 168 | 168 | 1.91% | 3.27% | 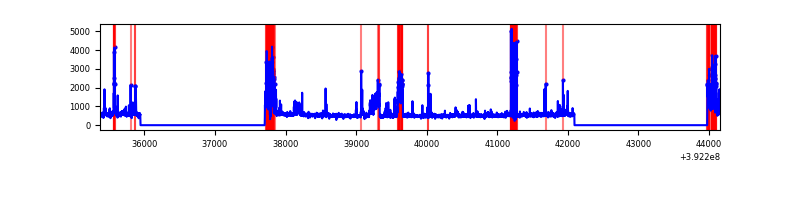 |
| D | 8785 | 5142 | 190 | 190 | 2.16% | 3.70% | 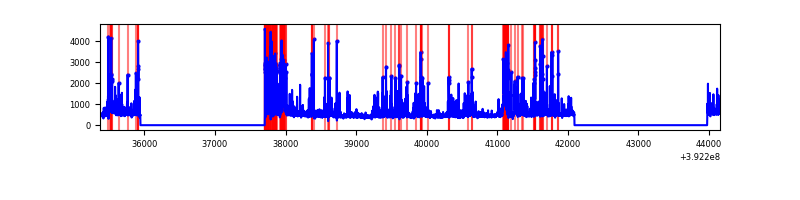 |
Top three noisy pixels from each quadrant. If the there are fewer than three noisy pixels in the level2.evt file, extra rows are filled as -1
| Pixel properties | Quadrant properties | ||||||
|---|---|---|---|---|---|---|---|
| Quadrant | DetID | PixID | Counts | Sigma | Mean | Median | Sigma |
| A | 10 | 83 | 158130 | 1269.49 | 618 | 607 | 124.1 |
| A | 9 | 143 | 25162 | 197.89 | 618 | 607 | 124.1 |
| A | 8 | 144 | 20500 | 160.32 | 618 | 607 | 124.1 |
| B | 5 | 172 | 281690 | 2363.04 | 619 | 603 | 119.0 |
| B | 4 | 171 | 272687 | 2287.35 | 619 | 603 | 119.0 |
| B | 0 | 190 | 75030 | 625.69 | 619 | 603 | 119.0 |
| C | 15 | 208 | 482263 | 3398.75 | 603 | 608 | 141.7 |
| C | 0 | 10 | 396396 | 2792.84 | 603 | 608 | 141.7 |
| C | 15 | 214 | 225636 | 1587.89 | 603 | 608 | 141.7 |
| D | 13 | 249 | 408225 | 2793.77 | 598 | 584 | 145.9 |
| D | 2 | 250 | 290311 | 1985.65 | 598 | 584 | 145.9 |
| D | 12 | 6 | 228392 | 1561.29 | 598 | 584 | 145.9 |
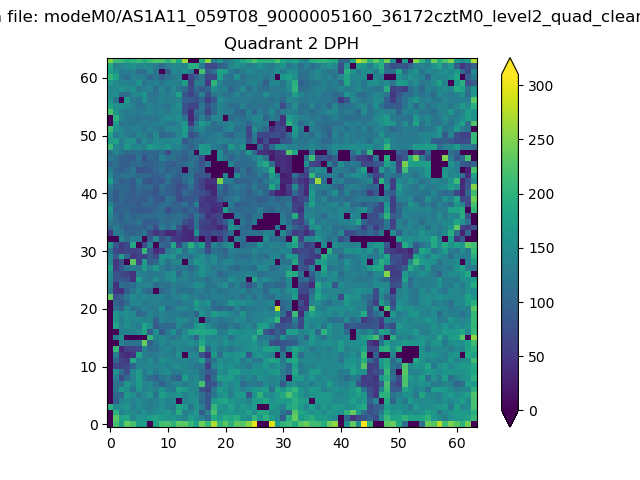
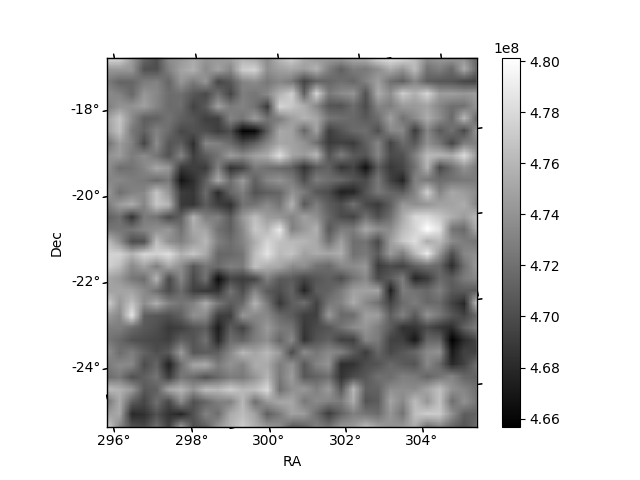
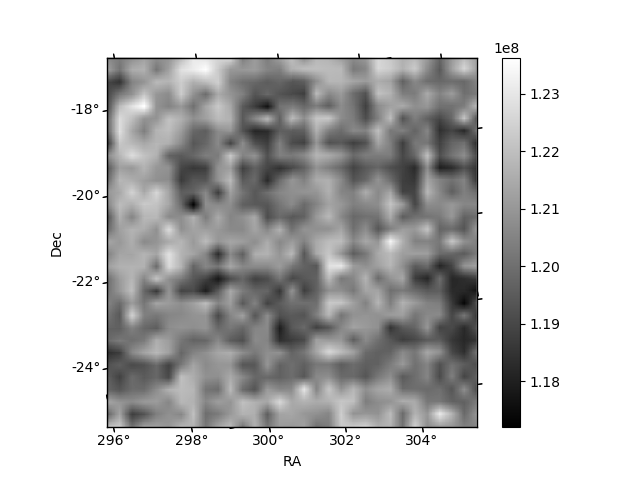
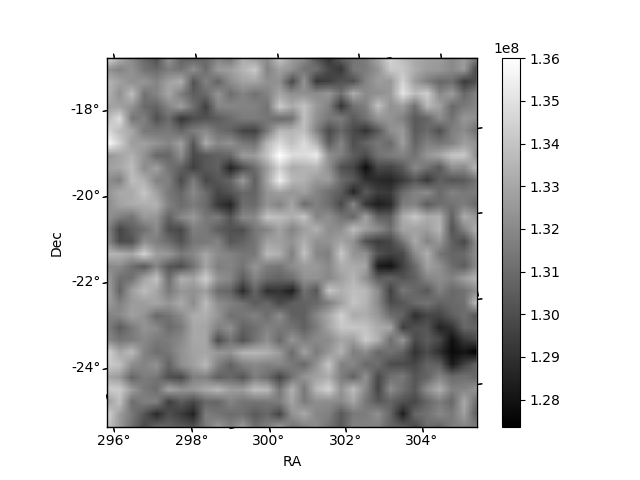
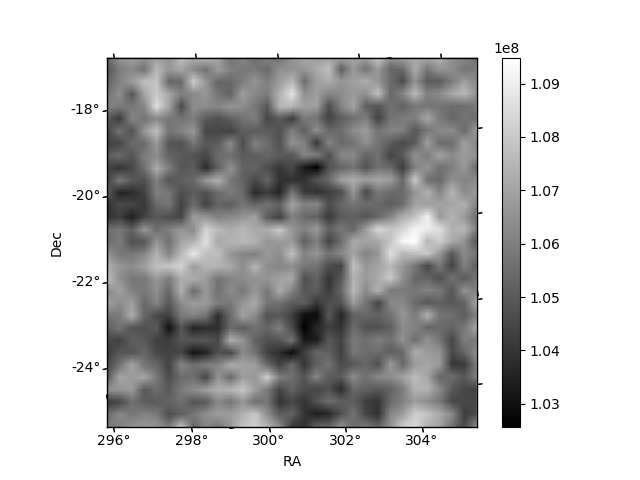
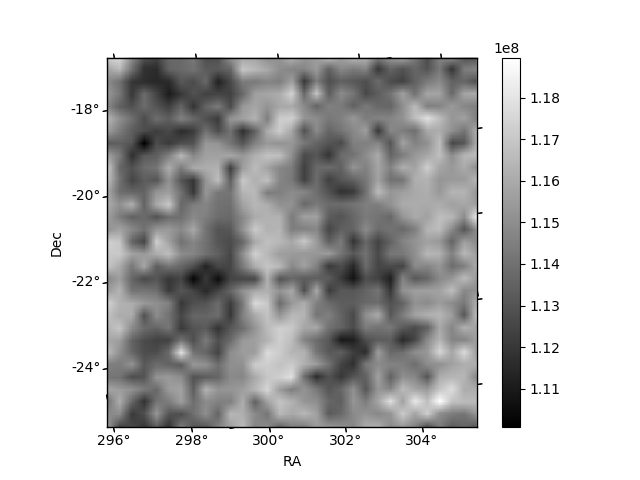
Histogram calculated using DETX and DETY for each event in the final _common_clean file
| Quadrant A | 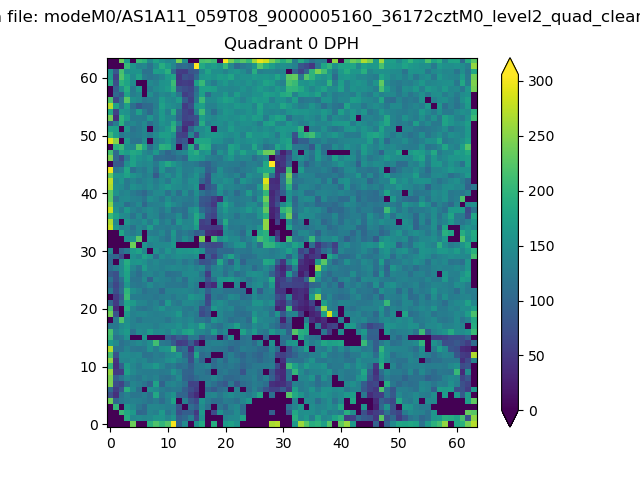 |
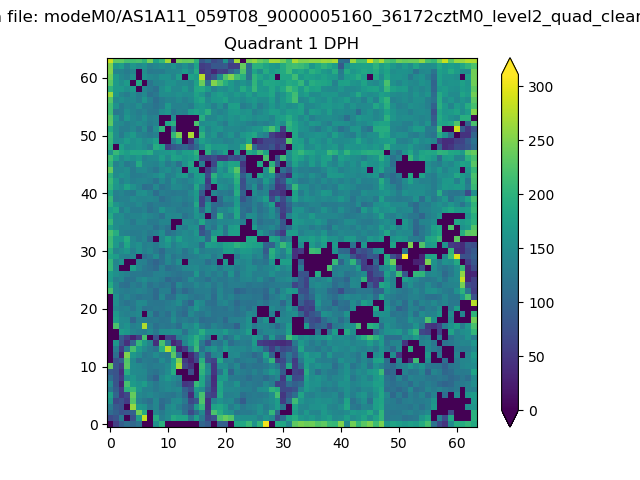 |
Quadrant B |
|---|---|---|---|
| Quadrant D | 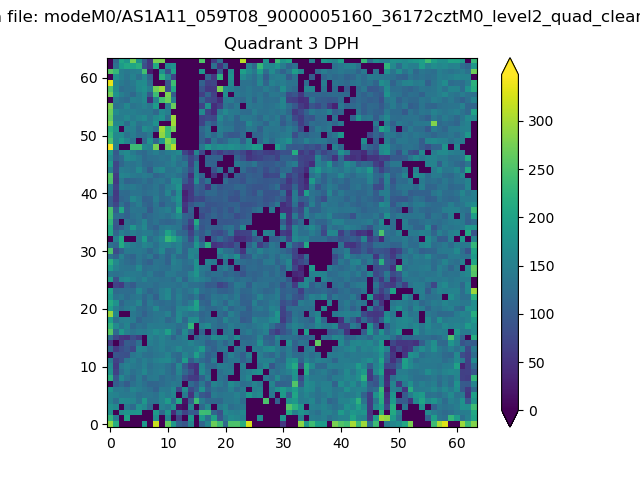 |
 |
Quadrant C |
| Plot type | Count rate plots | Images |
|---|---|---|
| Comparison with Poisson distribution Blue bars denote a histogram of data divided into 1 sec bins. Red curve is a Poisson curve with rate = median count rate of data. |
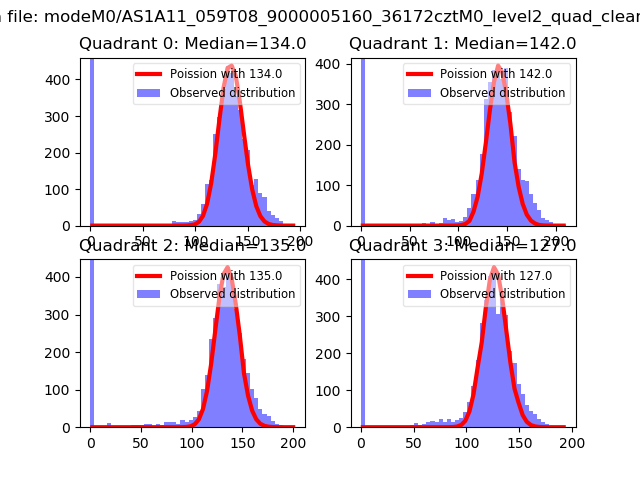 |
 |
| Quadrant-wise count rates Data is divided into 100 sec bins |
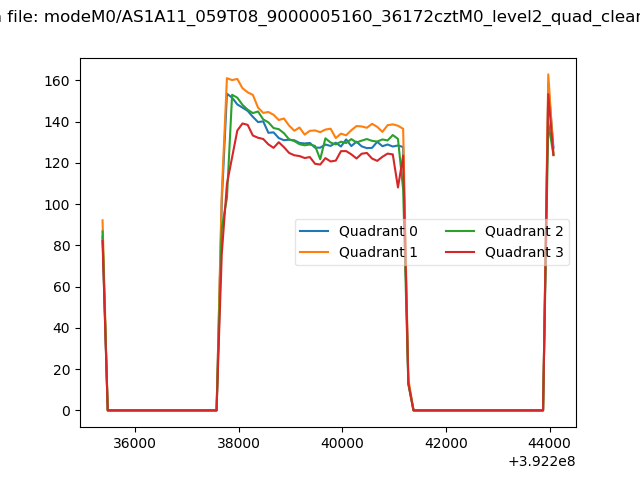 |
|
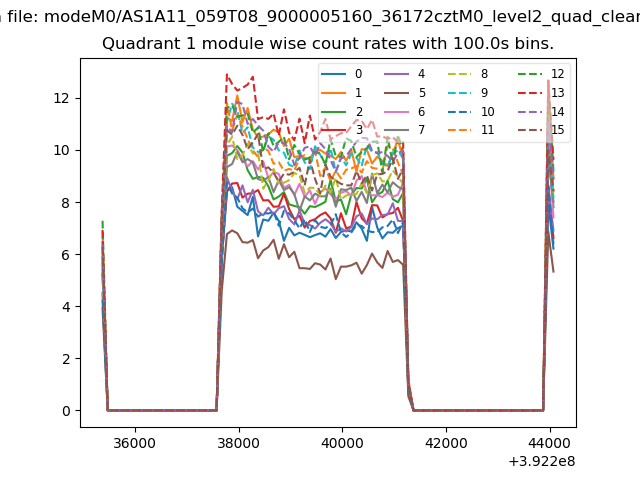
| Module-wise count rates for Quadrant A Data is divided into 100 sec bins |
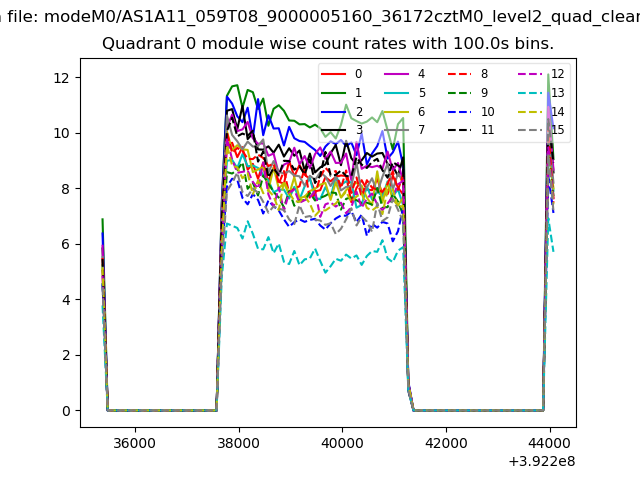 |
 |
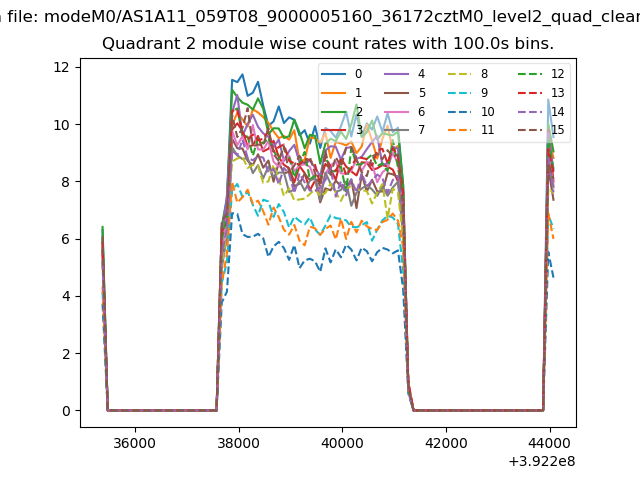
| Module-wise count rates for Quadrant B Data is divided into 100 sec bins |
 |
 |
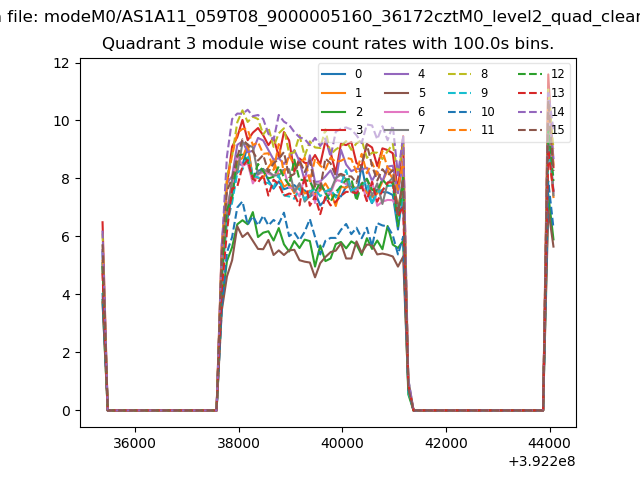
| Module-wise count rates for Quadrant C Data is divided into 100 sec bins |
 |
 |
| Module-wise count rates for Quadrant D Data is divided into 100 sec bins |
 |
 |
| Parameter | Plot |
|---|---|
| CZT HV Monitor | 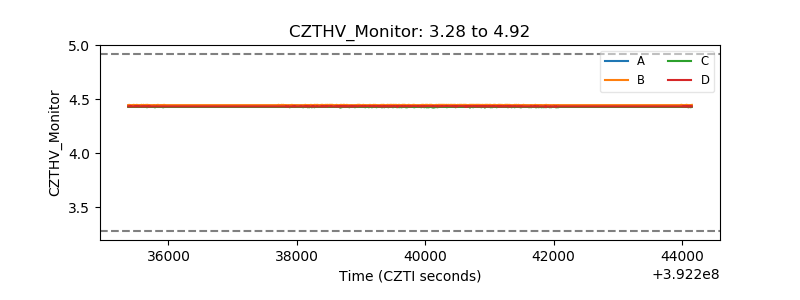 |
| D_VDD | 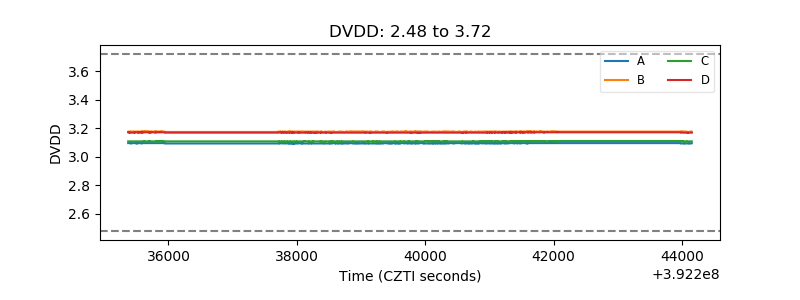 |
| Temperature 1 | 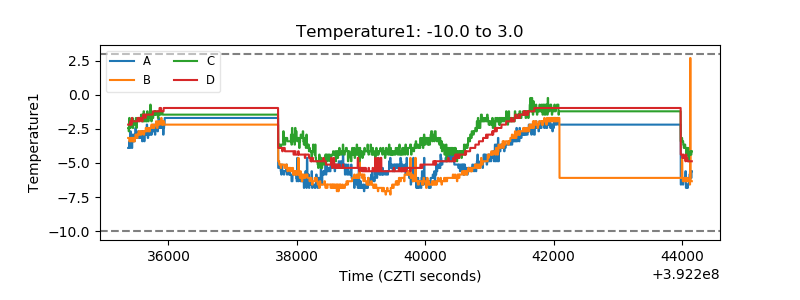 |
| Veto HV Monitor | 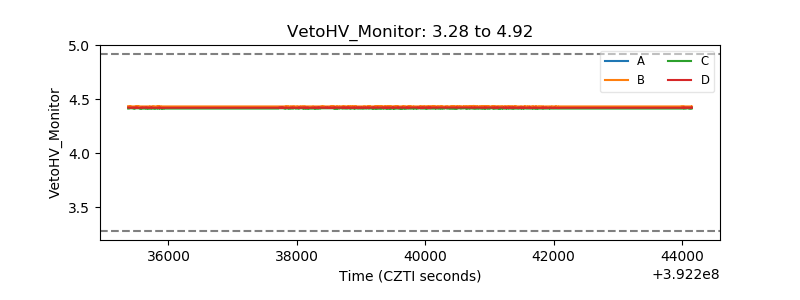 |
| Veto LLD | 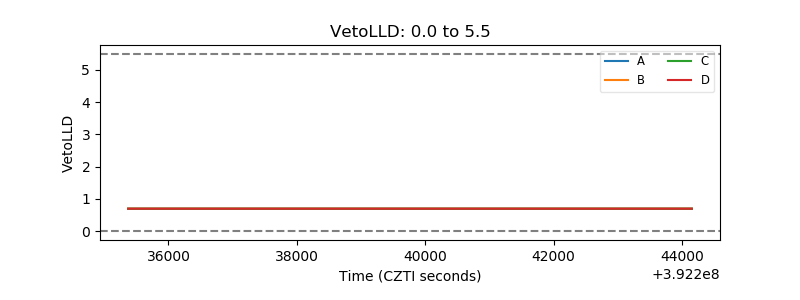 |
| Alpha Counter | 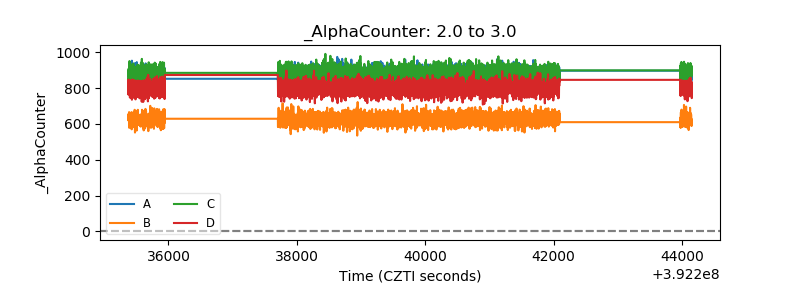 |
| _CPM_Rate | 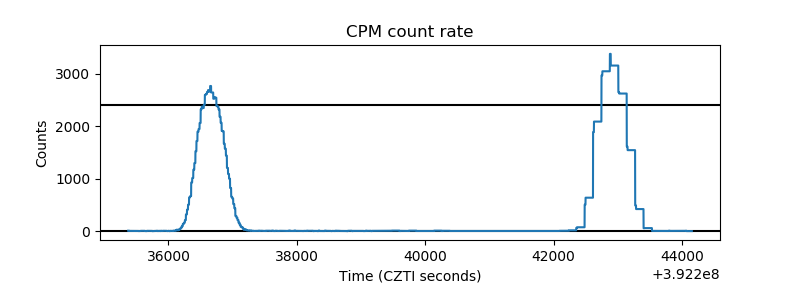 |
| CZT Counter | 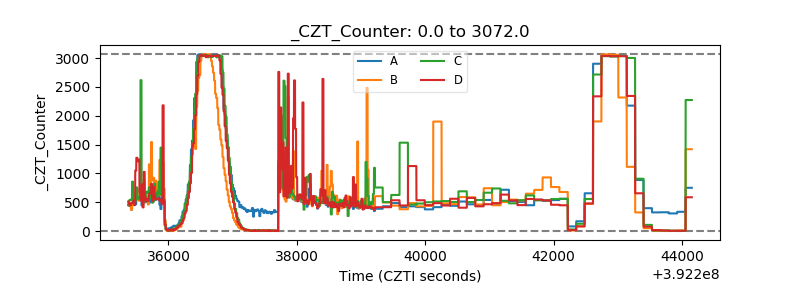 |
| +2.5 Volts monitor | 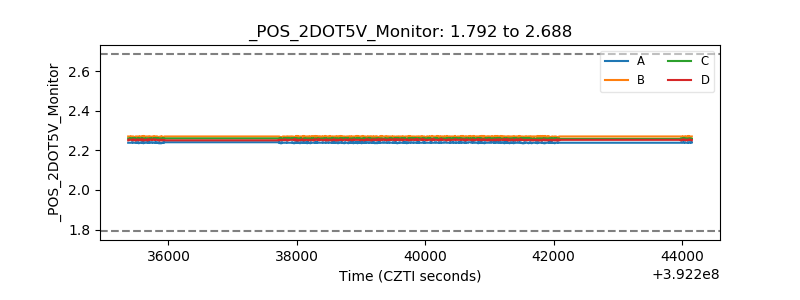 |
| +5 Volts monitor | 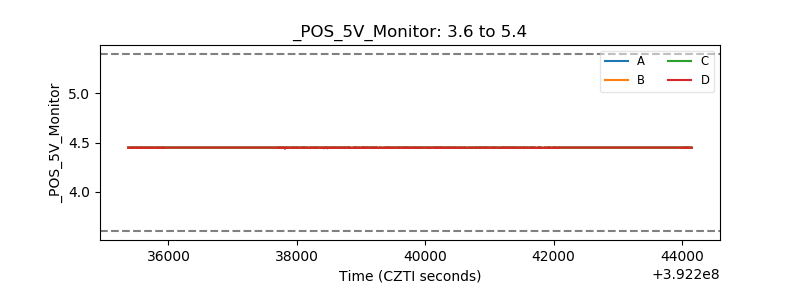 |
| _ROLL_ROT | 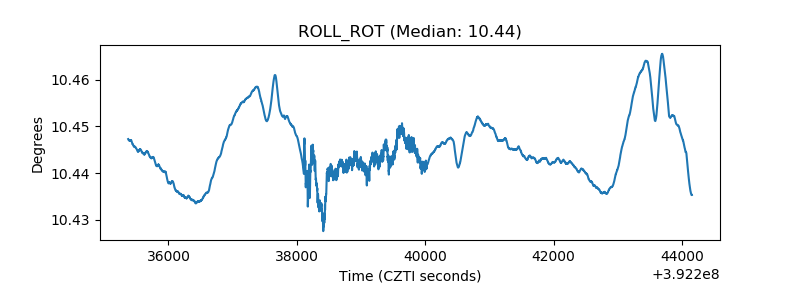 |
| _Roll_DEC | 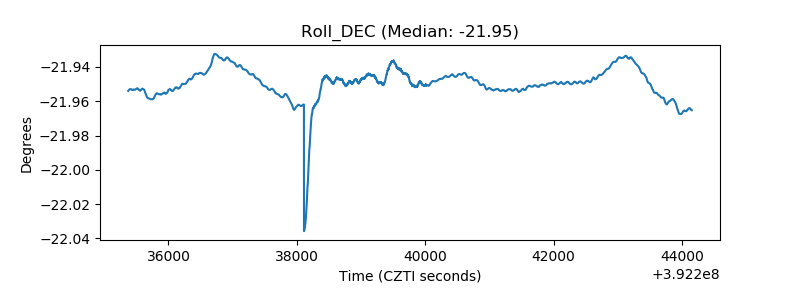 |
| _Roll_RA | 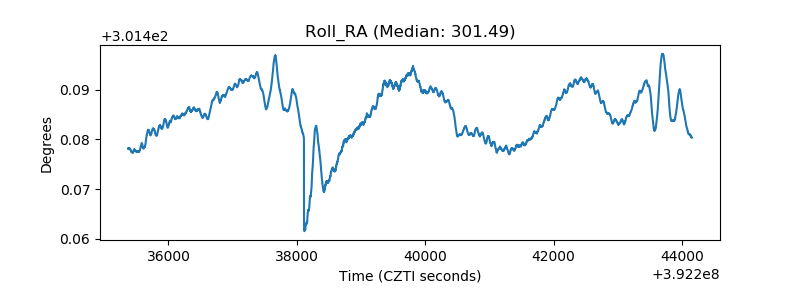 |
| Veto Counter | 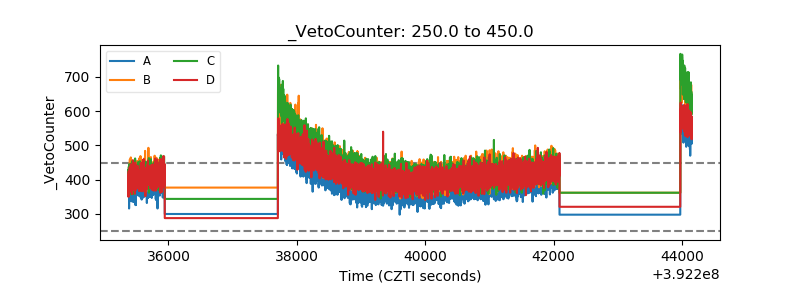 |