| Param | Original file | Final file |
|---|---|---|
| Filename | modeM0/AS1A11_059T08_9000005160_36161cztM0_level2.evt | modeM0/AS1A11_059T08_9000005160_36161cztM0_level2_quad_clean.evt |
| Size (bytes) | 448,012,800 | 69,508,800 |
| Size | 427.3 MB | 66.3 MB |
| Events in quadrant A | 2,702,890 | 430,420 |
| Events in quadrant B | 3,119,669 | 457,308 |
| Events in quadrant C | 3,717,591 | 430,261 |
| Events in quadrant D | 3,661,778 | 409,149 |
| Mode M9 | |||
|---|---|---|---|
| Quadrant | BADHDUFLAG | Total packets | Discarded packets |
| A | 0 | 28 | 0 |
| B | 0 | 28 | 0 |
| C | 0 | 28 | 0 |
| D | 0 | 29 | 0 |
| Mode M0 | |||
|---|---|---|---|
| Quadrant | BADHDUFLAG | Total packets | Discarded packets |
| A | 0 | 11264 | 3 |
| B | 0 | 12649 | 2 |
| C | 0 | 14303 | 2 |
| D | 0 | 14402 | 2 |
| Mode SS | |||
|---|---|---|---|
| Quadrant | BADHDUFLAG | Total packets | Discarded packets |
| A | 0 | 110 | 0 |
| B | 0 | 110 | 0 |
| C | 0 | 110 | 0 |
| D | 0 | 110 | 0 |
| Quadrant | Total seconds | Saturated seconds | Saturation percentage |
|---|---|---|---|
| A | 5392 | 10 | 0.185460% |
| B | 5392 | 105 | 1.947329% |
| C | 5392 | 199 | 3.690653% |
| D | 5392 | 234 | 4.339763% |
Noise dominated data is calculated using 1-second bins in cleaned event files. If a bin has >2000 counts, and if more than 50% of those come from <1% of pixels, then it is considered to be noise-dominated and hence unusable.
| Quadrant | # 1 sec bins | Bins with >0 counts | Bins with >2000 counts | High rate bins dominated by noise | Noise dominated (total time) | Noise dominated (detector-on time) | Marked lightcurve |
|---|---|---|---|---|---|---|---|
| A | 7515 | 5393 | 4 | 4 | 0.05% | 0.07% | 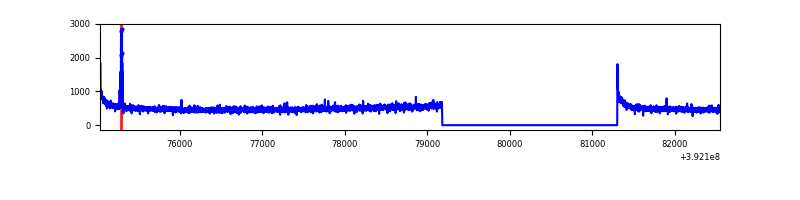 |
| B | 7515 | 5393 | 67 | 67 | 0.89% | 1.24% | 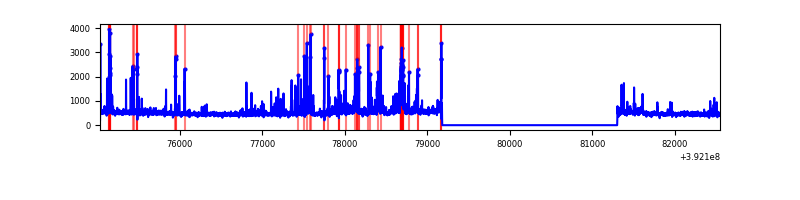 |
| C | 7515 | 5393 | 160 | 160 | 2.13% | 2.97% | 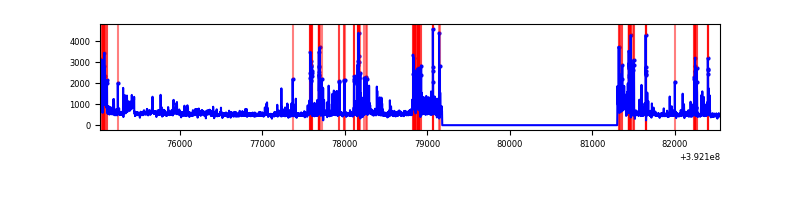 |
| D | 7515 | 5393 | 200 | 200 | 2.66% | 3.71% | 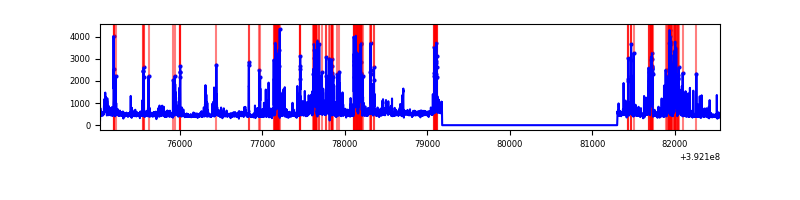 |
Top three noisy pixels from each quadrant. If the there are fewer than three noisy pixels in the level2.evt file, extra rows are filled as -1
| Pixel properties | Quadrant properties | ||||||
|---|---|---|---|---|---|---|---|
| Quadrant | DetID | PixID | Counts | Sigma | Mean | Median | Sigma |
| A | 10 | 83 | 176928 | 1370.83 | 643 | 631 | 128.6 |
| A | 9 | 143 | 27719 | 210.63 | 643 | 631 | 128.6 |
| A | 13 | 254 | 9343 | 67.74 | 643 | 631 | 128.6 |
| B | 5 | 172 | 375752 | 3071.32 | 639 | 625 | 122.1 |
| B | 15 | 85 | 69109 | 560.71 | 639 | 625 | 122.1 |
| B | 4 | 171 | 43778 | 353.31 | 639 | 625 | 122.1 |
| C | 15 | 208 | 464433 | 3218.4 | 622 | 629 | 144.1 |
| C | 0 | 207 | 422274 | 2925.85 | 622 | 629 | 144.1 |
| C | 15 | 214 | 226077 | 1564.41 | 622 | 629 | 144.1 |
| D | 12 | 17 | 502457 | 3296.94 | 624 | 609 | 152.2 |
| D | 2 | 250 | 215024 | 1408.62 | 624 | 609 | 152.2 |
| D | 13 | 249 | 133920 | 875.8 | 624 | 609 | 152.2 |
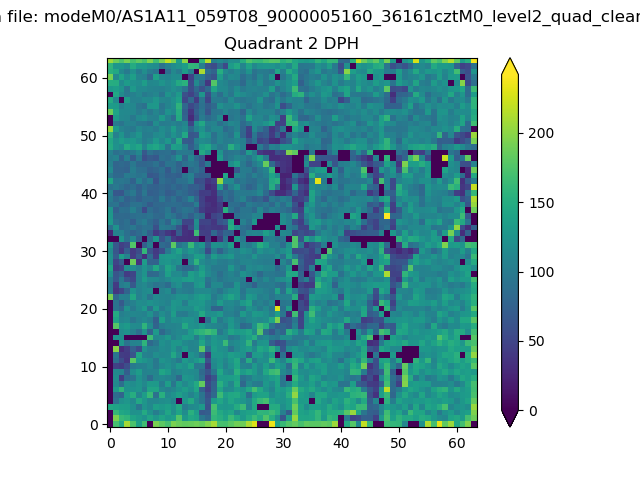
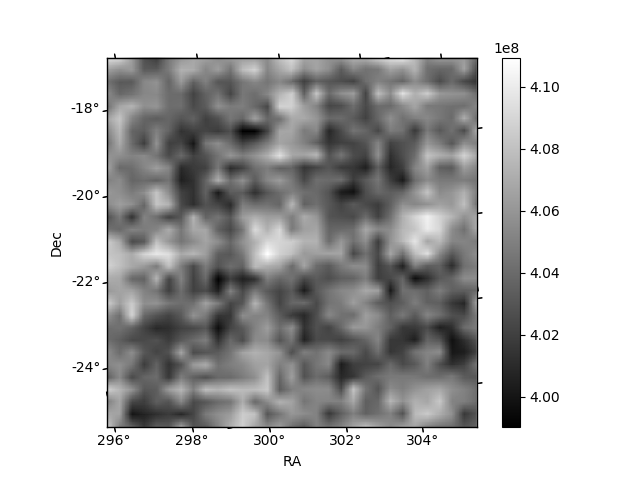
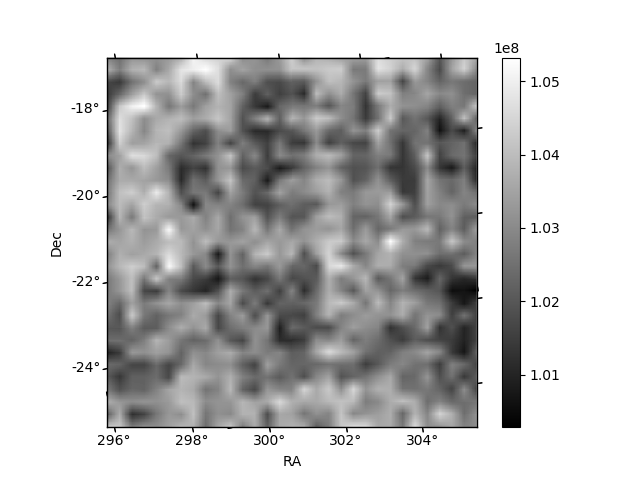
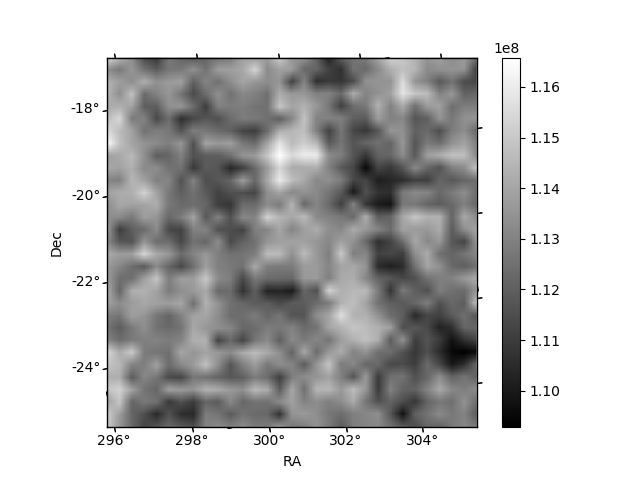
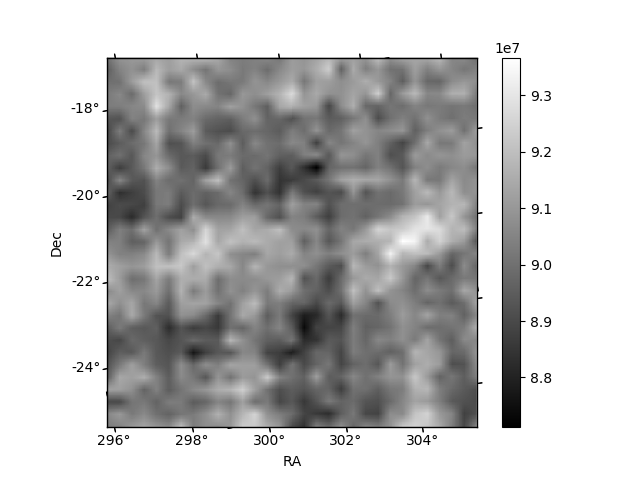
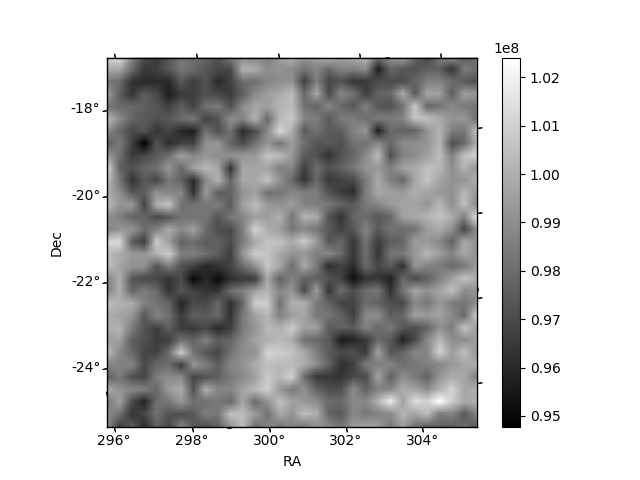
Histogram calculated using DETX and DETY for each event in the final _common_clean file
| Quadrant A | 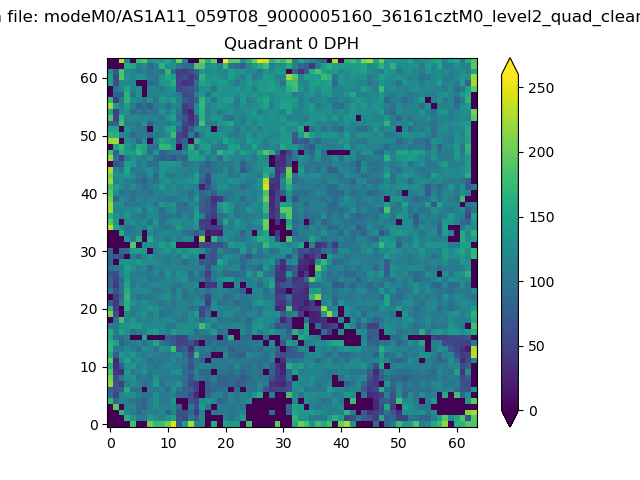 |
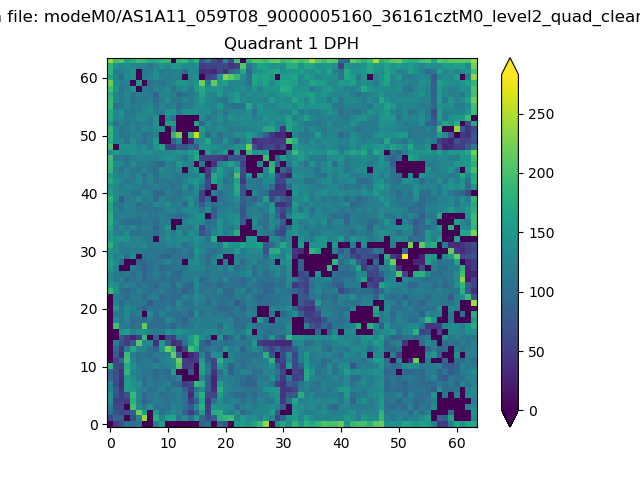 |
Quadrant B |
|---|---|---|---|
| Quadrant D | 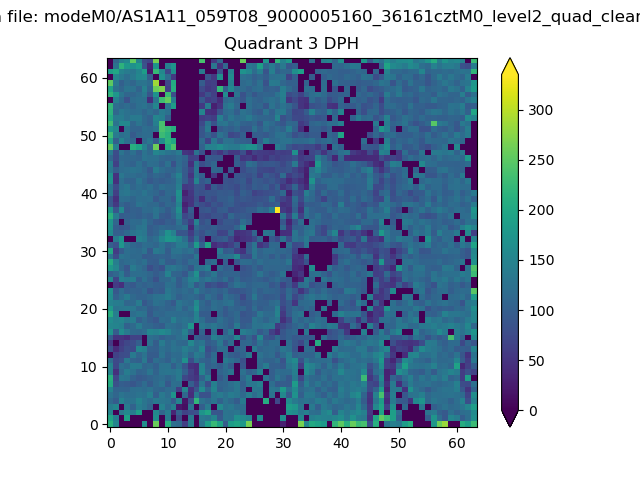 |
 |
Quadrant C |
| Plot type | Count rate plots | Images |
|---|---|---|
| Comparison with Poisson distribution Blue bars denote a histogram of data divided into 1 sec bins. Red curve is a Poisson curve with rate = median count rate of data. |
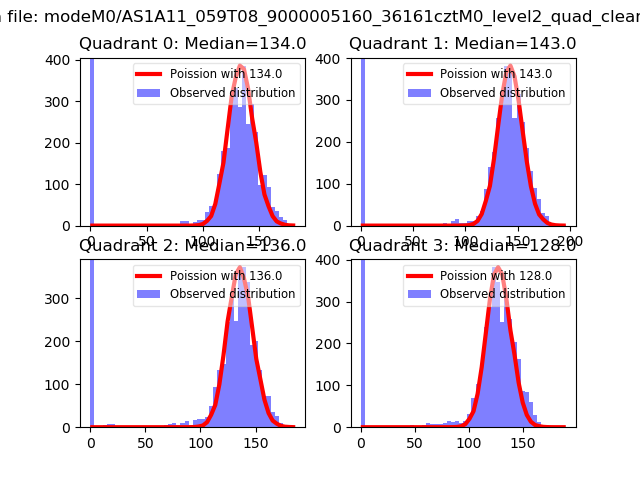 |
 |
| Quadrant-wise count rates Data is divided into 100 sec bins |
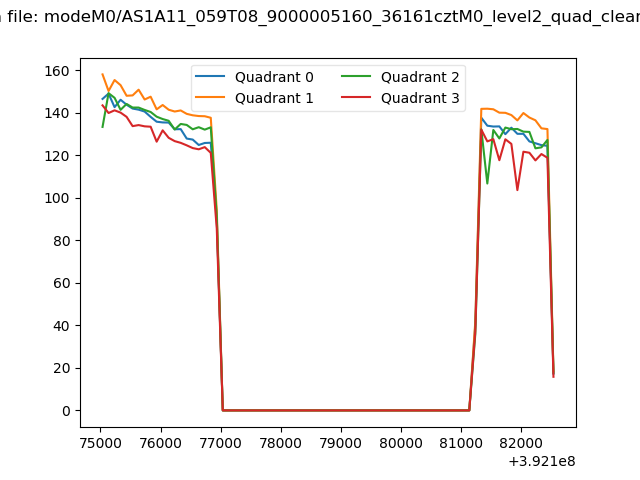 |
|
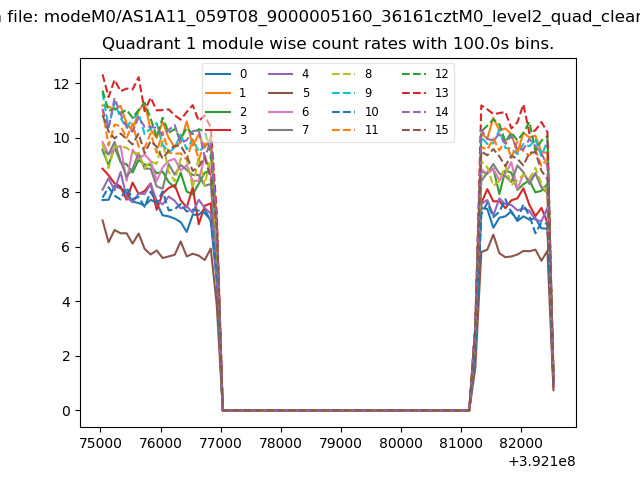
| Module-wise count rates for Quadrant A Data is divided into 100 sec bins |
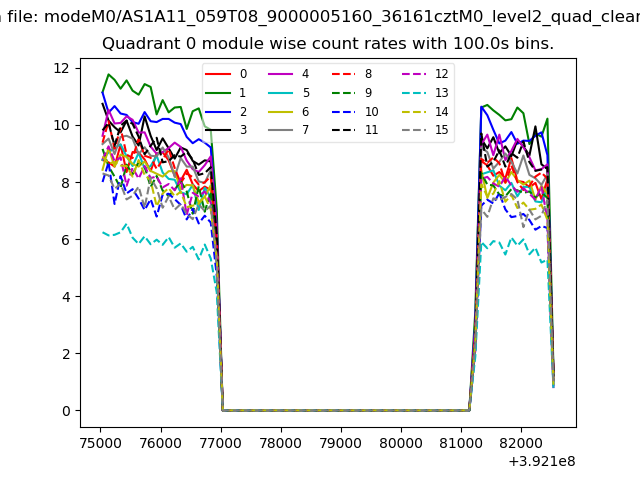 |
 |
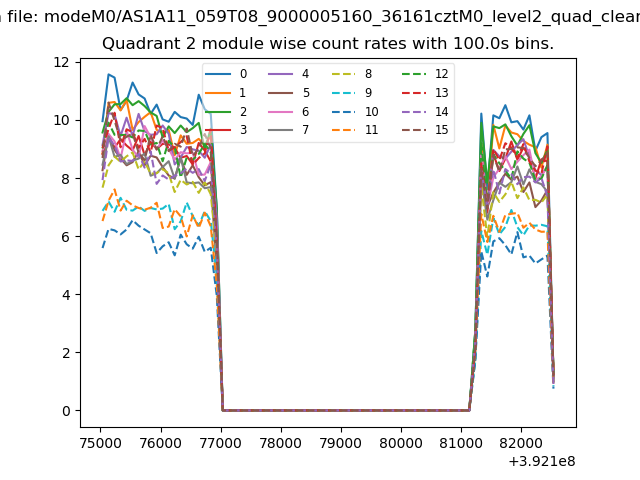
| Module-wise count rates for Quadrant B Data is divided into 100 sec bins |
 |
 |
| Module-wise count rates for Quadrant C Data is divided into 100 sec bins |
 |
 |
| Module-wise count rates for Quadrant D Data is divided into 100 sec bins |
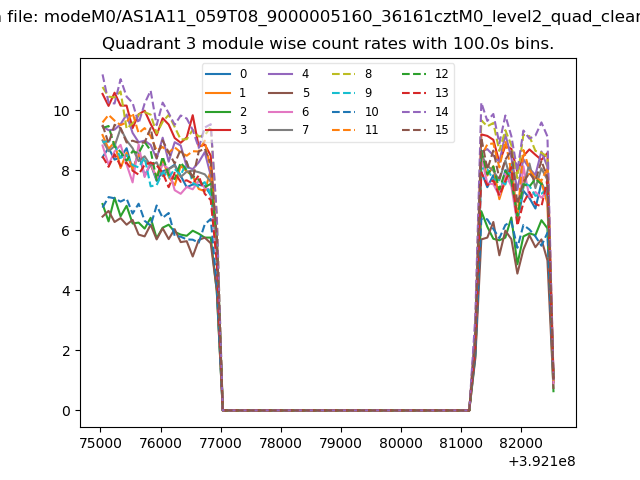 |
 |
| Parameter | Plot |
|---|---|
| CZT HV Monitor | 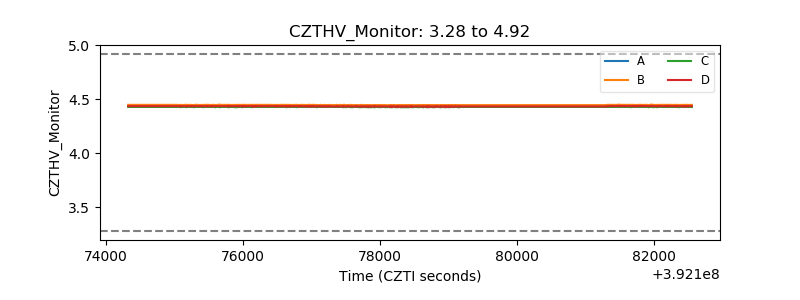 |
| D_VDD | 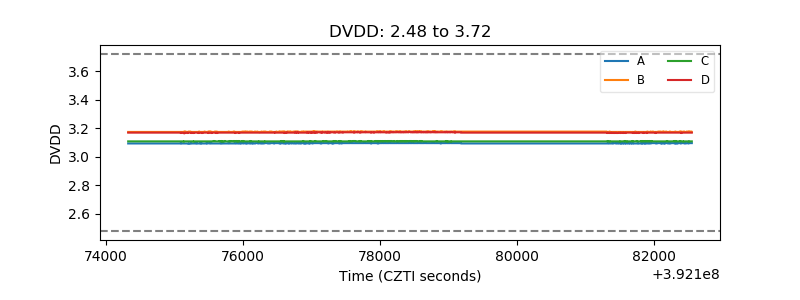 |
| Temperature 1 | 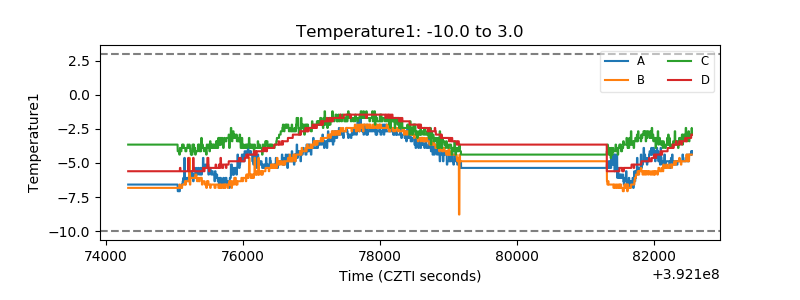 |
| Veto HV Monitor | 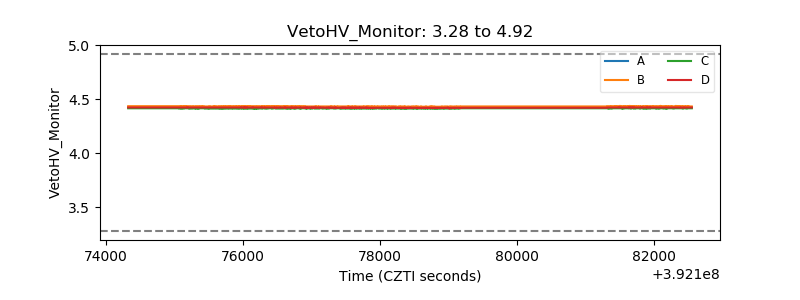 |
| Veto LLD | 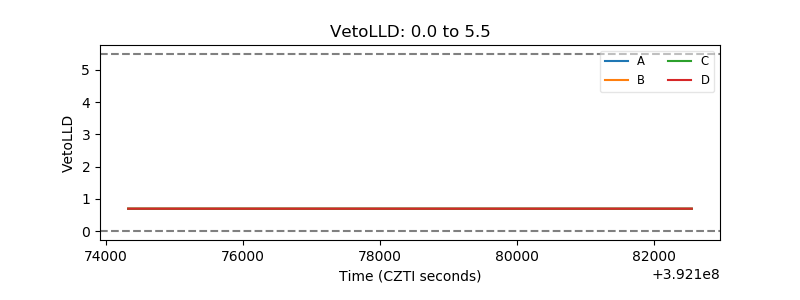 |
| Alpha Counter | 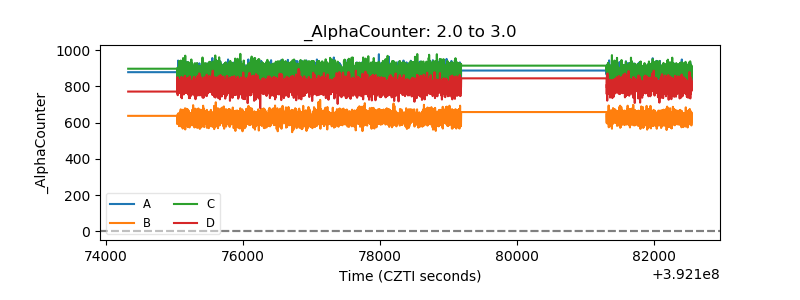 |
| _CPM_Rate | 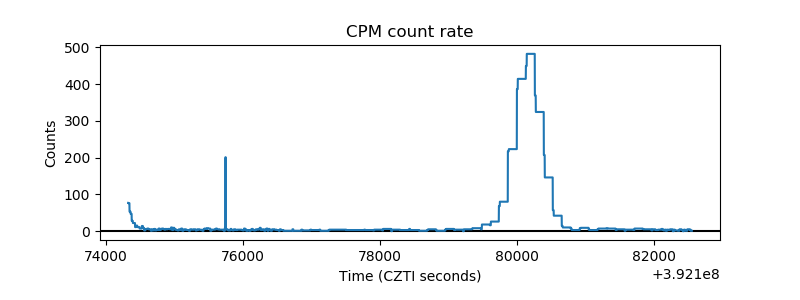 |
| CZT Counter | 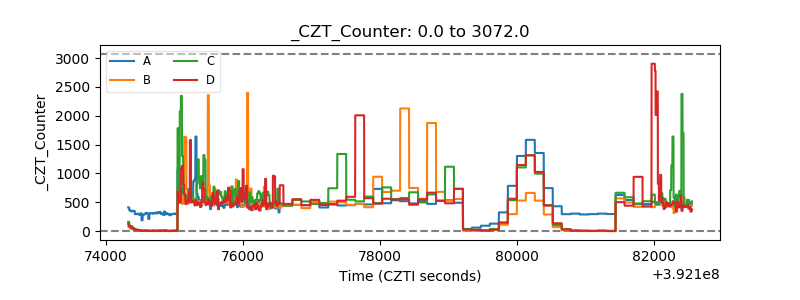 |
| +2.5 Volts monitor | 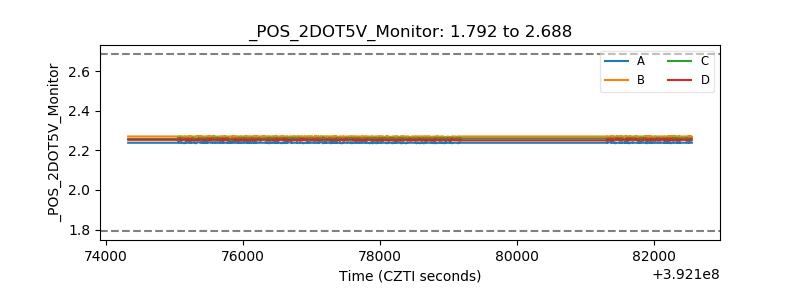 |
| +5 Volts monitor | 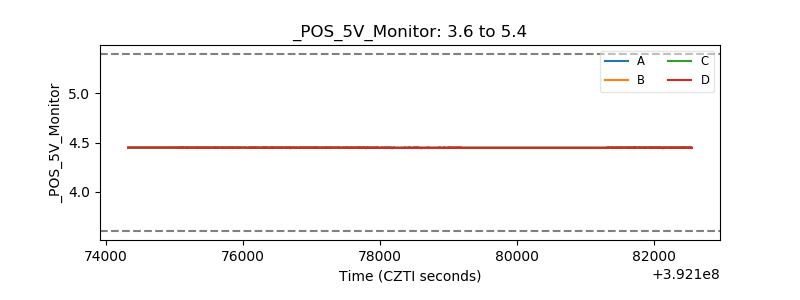 |
| _ROLL_ROT | 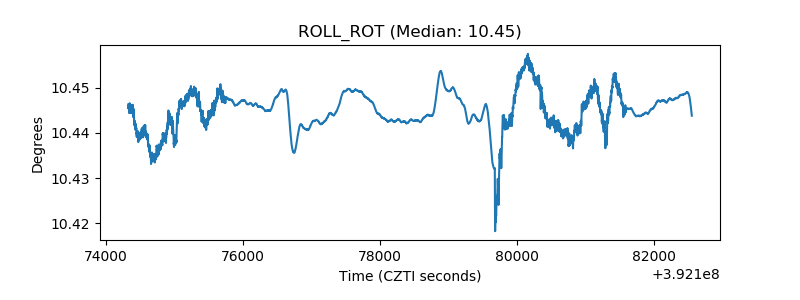 |
| _Roll_DEC | 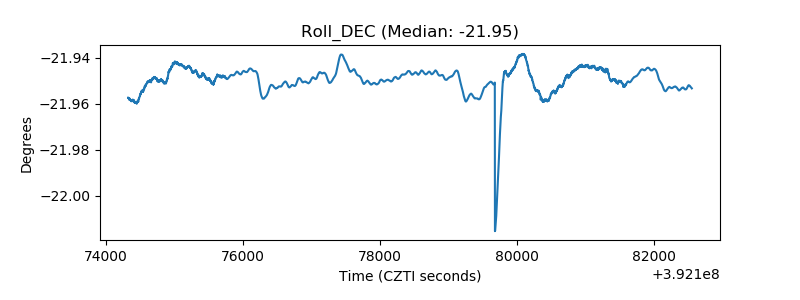 |
| _Roll_RA | 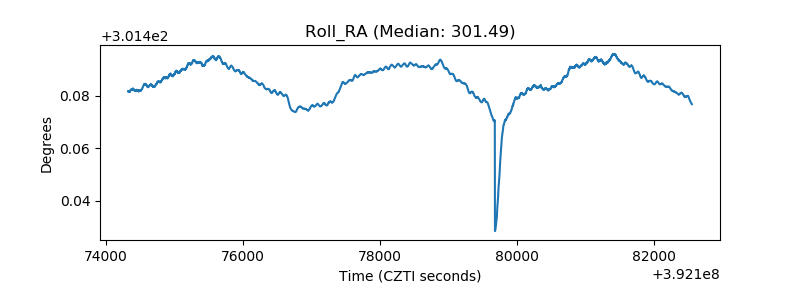 |
| Veto Counter | 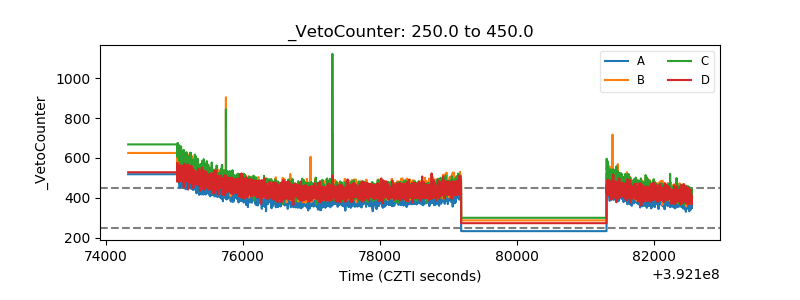 |