| Param | Original file | Final file |
|---|---|---|
| Filename | modeM0/AS1A11_059T08_9000005160_36155cztM0_level2.evt | modeM0/AS1A11_059T08_9000005160_36155cztM0_level2_quad_clean.evt |
| Size (bytes) | 248,633,280 | 45,472,320 |
| Size | 237.1 MB | 43.4 MB |
| Events in quadrant A | 1,482,298 | 293,893 |
| Events in quadrant B | 1,601,466 | 311,310 |
| Events in quadrant C | 1,822,934 | 288,380 |
| Events in quadrant D | 2,421,013 | 272,668 |
| Mode M9 | |||
|---|---|---|---|
| Quadrant | BADHDUFLAG | Total packets | Discarded packets |
| A | 0 | 17 | 0 |
| B | 0 | 17 | 0 |
| C | 0 | 17 | 0 |
| D | 0 | 17 | 0 |
| Mode M0 | |||
|---|---|---|---|
| Quadrant | BADHDUFLAG | Total packets | Discarded packets |
| A | 0 | 6376 | 160 |
| B | 0 | 6748 | 176 |
| C | 0 | 7331 | 230 |
| D | 0 | 9452 | 284 |
| Mode SS | |||
|---|---|---|---|
| Quadrant | BADHDUFLAG | Total packets | Discarded packets |
| A | 0 | 62 | 2 |
| B | 0 | 62 | 4 |
| C | 0 | 62 | 0 |
| D | 0 | 62 | 0 |
| Quadrant | Total seconds | Saturated seconds | Saturation percentage |
|---|---|---|---|
| A | 2959 | 7 | 0.236566% |
| B | 2960 | 34 | 1.148649% |
| C | 2948 | 99 | 3.358209% |
| D | 2937 | 186 | 6.332993% |
Noise dominated data is calculated using 1-second bins in cleaned event files. If a bin has >2000 counts, and if more than 50% of those come from <1% of pixels, then it is considered to be noise-dominated and hence unusable.
| Quadrant | # 1 sec bins | Bins with >0 counts | Bins with >2000 counts | High rate bins dominated by noise | Noise dominated (total time) | Noise dominated (detector-on time) | Marked lightcurve |
|---|---|---|---|---|---|---|---|
| A | 4739 | 3033 | 0 | 0 | 0.00% | 0.00% | 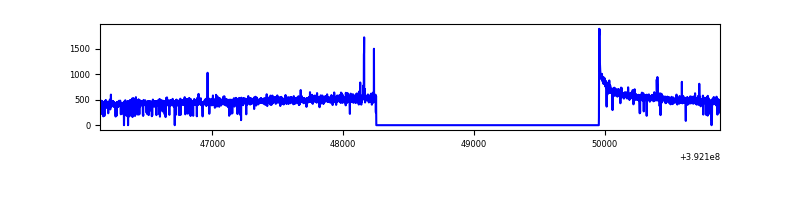 |
| B | 4739 | 3035 | 13 | 13 | 0.27% | 0.43% | 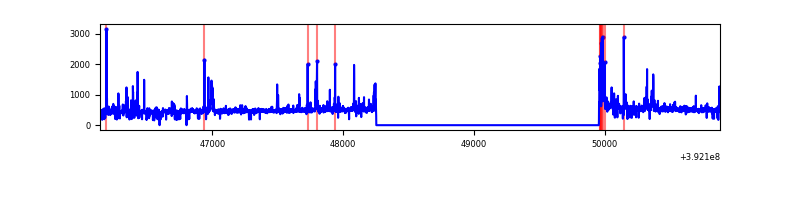 |
| C | 4740 | 3033 | 66 | 66 | 1.39% | 2.18% | 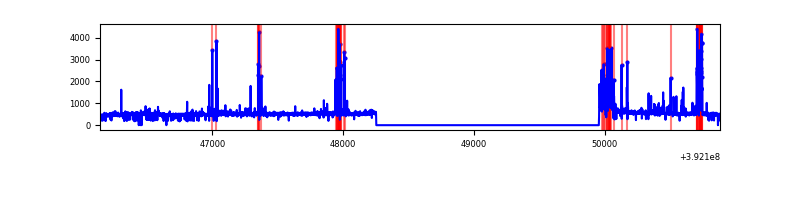 |
| D | 4740 | 3032 | 149 | 149 | 3.14% | 4.91% | 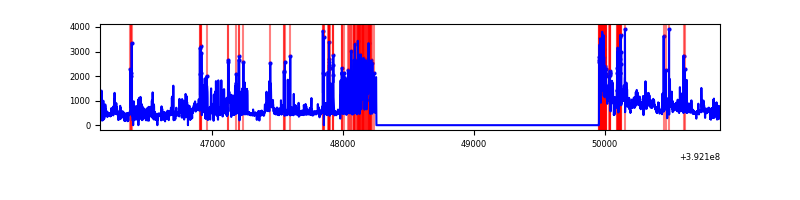 |
Top three noisy pixels from each quadrant. If the there are fewer than three noisy pixels in the level2.evt file, extra rows are filled as -1
| Pixel properties | Quadrant properties | ||||||
|---|---|---|---|---|---|---|---|
| Quadrant | DetID | PixID | Counts | Sigma | Mean | Median | Sigma |
| A | 10 | 83 | 89592 | 1212.17 | 356 | 348 | 73.6 |
| A | 9 | 143 | 10724 | 140.93 | 356 | 348 | 73.6 |
| A | 13 | 254 | 4979 | 62.9 | 356 | 348 | 73.6 |
| B | 5 | 172 | 131059 | 1850.11 | 358 | 348 | 70.6 |
| B | 0 | 190 | 22402 | 312.15 | 358 | 348 | 70.6 |
| B | 5 | 255 | 19969 | 277.71 | 358 | 348 | 70.6 |
| C | 0 | 207 | 250161 | 3085.49 | 343 | 345 | 81.0 |
| C | 15 | 214 | 122589 | 1509.84 | 343 | 345 | 81.0 |
| C | 0 | 10 | 94896 | 1167.8 | 343 | 345 | 81.0 |
| D | 1 | 52 | 727585 | 8788.32 | 337 | 328 | 82.8 |
| D | 13 | 249 | 104200 | 1255.21 | 337 | 328 | 82.8 |
| D | 2 | 249 | 92102 | 1109.02 | 337 | 328 | 82.8 |
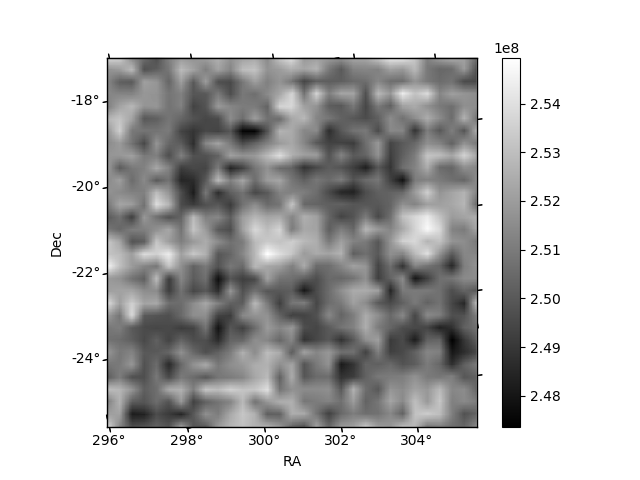
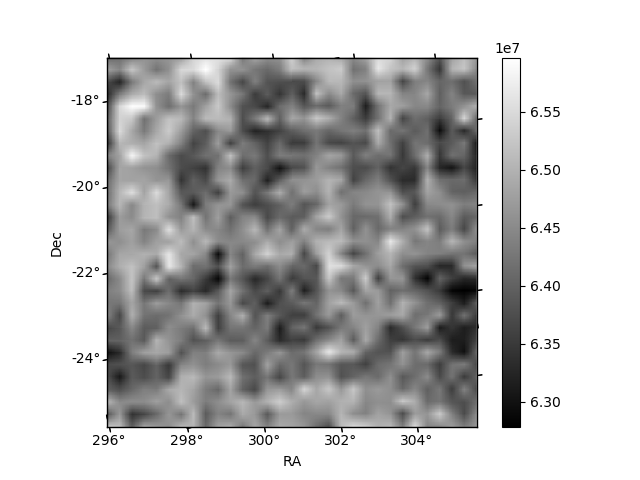
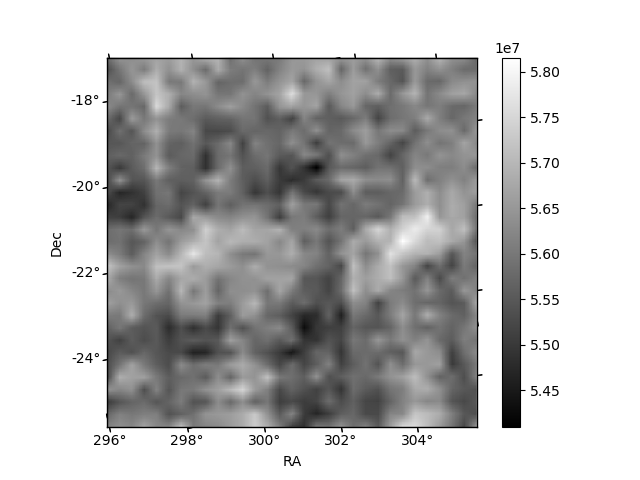
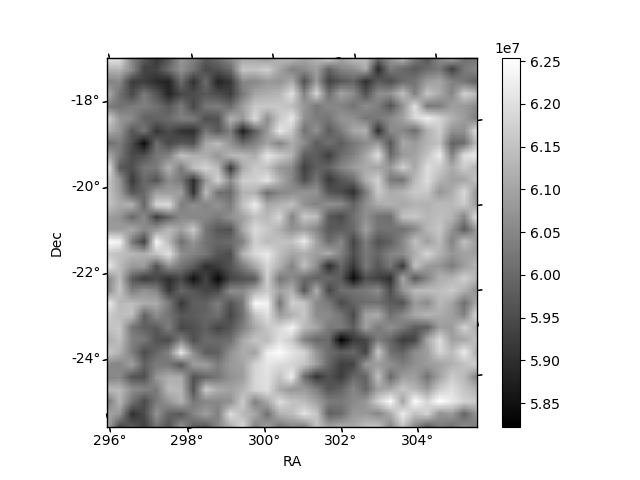
Histogram calculated using DETX and DETY for each event in the final _common_clean file
| Quadrant A | 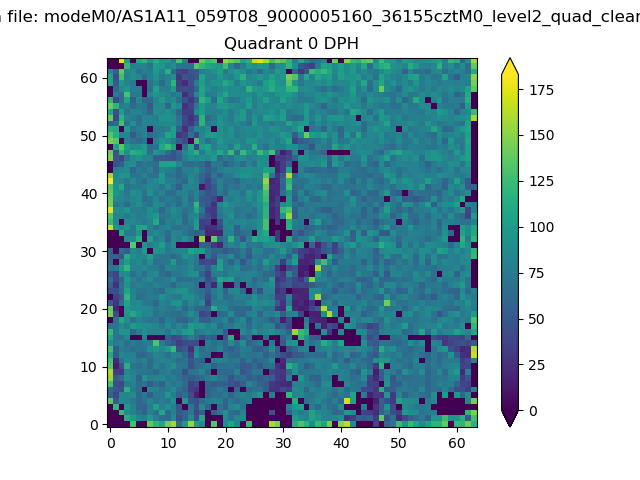 |
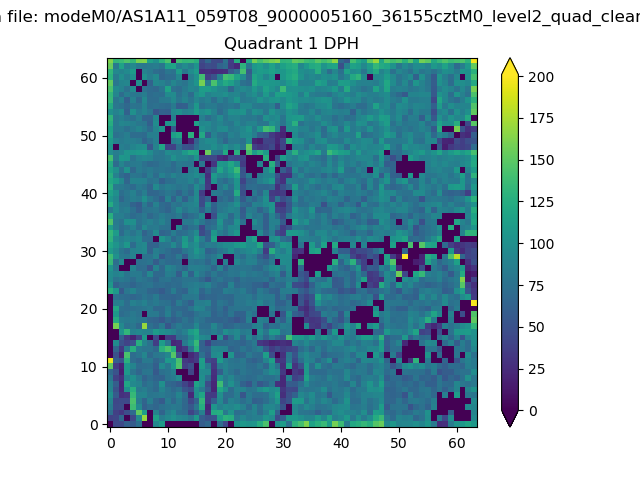 |
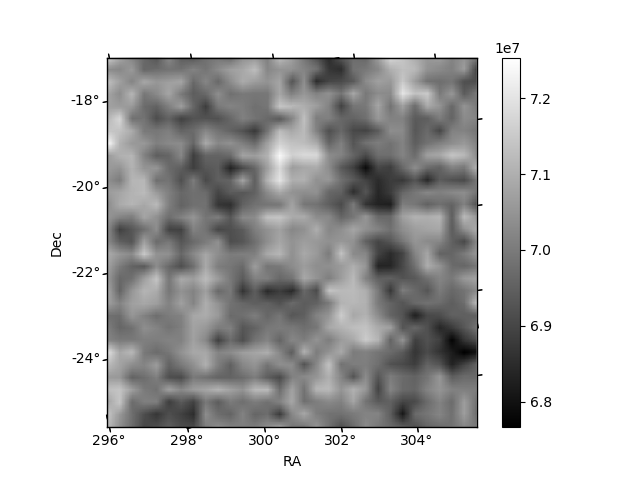
Quadrant B |
|---|---|---|---|
| Quadrant D | 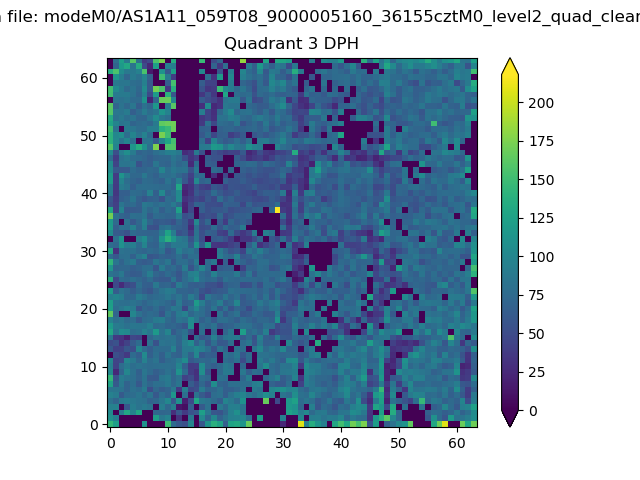 |
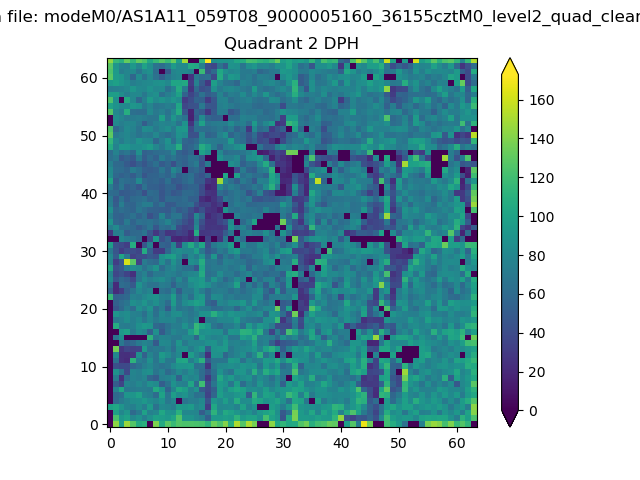 |
Quadrant C |
| Plot type | Count rate plots | Images |
|---|---|---|
| Comparison with Poisson distribution Blue bars denote a histogram of data divided into 1 sec bins. Red curve is a Poisson curve with rate = median count rate of data. |
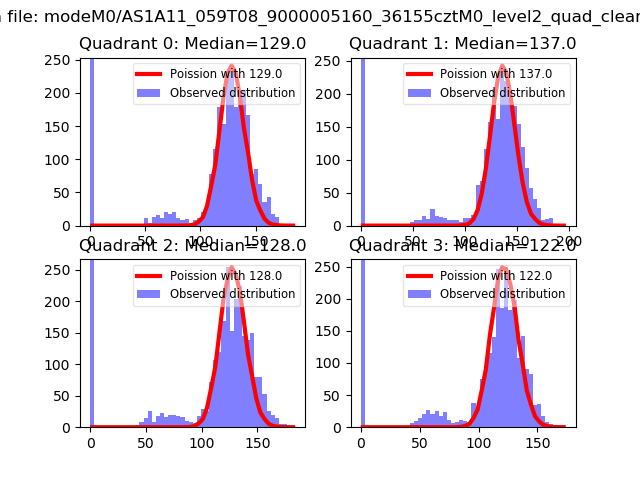 |
 |
| Quadrant-wise count rates Data is divided into 100 sec bins |
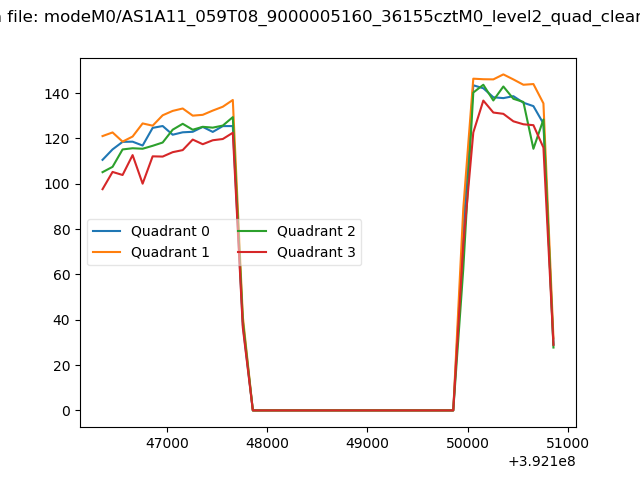 |
|
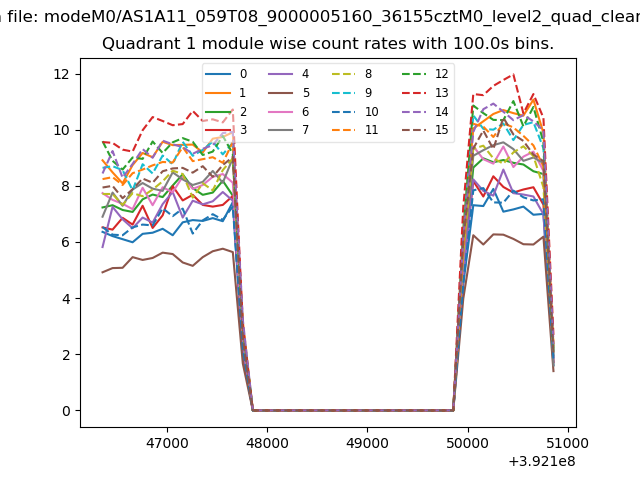
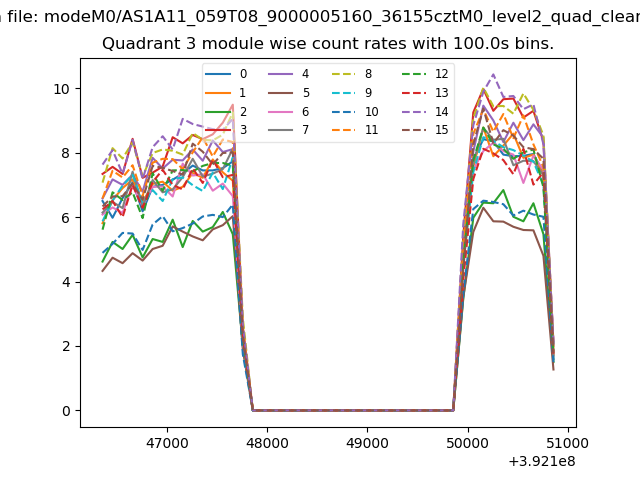
| Module-wise count rates for Quadrant A Data is divided into 100 sec bins |
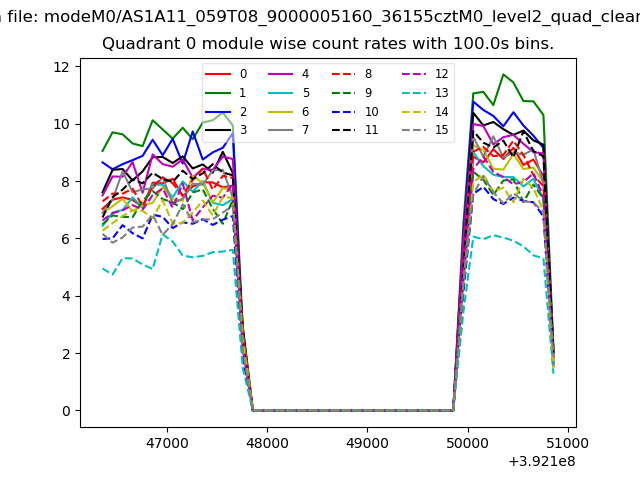 |
 |
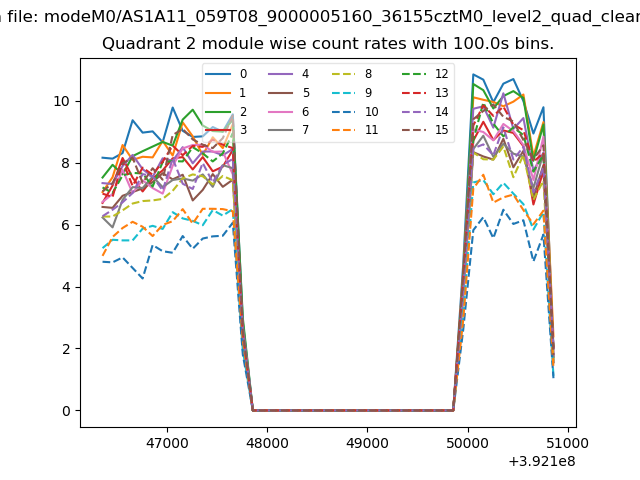
| Module-wise count rates for Quadrant B Data is divided into 100 sec bins |
 |
 |
| Module-wise count rates for Quadrant C Data is divided into 100 sec bins |
 |
 |
| Module-wise count rates for Quadrant D Data is divided into 100 sec bins |
 |
 |
| Parameter | Plot |
|---|---|
| CZT HV Monitor | 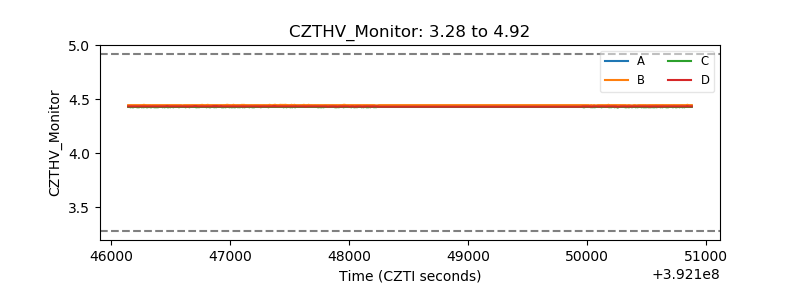 |
| D_VDD | 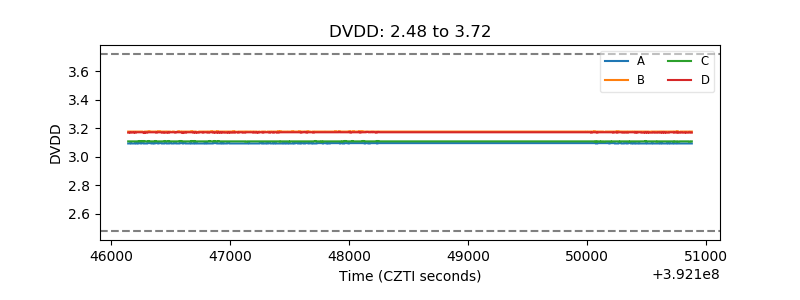 |
| Temperature 1 | 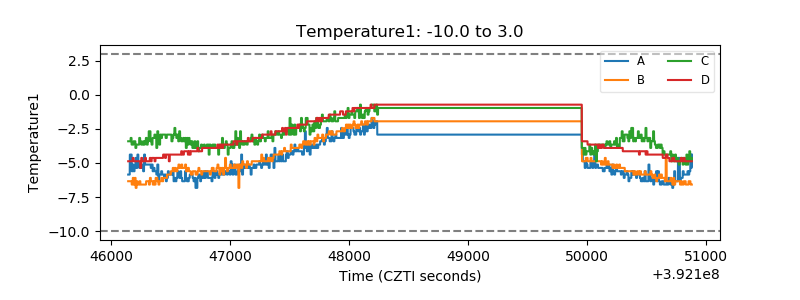 |
| Veto HV Monitor | 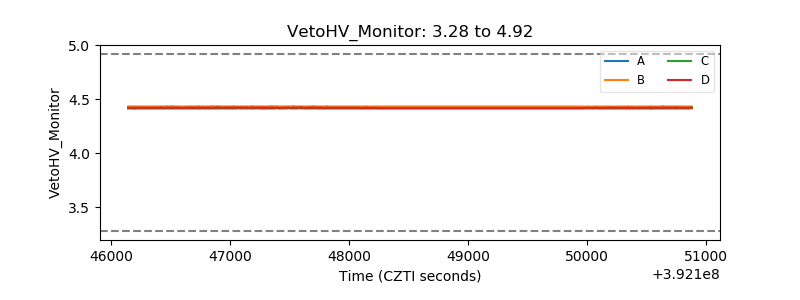 |
| Veto LLD | 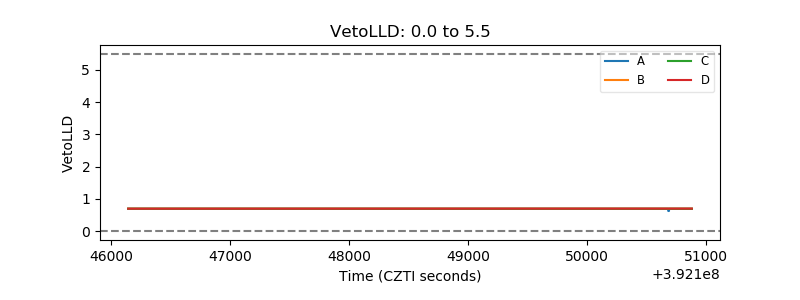 |
| Alpha Counter | 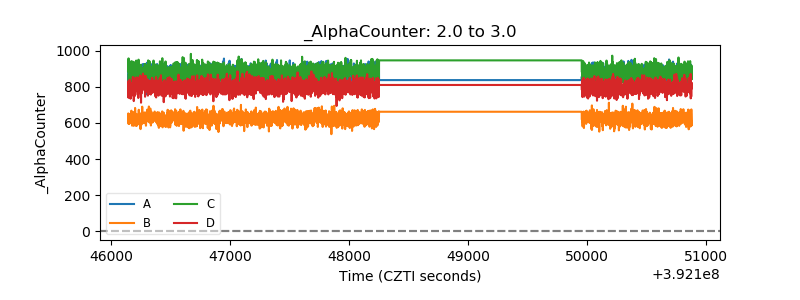 |
| _CPM_Rate | 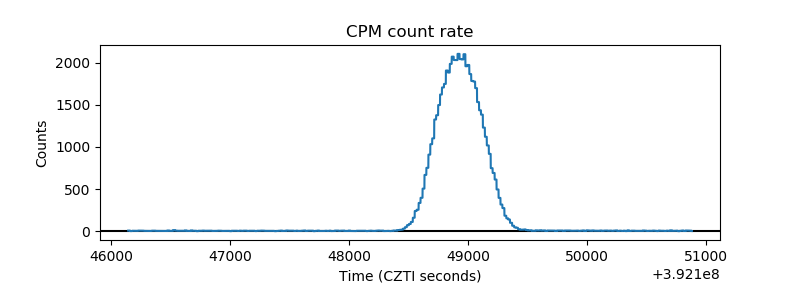 |
| CZT Counter | 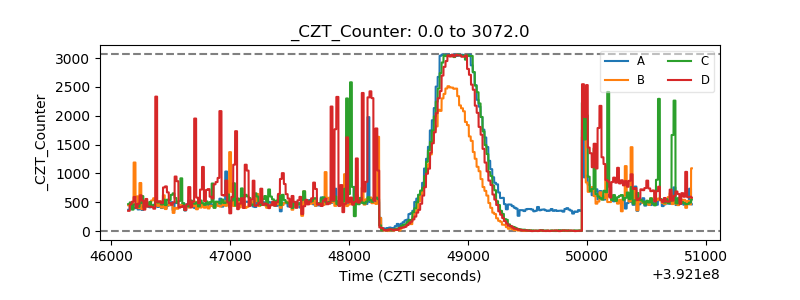 |
| +2.5 Volts monitor | 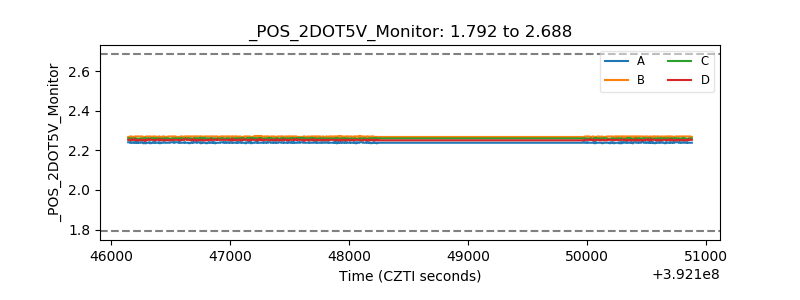 |
| +5 Volts monitor | 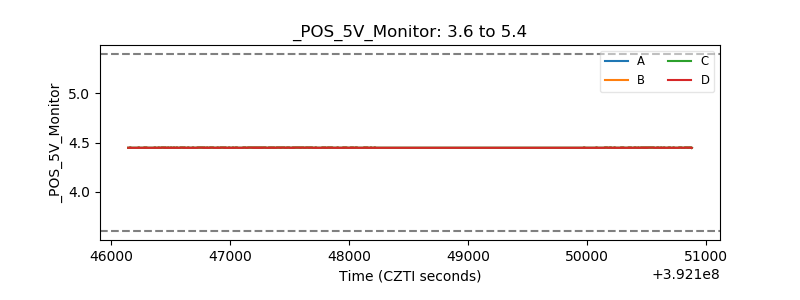 |
| _ROLL_ROT | 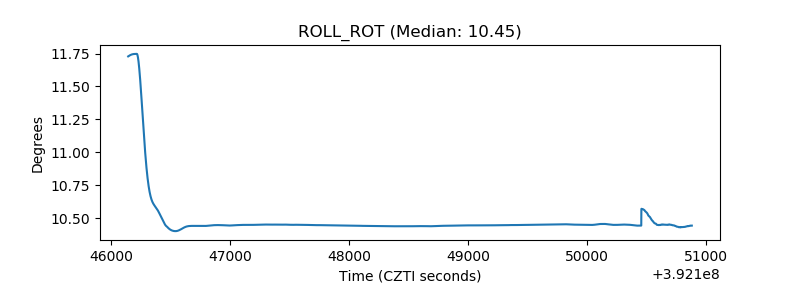 |
| _Roll_DEC | 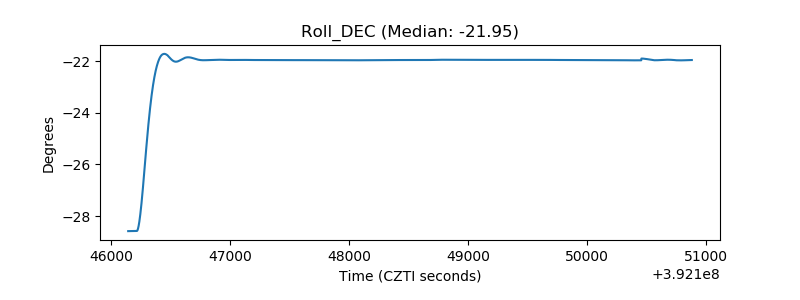 |
| _Roll_RA | 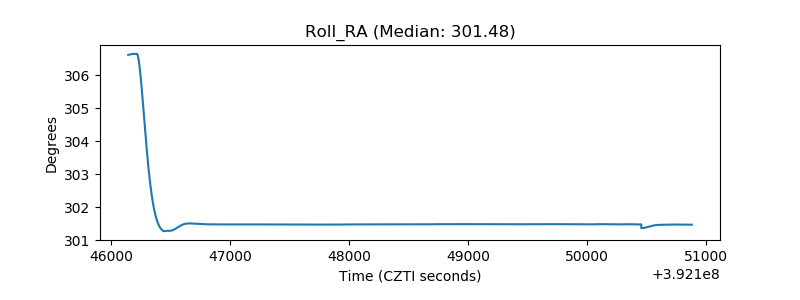 |
| Veto Counter | 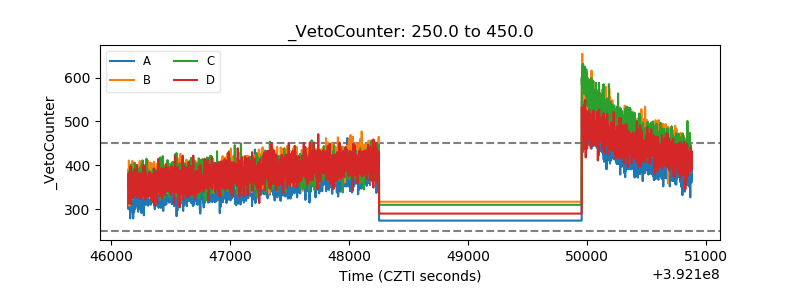 |