| Param | Original file | Final file |
|---|---|---|
| Filename | modeM0/AS1T04_069T01_9000005158_36154cztM0_level2.evt | modeM0/AS1T04_069T01_9000005158_36154cztM0_level2_quad_clean.evt |
| Size (bytes) | 434,928,960 | 74,934,720 |
| Size | 414.8 MB | 71.5 MB |
| Events in quadrant A | 2,794,753 | 484,286 |
| Events in quadrant B | 3,133,280 | 479,604 |
| Events in quadrant C | 3,087,006 | 465,264 |
| Events in quadrant D | 3,773,854 | 445,538 |
| Mode M0 | |||
|---|---|---|---|
| Quadrant | BADHDUFLAG | Total packets | Discarded packets |
| A | 0 | 11958 | 3 |
| B | 0 | 12981 | 2 |
| C | 0 | 12671 | 2 |
| D | 0 | 14962 | 2 |
| Mode M9 | |||
|---|---|---|---|
| Quadrant | BADHDUFLAG | Total packets | Discarded packets |
| A | 0 | 15 | 0 |
| B | 0 | 15 | 0 |
| C | 0 | 15 | 0 |
| D | 0 | 16 | 0 |
| Mode SS | |||
|---|---|---|---|
| Quadrant | BADHDUFLAG | Total packets | Discarded packets |
| A | 0 | 116 | 0 |
| B | 0 | 116 | 0 |
| C | 0 | 116 | 0 |
| D | 0 | 116 | 0 |
| Quadrant | Total seconds | Saturated seconds | Saturation percentage |
|---|---|---|---|
| A | 5632 | 14 | 0.248580% |
| B | 5632 | 85 | 1.509233% |
| C | 5632 | 42 | 0.745739% |
| D | 5632 | 197 | 3.497869% |
Noise dominated data is calculated using 1-second bins in cleaned event files. If a bin has >2000 counts, and if more than 50% of those come from <1% of pixels, then it is considered to be noise-dominated and hence unusable.
| Quadrant | # 1 sec bins | Bins with >0 counts | Bins with >2000 counts | High rate bins dominated by noise | Noise dominated (total time) | Noise dominated (detector-on time) | Marked lightcurve |
|---|---|---|---|---|---|---|---|
| A | 7185 | 5633 | 1 | 1 | 0.01% | 0.02% | 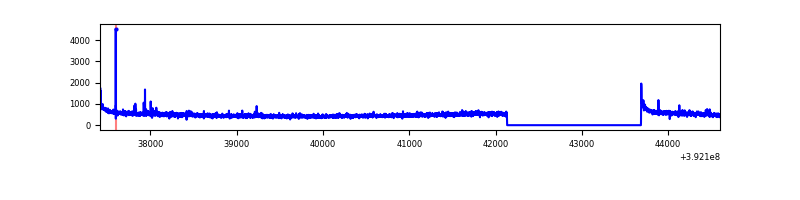 |
| B | 7185 | 5633 | 50 | 50 | 0.70% | 0.89% | 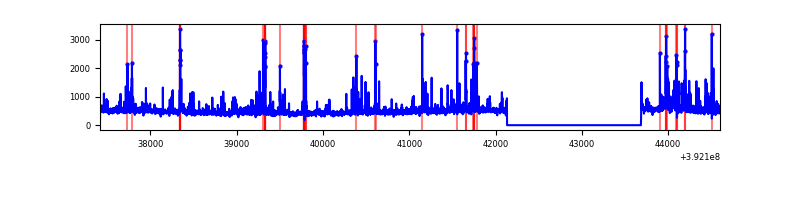 |
| C | 7185 | 5633 | 30 | 30 | 0.42% | 0.53% | 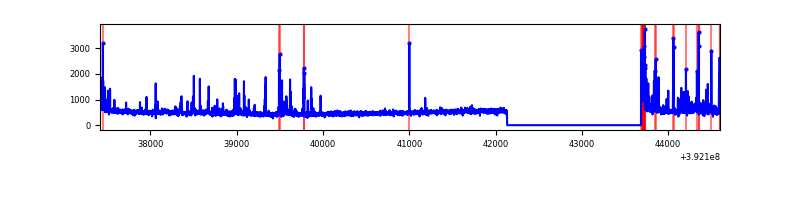 |
| D | 7185 | 5633 | 165 | 165 | 2.30% | 2.93% | 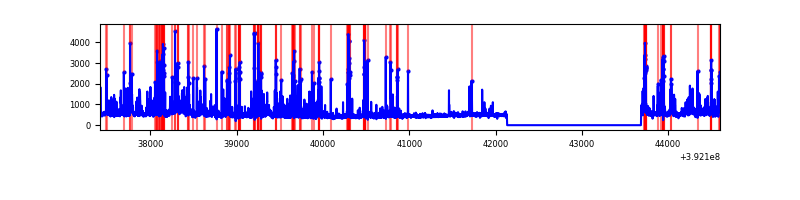 |
Top three noisy pixels from each quadrant. If the there are fewer than three noisy pixels in the level2.evt file, extra rows are filled as -1
| Pixel properties | Quadrant properties | ||||||
|---|---|---|---|---|---|---|---|
| Quadrant | DetID | PixID | Counts | Sigma | Mean | Median | Sigma |
| A | 10 | 83 | 190222 | 1425.44 | 653 | 640 | 133.0 |
| A | 8 | 144 | 39774 | 294.24 | 653 | 640 | 133.0 |
| A | 9 | 143 | 19765 | 143.8 | 653 | 640 | 133.0 |
| B | 5 | 172 | 420510 | 3380.69 | 643 | 625 | 124.2 |
| B | 4 | 171 | 56278 | 448.09 | 643 | 625 | 124.2 |
| B | 0 | 213 | 41477 | 328.92 | 643 | 625 | 124.2 |
| C | 15 | 208 | 270874 | 1843.06 | 624 | 627 | 146.6 |
| C | 15 | 214 | 239140 | 1626.63 | 624 | 627 | 146.6 |
| C | 0 | 10 | 130478 | 885.57 | 624 | 627 | 146.6 |
| D | 2 | 249 | 358829 | 2331.39 | 622 | 605 | 153.7 |
| D | 1 | 52 | 256210 | 1663.52 | 622 | 605 | 153.7 |
| D | 13 | 249 | 168687 | 1093.91 | 622 | 605 | 153.7 |
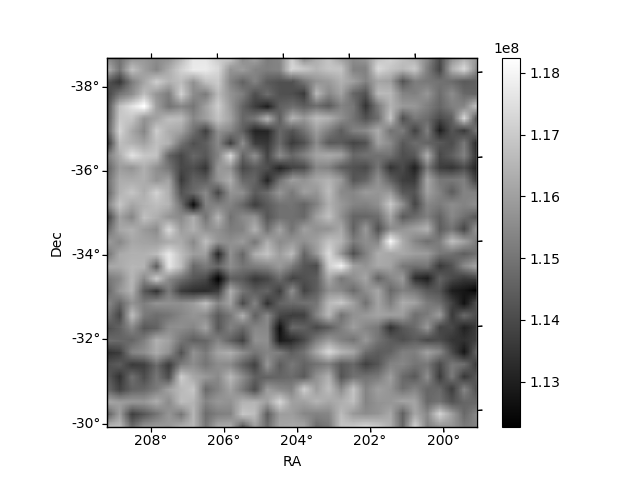
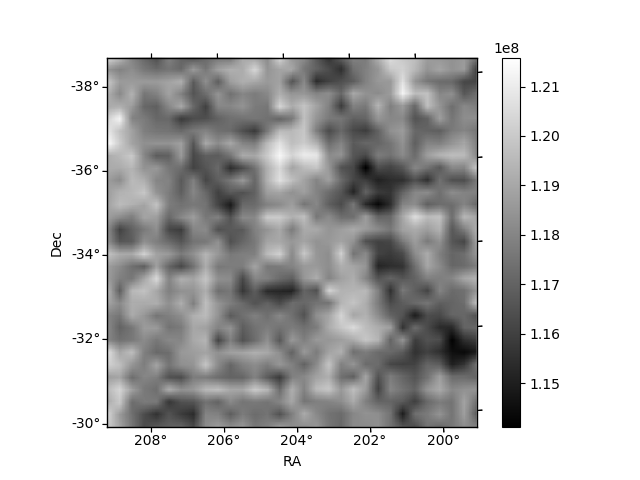
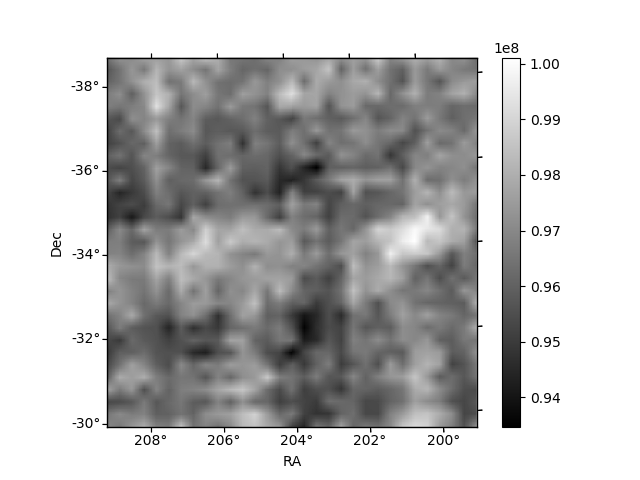
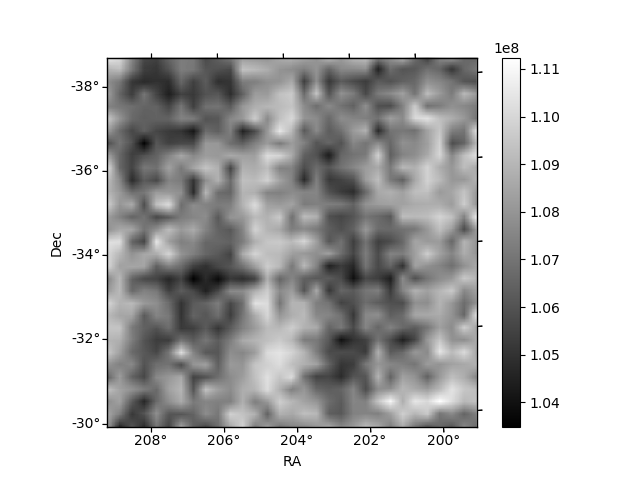
Histogram calculated using DETX and DETY for each event in the final _common_clean file
| Quadrant A | 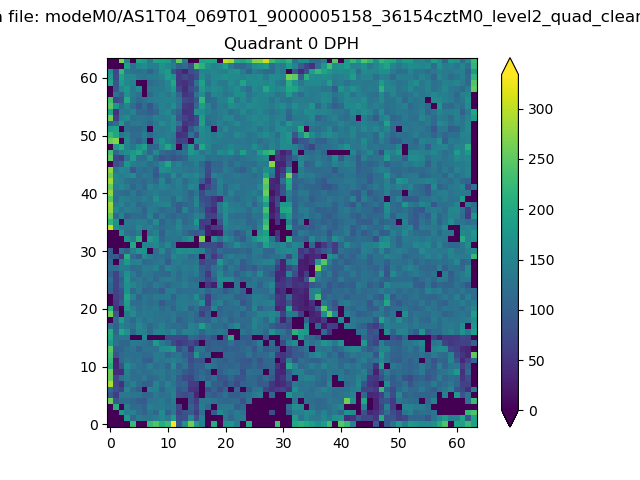 |
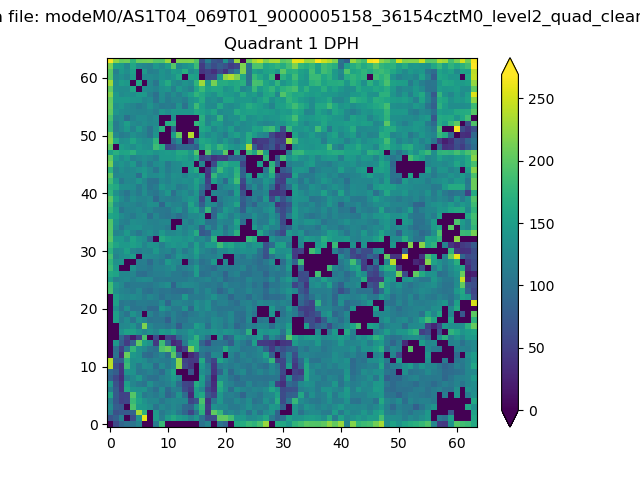 |
Quadrant B |
|---|---|---|---|
| Quadrant D | 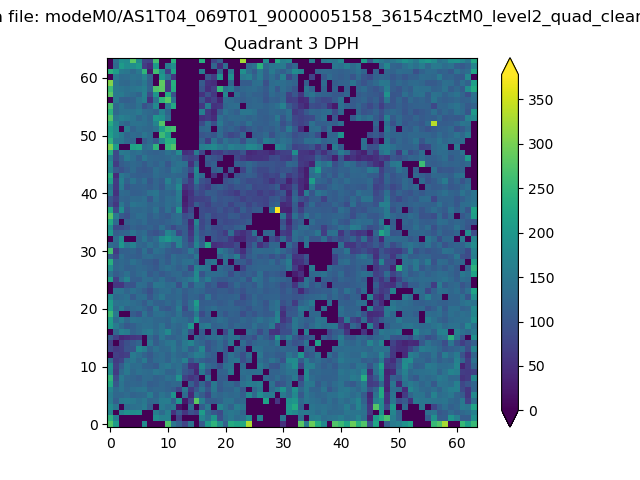 |
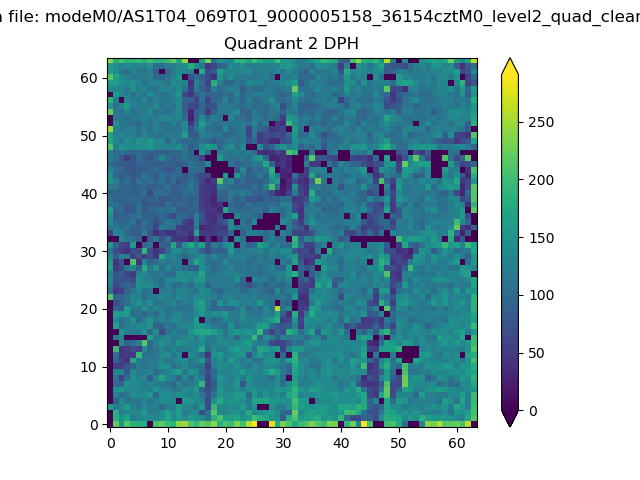 |
Quadrant C |
| Plot type | Count rate plots | Images |
|---|---|---|
| Comparison with Poisson distribution Blue bars denote a histogram of data divided into 1 sec bins. Red curve is a Poisson curve with rate = median count rate of data. |
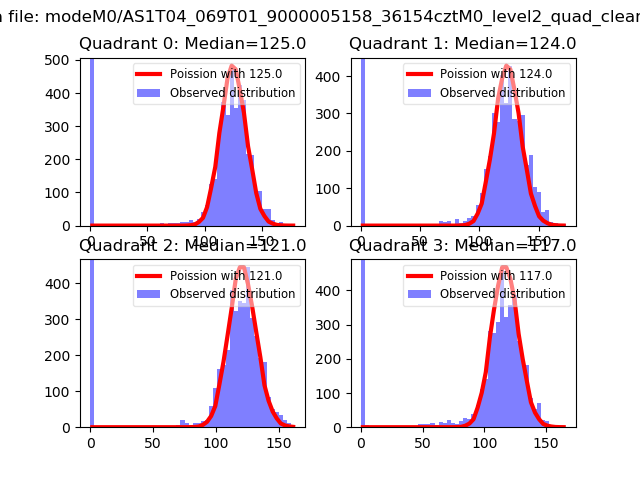 |
 |
| Quadrant-wise count rates Data is divided into 100 sec bins |
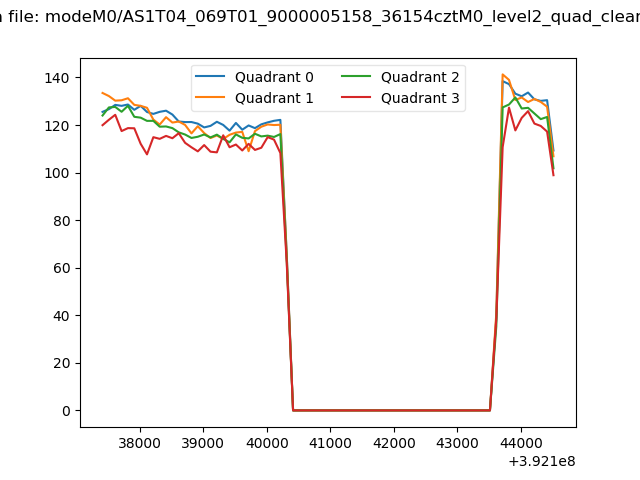 |
|
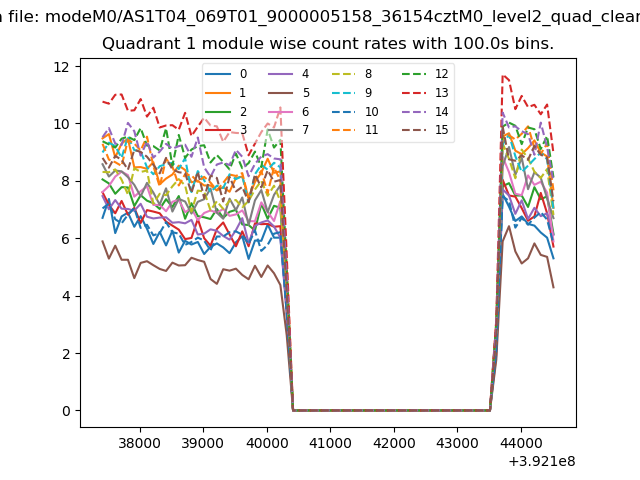
| Module-wise count rates for Quadrant A Data is divided into 100 sec bins |
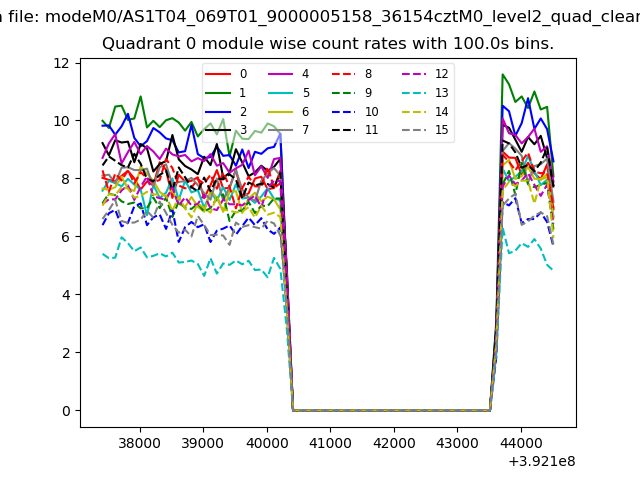 |
 |
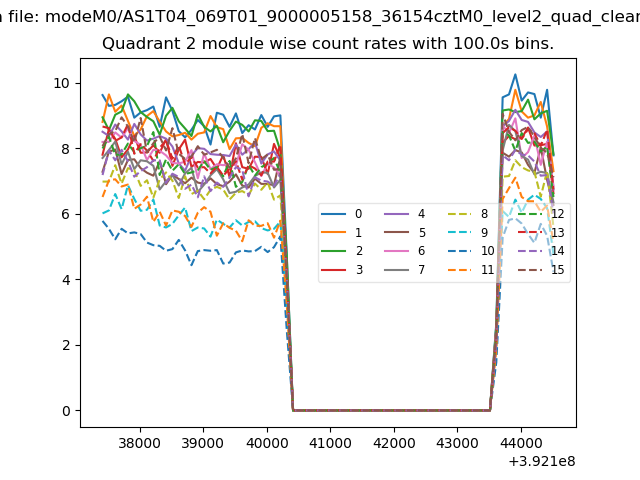
| Module-wise count rates for Quadrant B Data is divided into 100 sec bins |
 |
 |
| Module-wise count rates for Quadrant C Data is divided into 100 sec bins |
 |
 |
| Module-wise count rates for Quadrant D Data is divided into 100 sec bins |
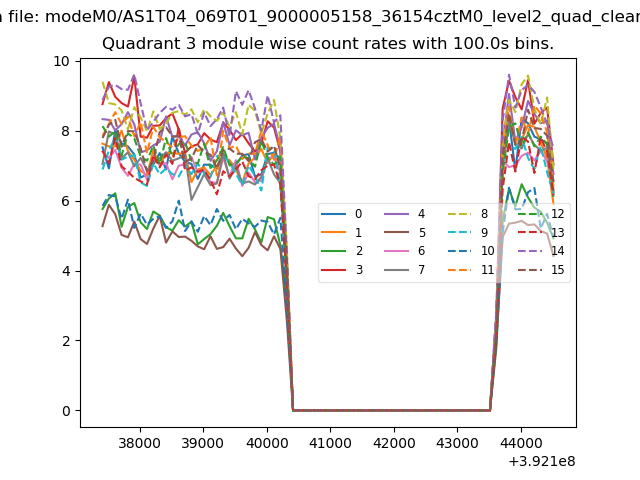 |
 |
| Parameter | Plot |
|---|---|
| CZT HV Monitor | 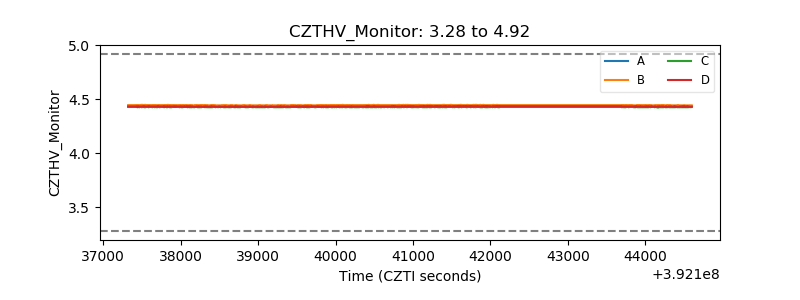 |
| D_VDD | 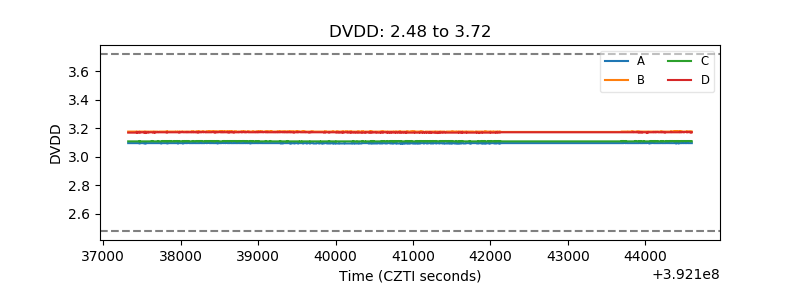 |
| Temperature 1 | 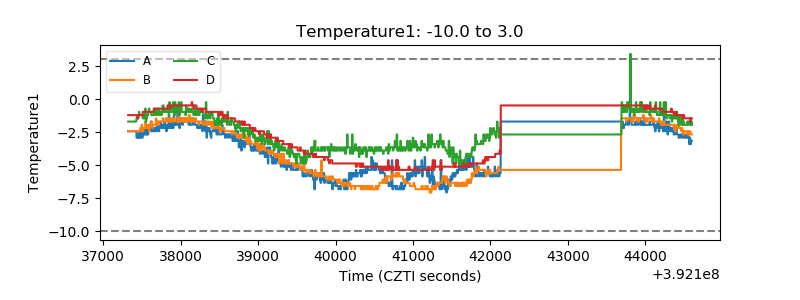 |
| Veto HV Monitor | 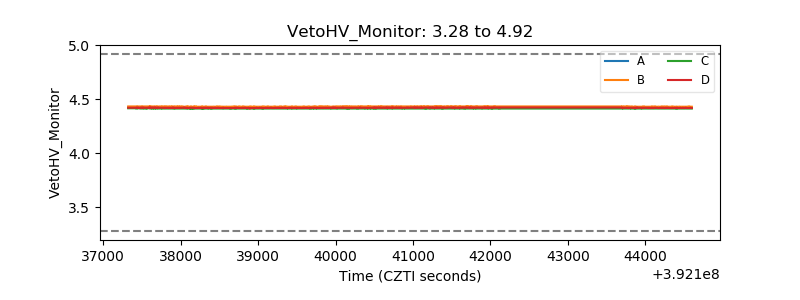 |
| Veto LLD | 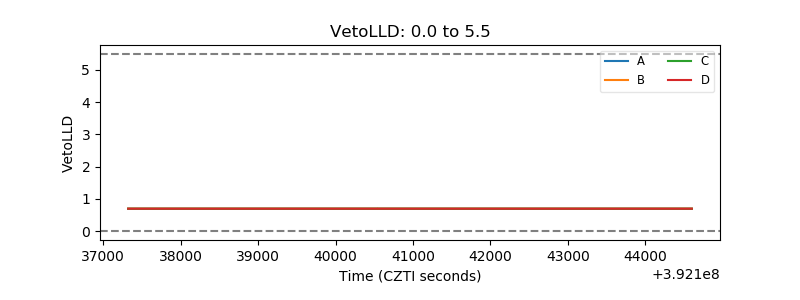 |
| Alpha Counter | 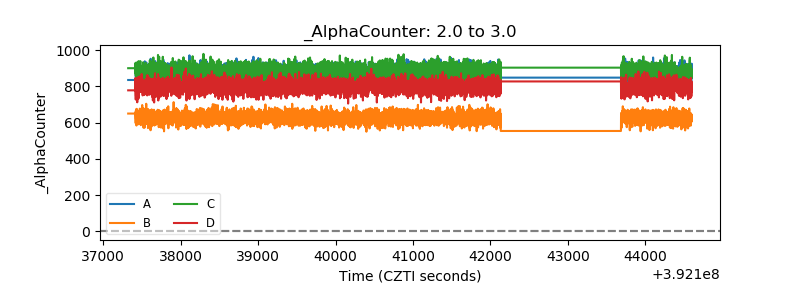 |
| _CPM_Rate | 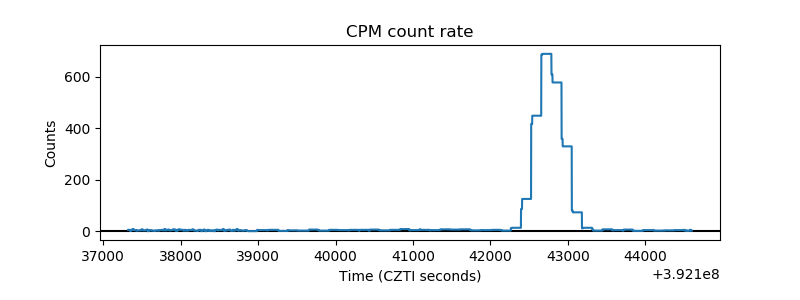 |
| CZT Counter | 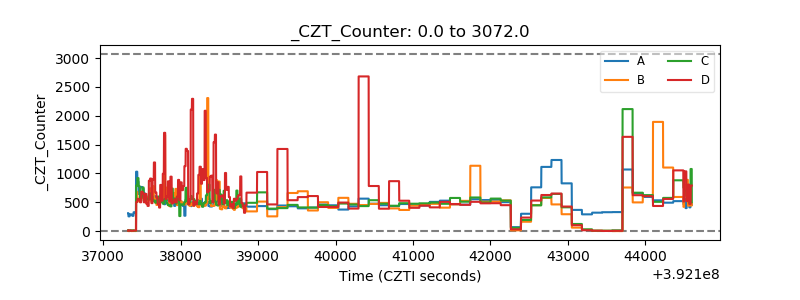 |
| +2.5 Volts monitor | 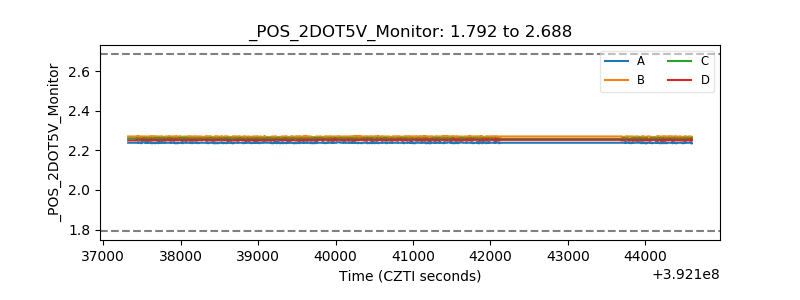 |
| +5 Volts monitor | 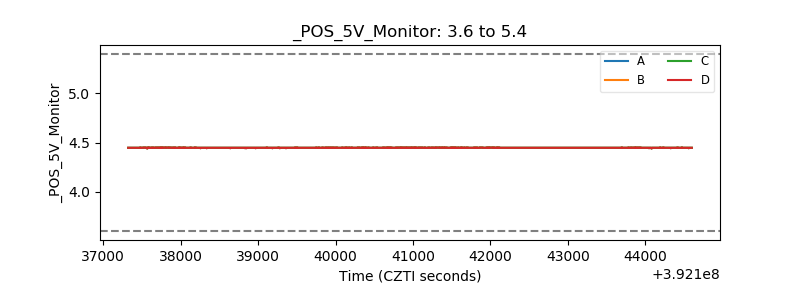 |
| _ROLL_ROT | 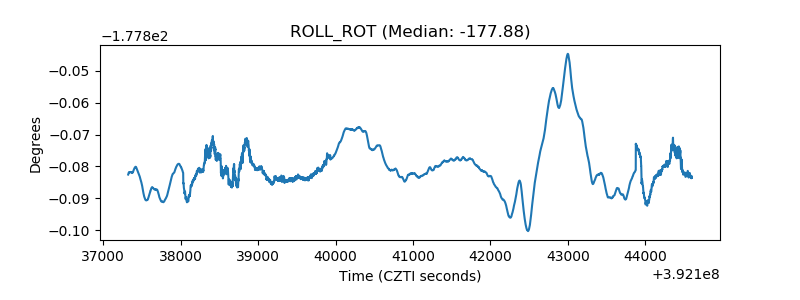 |
| _Roll_DEC | 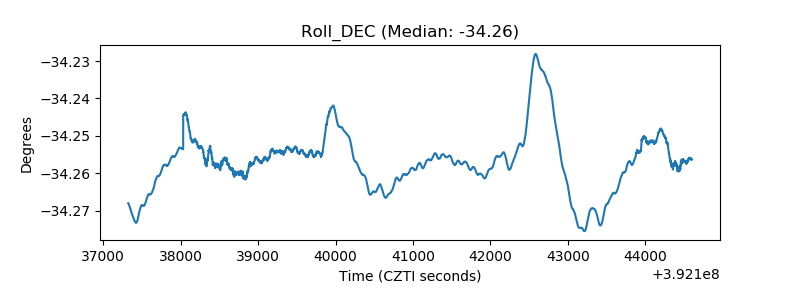 |
| _Roll_RA | 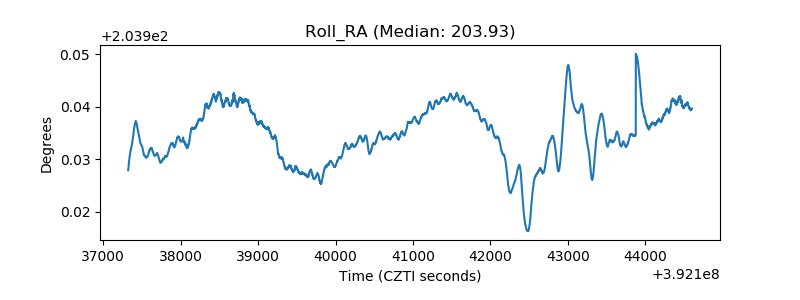 |
| Veto Counter | 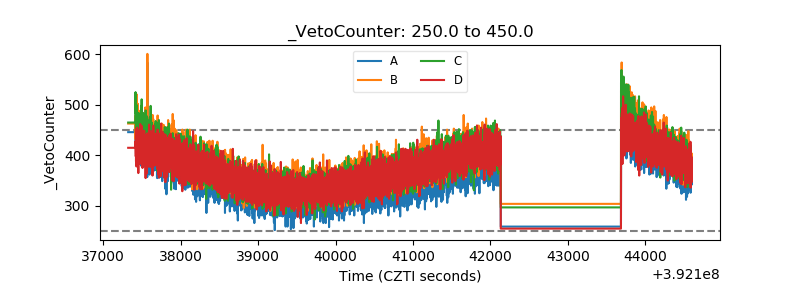 |