| Param | Original file | Final file |
|---|---|---|
| Filename | modeM0/AS1T04_069T01_9000005158_36146cztM0_level2.evt | modeM0/AS1T04_069T01_9000005158_36146cztM0_level2_quad_clean.evt |
| Size (bytes) | 375,681,600 | 47,295,360 |
| Size | 358.3 MB | 45.1 MB |
| Events in quadrant A | 2,455,069 | 279,768 |
| Events in quadrant B | 2,776,553 | 285,231 |
| Events in quadrant C | 2,743,465 | 274,210 |
| Events in quadrant D | 3,076,363 | 255,761 |
Noise dominated data is calculated using 1-second bins in cleaned event files. If a bin has >2000 counts, and if more than 50% of those come from <1% of pixels, then it is considered to be noise-dominated and hence unusable.
| Quadrant | # 1 sec bins | Bins with >0 counts | Bins with >2000 counts | High rate bins dominated by noise | Noise dominated (total time) | Noise dominated (detector-on time) | Marked lightcurve |
|---|---|---|---|---|---|---|---|
| A | 6949 | 4797 | 4 | 4 | 0.06% | 0.08% | 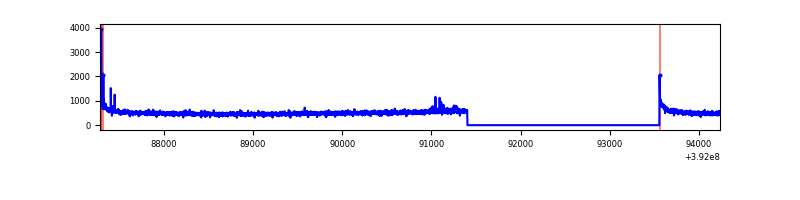 |
| B | 6949 | 4797 | 24 | 24 | 0.35% | 0.50% | 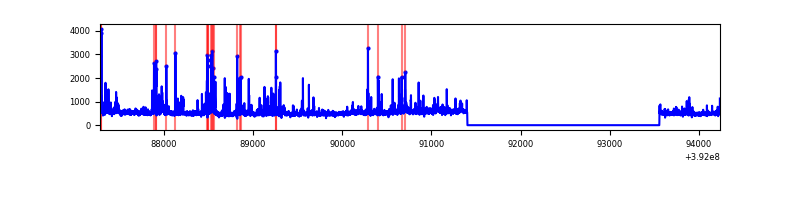 |
| C | 6949 | 4797 | 62 | 62 | 0.89% | 1.29% | 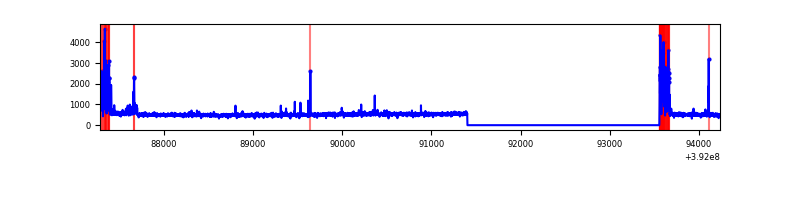 |
| D | 6949 | 4797 | 119 | 119 | 1.71% | 2.48% | 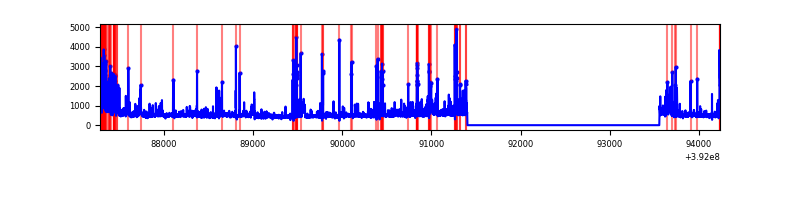 |
Top three noisy pixels from each quadrant. If the there are fewer than three noisy pixels in the level2.evt file, extra rows are filled as -1
| Pixel properties | Quadrant properties | ||||||
|---|---|---|---|---|---|---|---|
| Quadrant | DetID | PixID | Counts | Sigma | Mean | Median | Sigma |
| A | 10 | 83 | 160465 | 1354.59 | 582 | 573 | 118.0 |
| A | 9 | 143 | 25049 | 207.36 | 582 | 573 | 118.0 |
| A | 8 | 144 | 13189 | 106.88 | 582 | 573 | 118.0 |
| B | 5 | 172 | 293582 | 2629.78 | 582 | 568 | 111.4 |
| B | 0 | 190 | 62095 | 552.2 | 582 | 568 | 111.4 |
| B | 0 | 213 | 54920 | 487.81 | 582 | 568 | 111.4 |
| C | 0 | 10 | 253842 | 1923.38 | 566 | 570 | 131.7 |
| C | 15 | 214 | 202651 | 1534.63 | 566 | 570 | 131.7 |
| C | 1 | 23 | 54153 | 406.92 | 566 | 570 | 131.7 |
| D | 1 | 52 | 438607 | 3174.48 | 557 | 542 | 138.0 |
| D | 13 | 249 | 173905 | 1256.29 | 557 | 542 | 138.0 |
| D | 12 | 6 | 73860 | 531.31 | 557 | 542 | 138.0 |
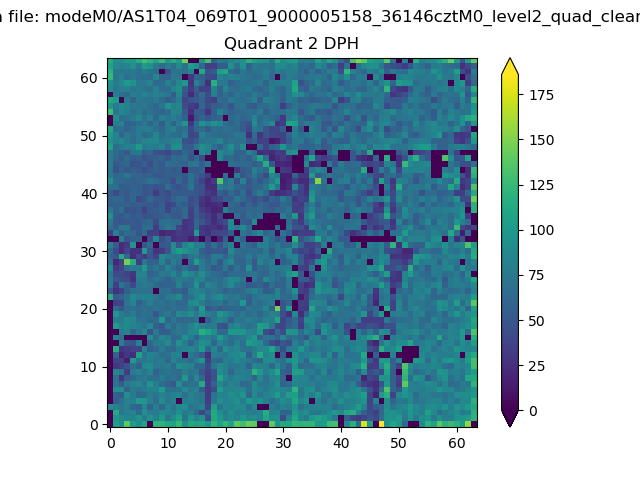
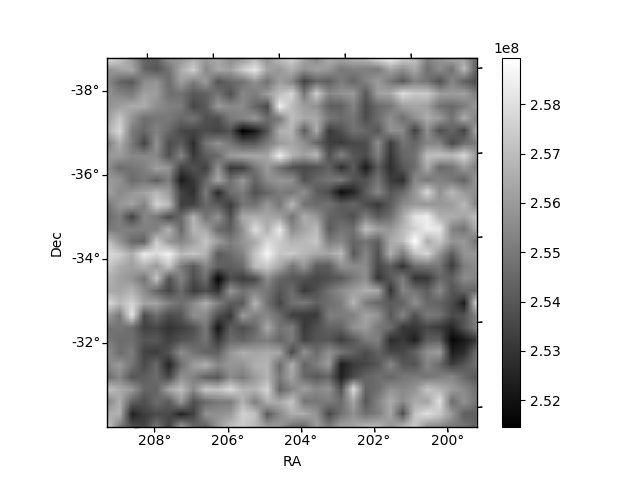
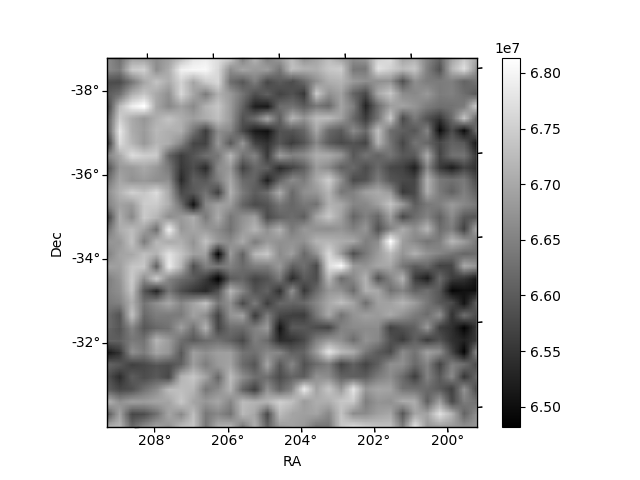
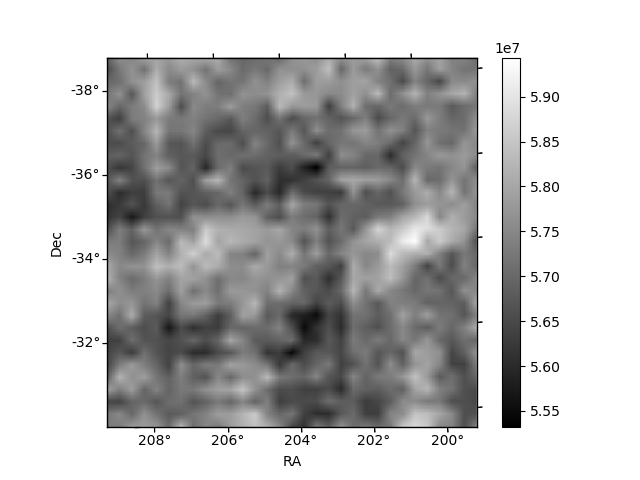
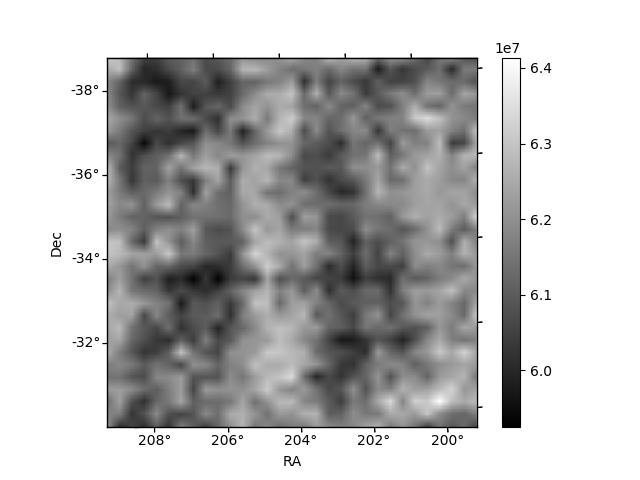
Histogram calculated using DETX and DETY for each event in the final _common_clean file
| Quadrant A | 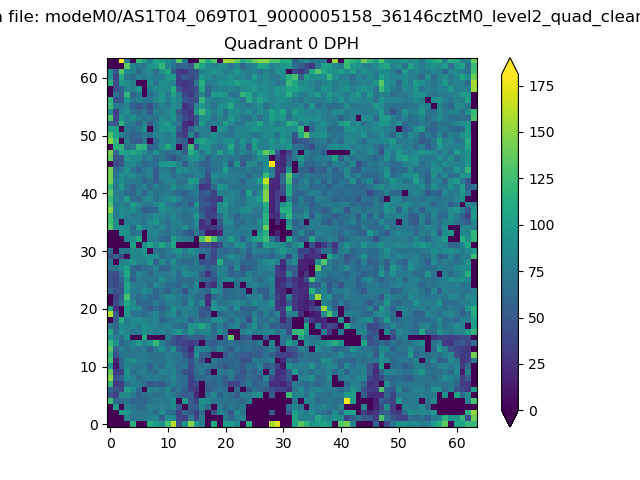 |
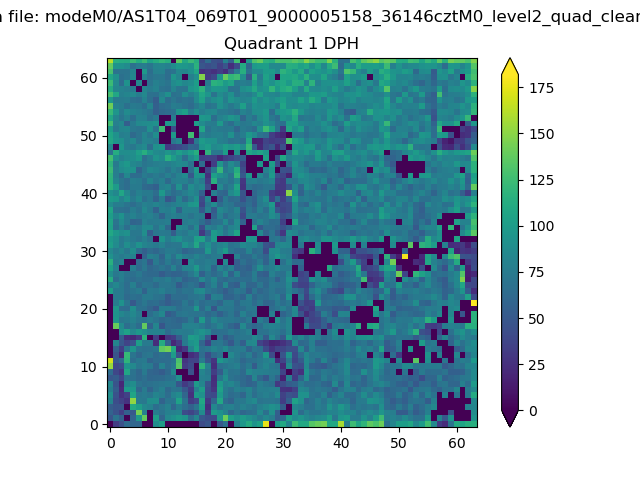 |
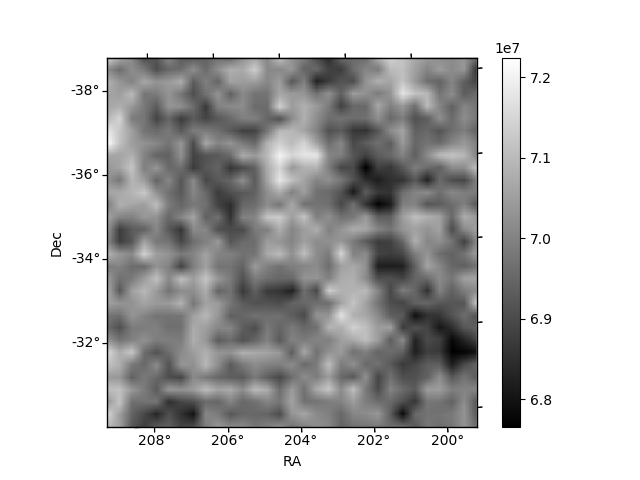
Quadrant B |
|---|---|---|---|
| Quadrant D | 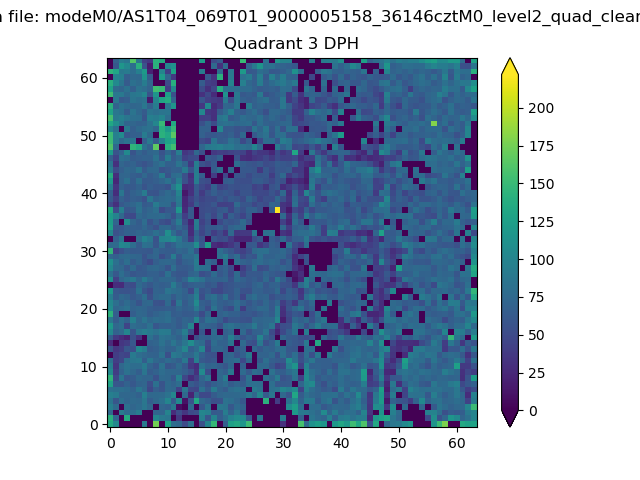 |
 |
Quadrant C |
| Plot type | Count rate plots | Images |
|---|---|---|
| Comparison with Poisson distribution Blue bars denote a histogram of data divided into 1 sec bins. Red curve is a Poisson curve with rate = median count rate of data. |
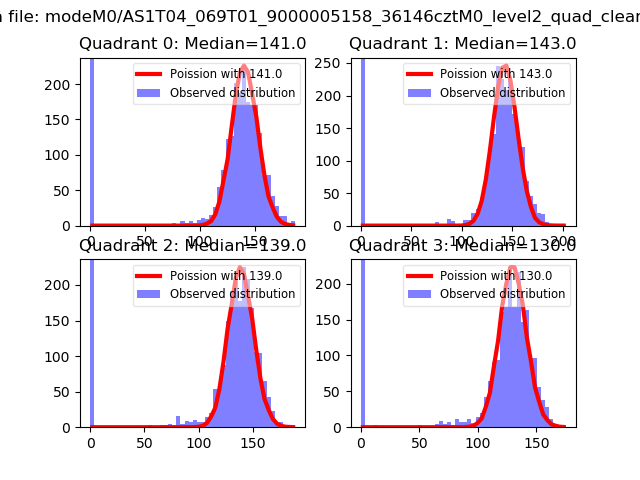 |
 |
| Quadrant-wise count rates Data is divided into 100 sec bins |
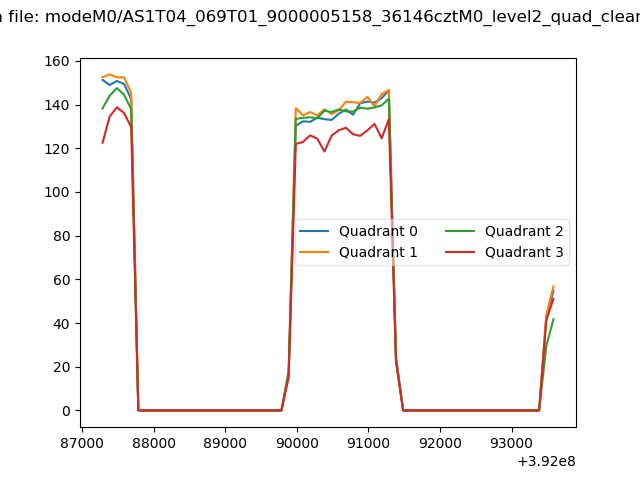 |
|
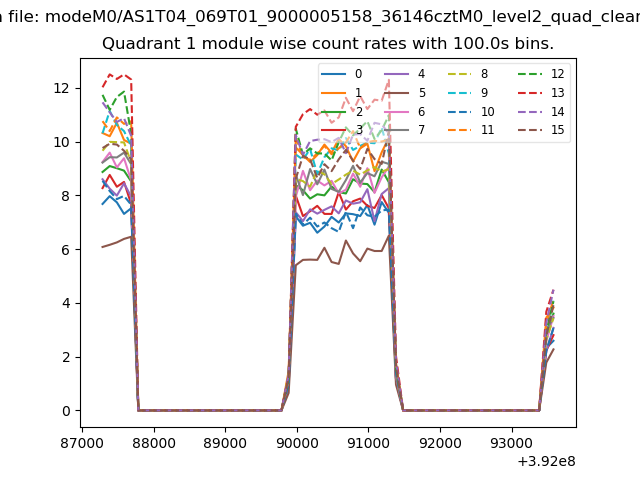
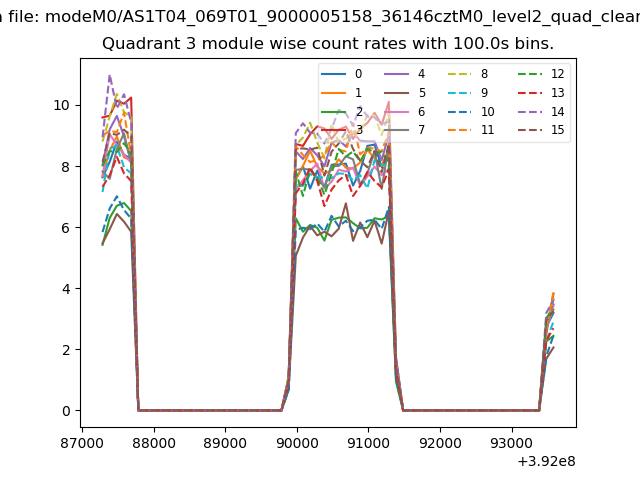
| Module-wise count rates for Quadrant A Data is divided into 100 sec bins |
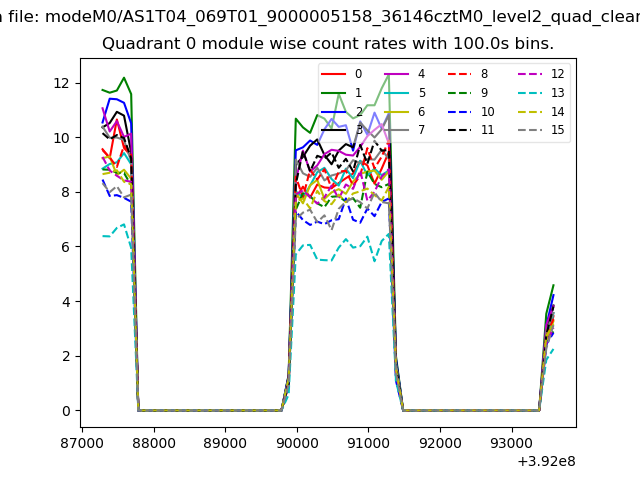 |
 |
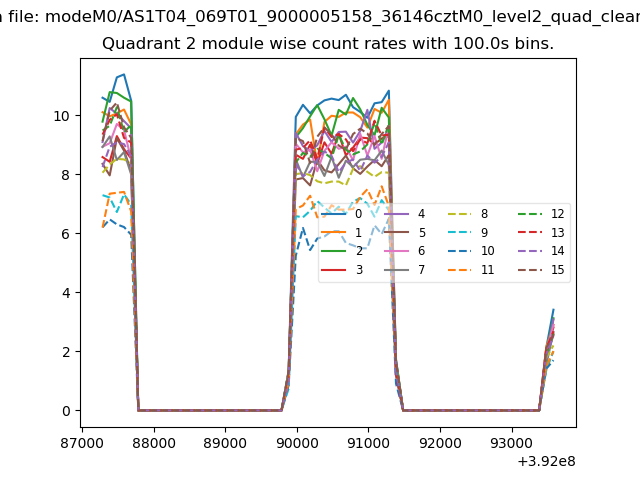
| Module-wise count rates for Quadrant B Data is divided into 100 sec bins |
 |
 |
| Module-wise count rates for Quadrant C Data is divided into 100 sec bins |
 |
 |
| Module-wise count rates for Quadrant D Data is divided into 100 sec bins |
 |
 |
| Parameter | Plot |
|---|---|
| CZT HV Monitor | 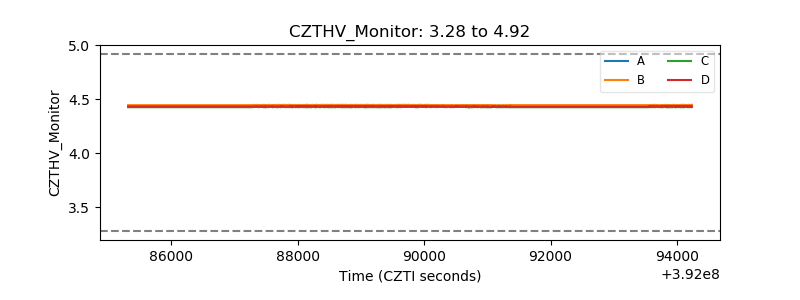 |
| D_VDD | 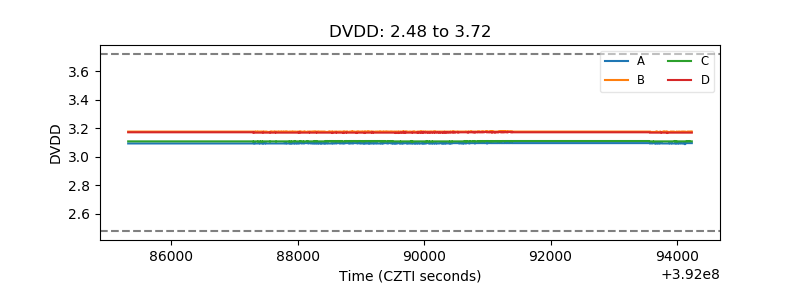 |
| Temperature 1 | 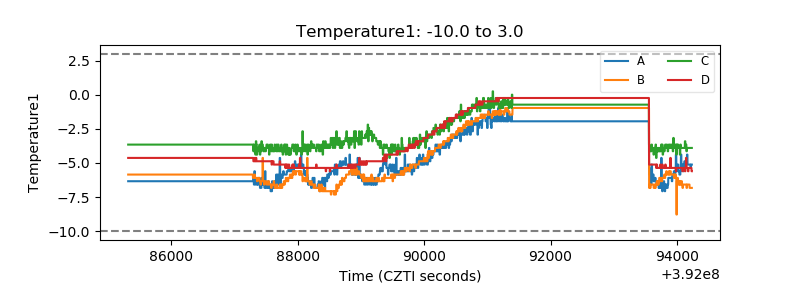 |
| Veto HV Monitor |  |
| Veto LLD | 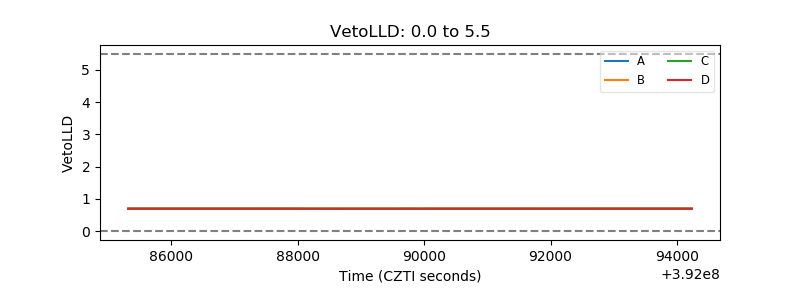 |
| Alpha Counter | 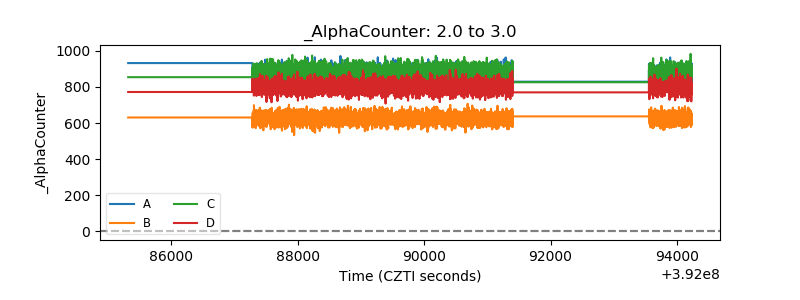 |
| _CPM_Rate | 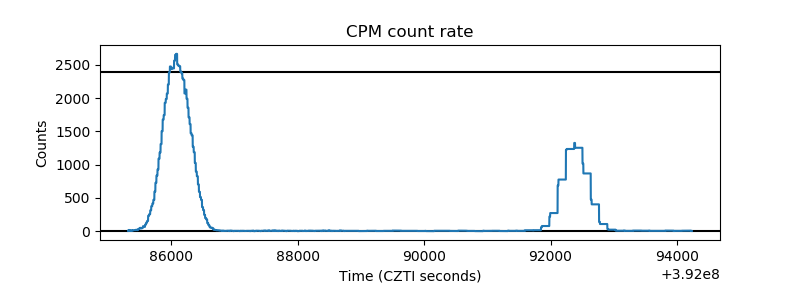 |
| CZT Counter |  |
| +2.5 Volts monitor | 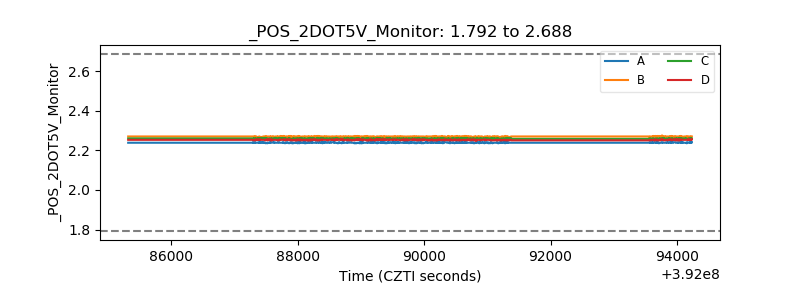 |
| +5 Volts monitor | 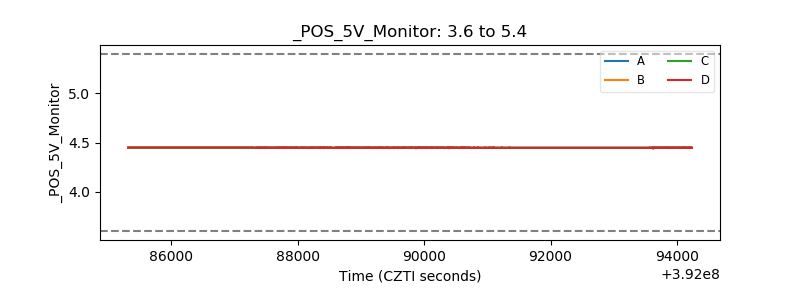 |
| _ROLL_ROT | 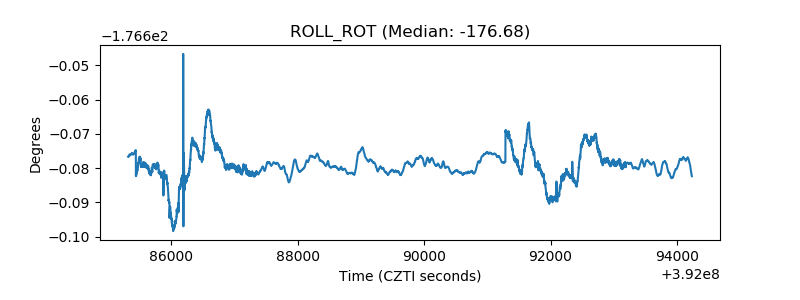 |
| _Roll_DEC | 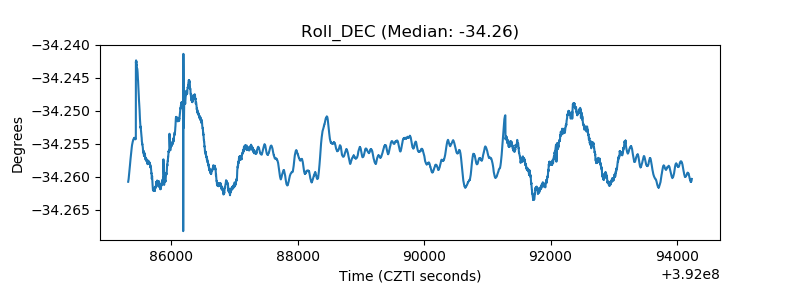 |
| _Roll_RA | 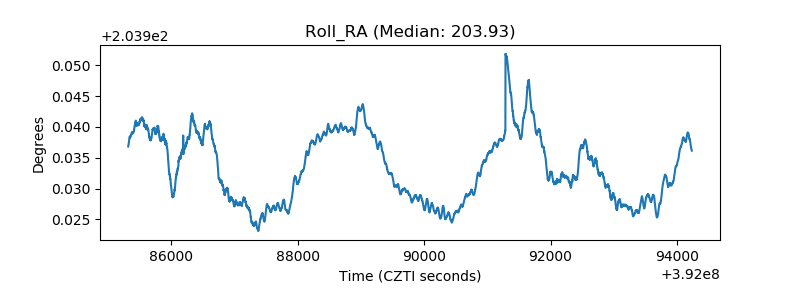 |
| Veto Counter | 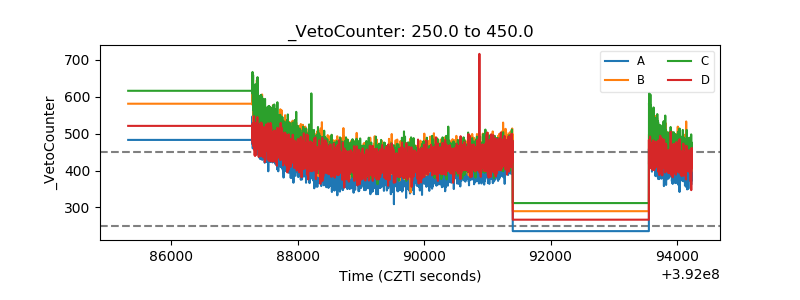 |