| Param | Original file | Final file |
|---|---|---|
| Filename | modeM0/AS1T04_069T01_9000005158_36143cztM0_level2.evt | modeM0/AS1T04_069T01_9000005158_36143cztM0_level2_quad_clean.evt |
| Size (bytes) | 420,773,760 | 64,509,120 |
| Size | 401.3 MB | 61.5 MB |
| Events in quadrant A | 2,566,465 | 412,419 |
| Events in quadrant B | 3,310,249 | 409,911 |
| Events in quadrant C | 2,743,522 | 395,338 |
| Events in quadrant D | 3,771,877 | 373,689 |
| Mode M0 | |||
|---|---|---|---|
| Quadrant | BADHDUFLAG | Total packets | Discarded packets |
| A | 0 | 10848 | 3 |
| B | 0 | 13202 | 2 |
| C | 0 | 11210 | 2 |
| D | 0 | 14663 | 2 |
| Mode M9 | |||
|---|---|---|---|
| Quadrant | BADHDUFLAG | Total packets | Discarded packets |
| A | 0 | 29 | 0 |
| B | 0 | 29 | 0 |
| C | 0 | 29 | 0 |
| D | 0 | 30 | 0 |
| Mode SS | |||
|---|---|---|---|
| Quadrant | BADHDUFLAG | Total packets | Discarded packets |
| A | 0 | 106 | 0 |
| B | 0 | 106 | 0 |
| C | 0 | 106 | 0 |
| D | 0 | 106 | 0 |
| Quadrant | Total seconds | Saturated seconds | Saturation percentage |
|---|---|---|---|
| A | 5163 | 10 | 0.193686% |
| B | 5163 | 195 | 3.776874% |
| C | 5163 | 76 | 1.472012% |
| D | 5163 | 261 | 5.055200% |
Noise dominated data is calculated using 1-second bins in cleaned event files. If a bin has >2000 counts, and if more than 50% of those come from <1% of pixels, then it is considered to be noise-dominated and hence unusable.
| Quadrant | # 1 sec bins | Bins with >0 counts | Bins with >2000 counts | High rate bins dominated by noise | Noise dominated (total time) | Noise dominated (detector-on time) | Marked lightcurve |
|---|---|---|---|---|---|---|---|
| A | 7076 | 5164 | 3 | 3 | 0.04% | 0.06% | 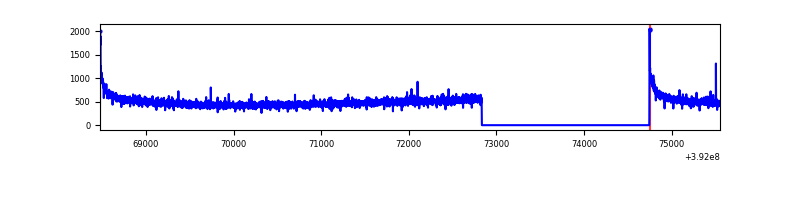 |
| B | 7076 | 5164 | 133 | 133 | 1.88% | 2.58% | 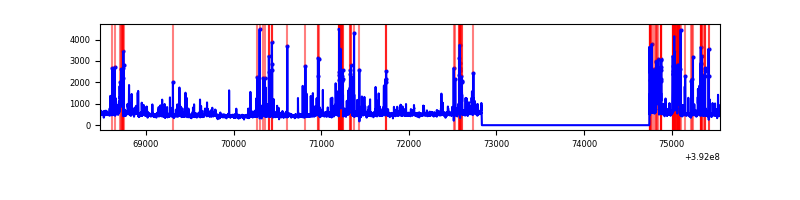 |
| C | 7076 | 5164 | 55 | 55 | 0.78% | 1.07% | 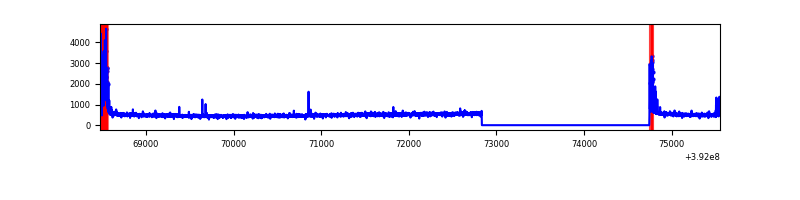 |
| D | 7076 | 5164 | 239 | 239 | 3.38% | 4.63% | 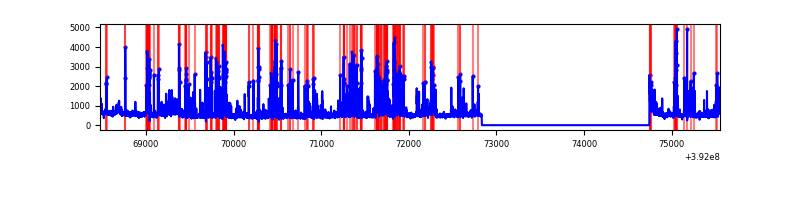 |
Top three noisy pixels from each quadrant. If the there are fewer than three noisy pixels in the level2.evt file, extra rows are filled as -1
| Pixel properties | Quadrant properties | ||||||
|---|---|---|---|---|---|---|---|
| Quadrant | DetID | PixID | Counts | Sigma | Mean | Median | Sigma |
| A | 10 | 83 | 174989 | 1405.5 | 612 | 602 | 124.1 |
| A | 13 | 254 | 9349 | 70.5 | 612 | 602 | 124.1 |
| A | 8 | 144 | 9344 | 70.46 | 612 | 602 | 124.1 |
| B | 5 | 172 | 655984 | 5697.81 | 603 | 588 | 115.0 |
| B | 4 | 171 | 174440 | 1511.42 | 603 | 588 | 115.0 |
| B | 4 | 232 | 35474 | 303.29 | 603 | 588 | 115.0 |
| C | 0 | 10 | 223296 | 1627.64 | 585 | 590 | 136.8 |
| C | 15 | 214 | 217540 | 1585.57 | 585 | 590 | 136.8 |
| C | 1 | 23 | 14928 | 104.79 | 585 | 590 | 136.8 |
| D | 12 | 17 | 565796 | 4040.78 | 573 | 556 | 139.9 |
| D | 1 | 52 | 306527 | 2187.32 | 573 | 556 | 139.9 |
| D | 2 | 249 | 190417 | 1357.28 | 573 | 556 | 139.9 |
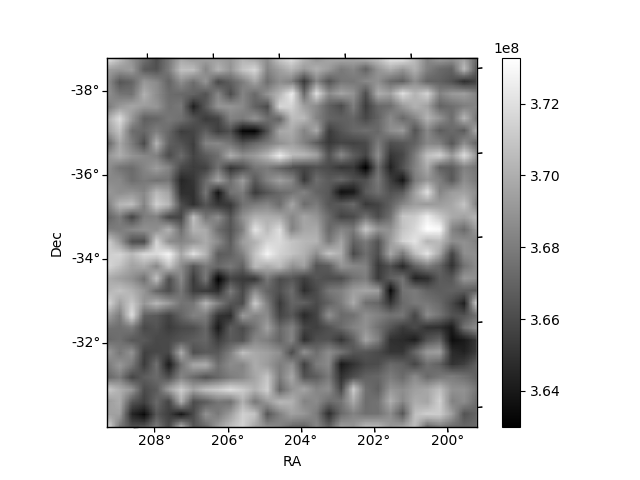
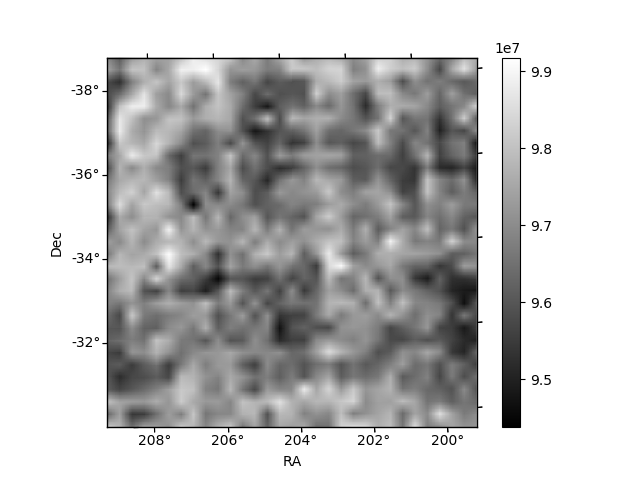
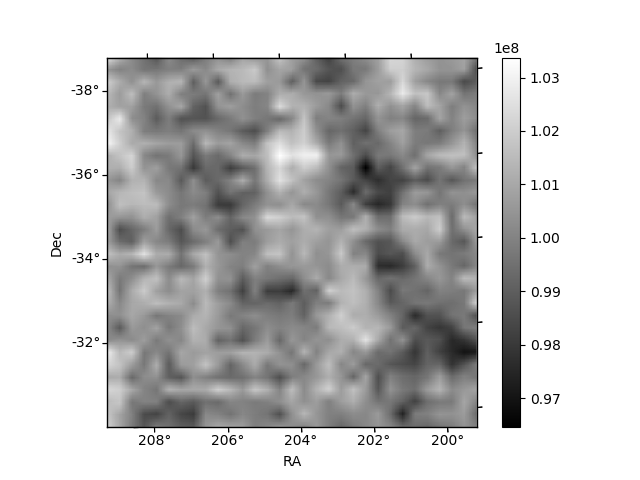
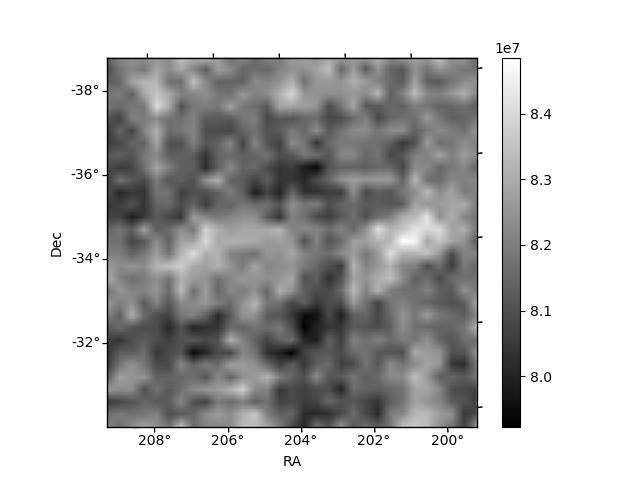
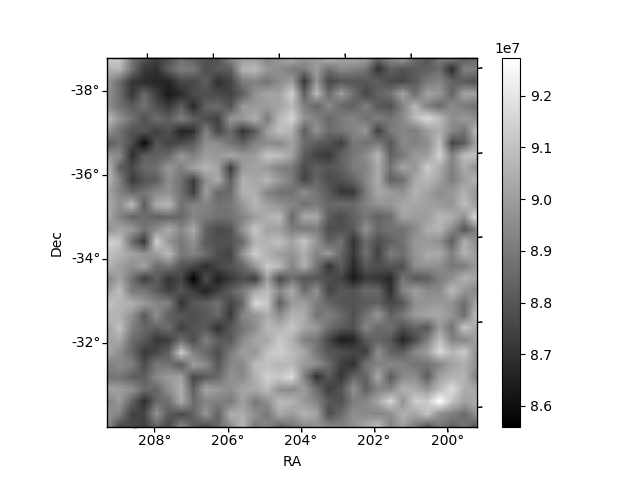
Histogram calculated using DETX and DETY for each event in the final _common_clean file
| Quadrant A | 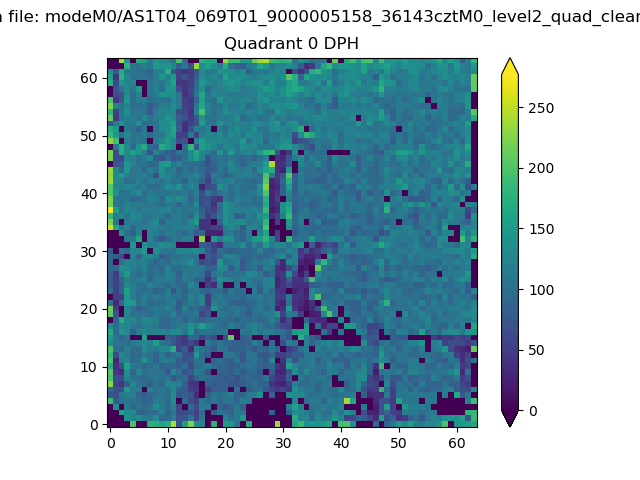 |
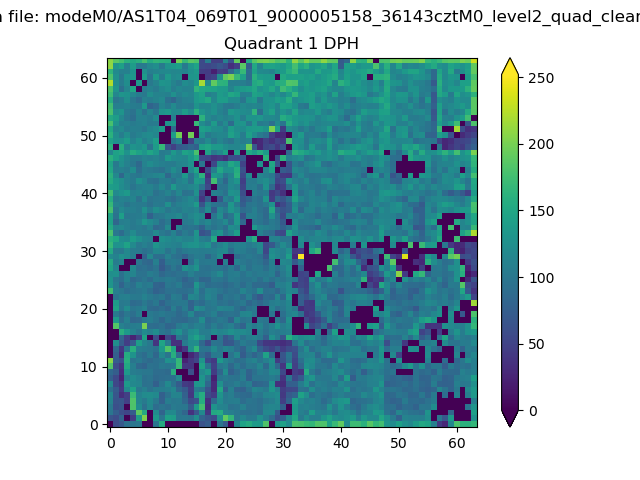 |
Quadrant B |
|---|---|---|---|
| Quadrant D | 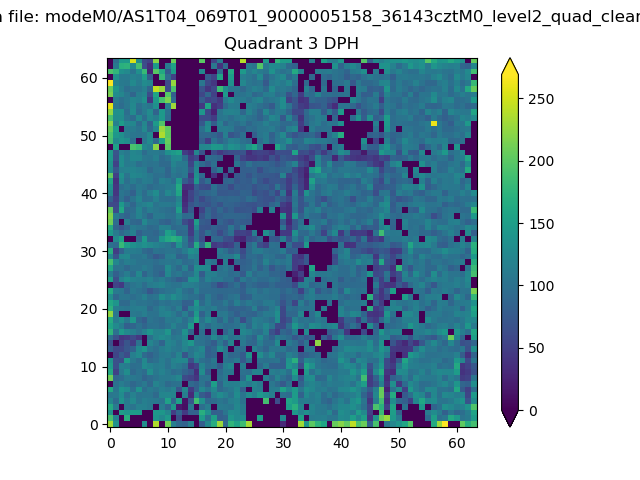 |
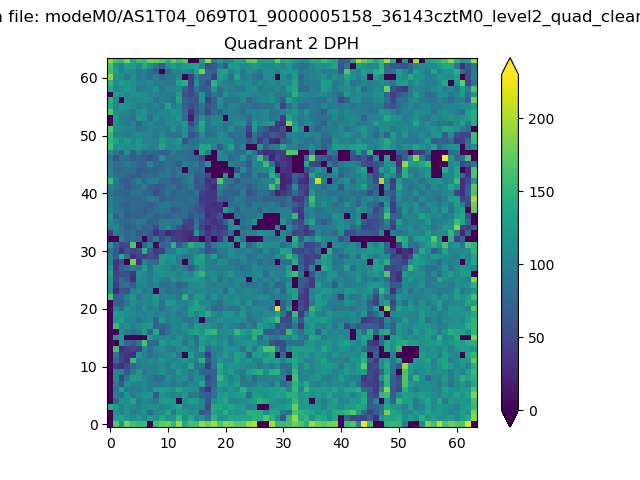 |
Quadrant C |
| Plot type | Count rate plots | Images |
|---|---|---|
| Comparison with Poisson distribution Blue bars denote a histogram of data divided into 1 sec bins. Red curve is a Poisson curve with rate = median count rate of data. |
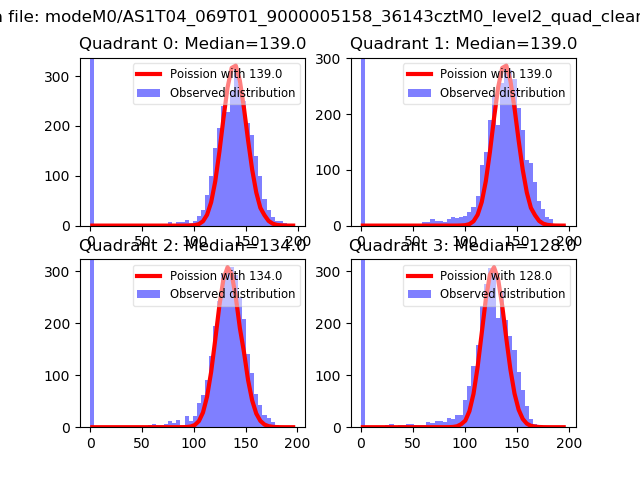 |
 |
| Quadrant-wise count rates Data is divided into 100 sec bins |
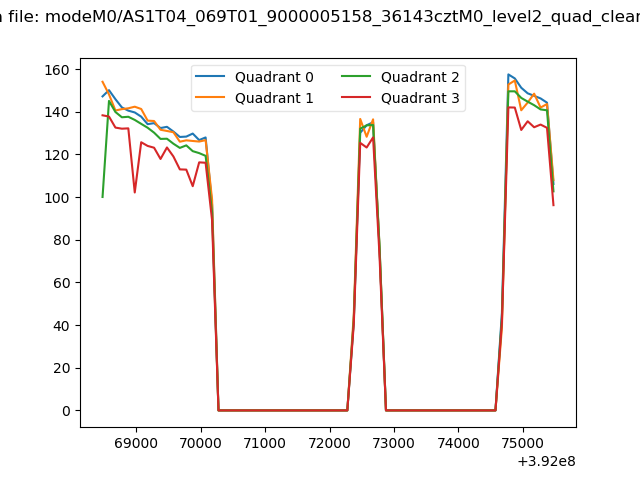 |
|
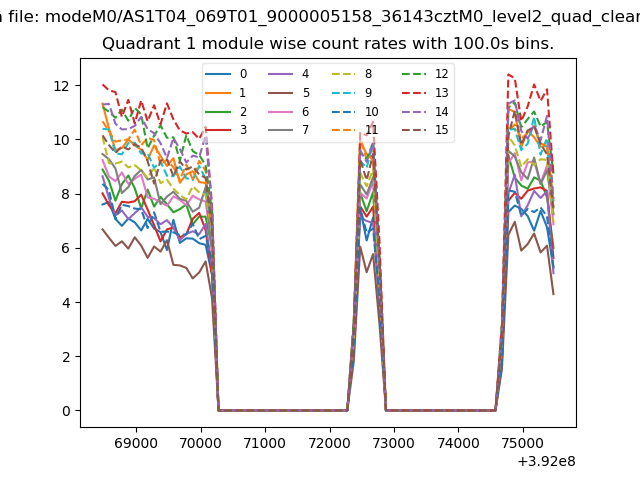
| Module-wise count rates for Quadrant A Data is divided into 100 sec bins |
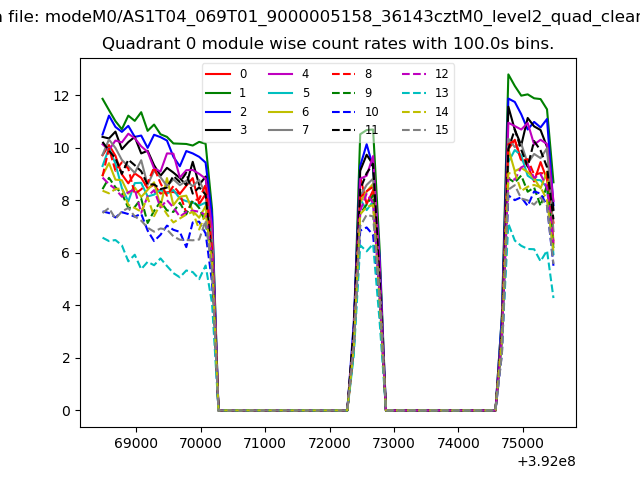 |
 |
| Module-wise count rates for Quadrant B Data is divided into 100 sec bins |
 |
 |
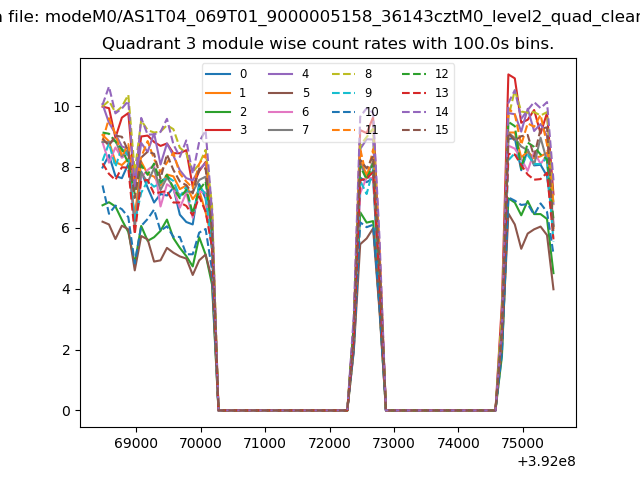
| Module-wise count rates for Quadrant C Data is divided into 100 sec bins |
 |
 |
| Module-wise count rates for Quadrant D Data is divided into 100 sec bins |
 |
 |
| Parameter | Plot |
|---|---|
| CZT HV Monitor |  |
| D_VDD | 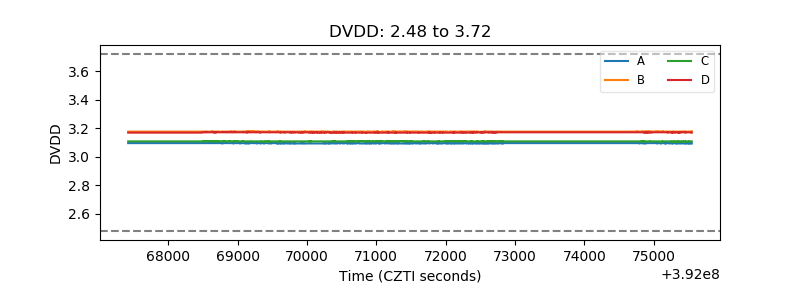 |
| Temperature 1 | 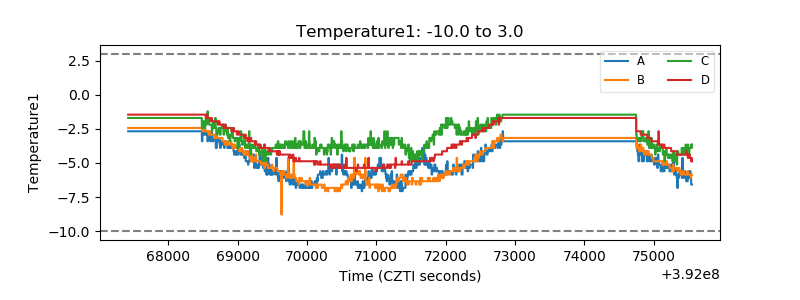 |
| Veto HV Monitor | 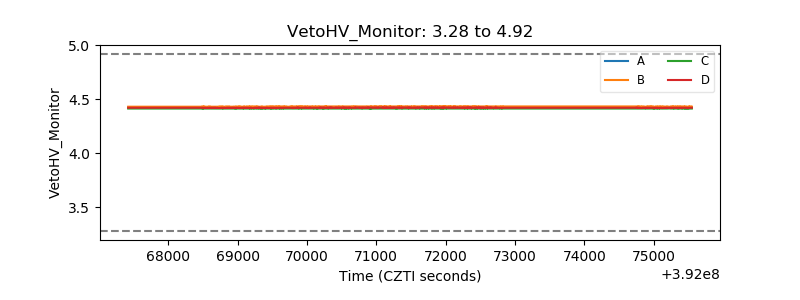 |
| Veto LLD | 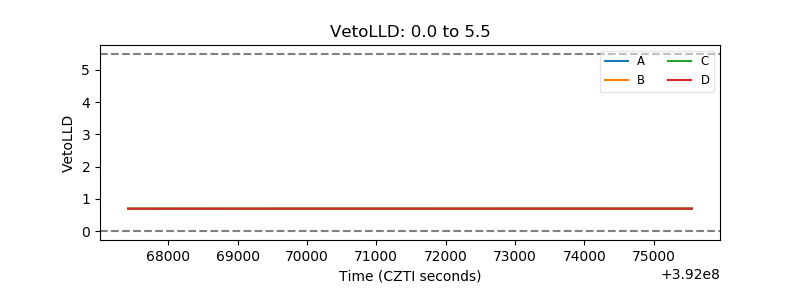 |
| Alpha Counter | 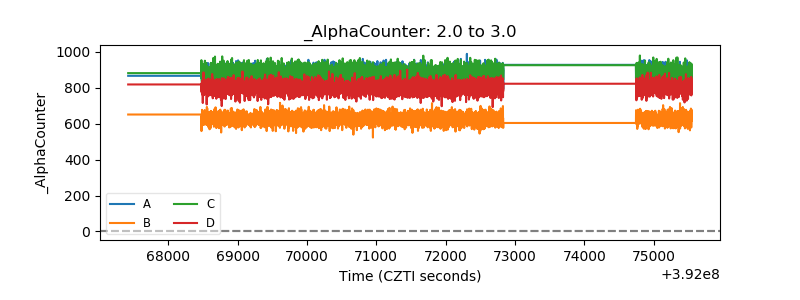 |
| _CPM_Rate | 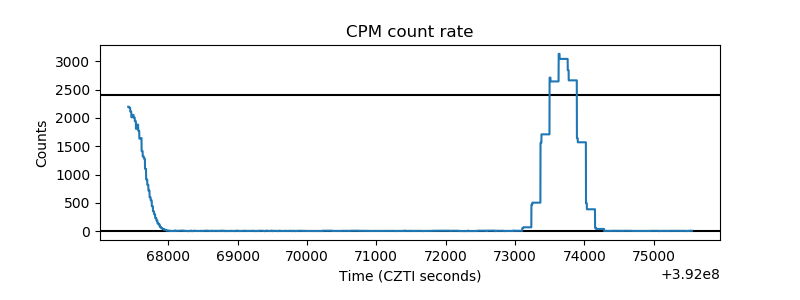 |
| CZT Counter |  |
| +2.5 Volts monitor | 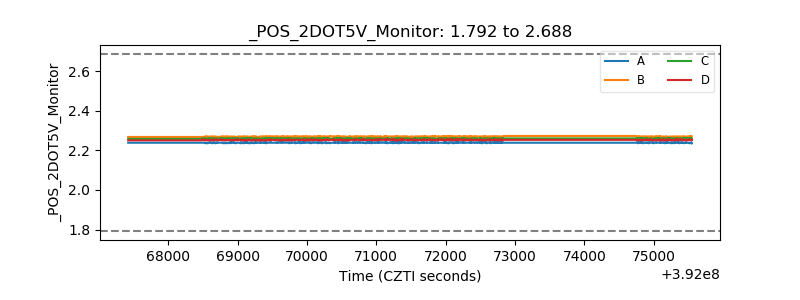 |
| +5 Volts monitor | 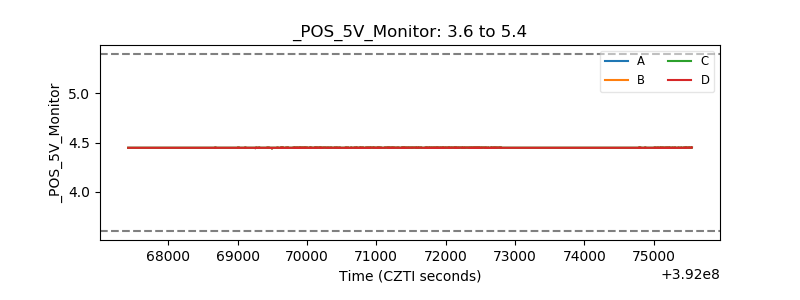 |
| _ROLL_ROT | 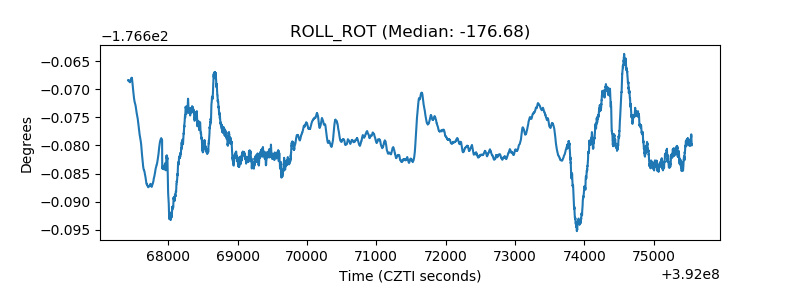 |
| _Roll_DEC | 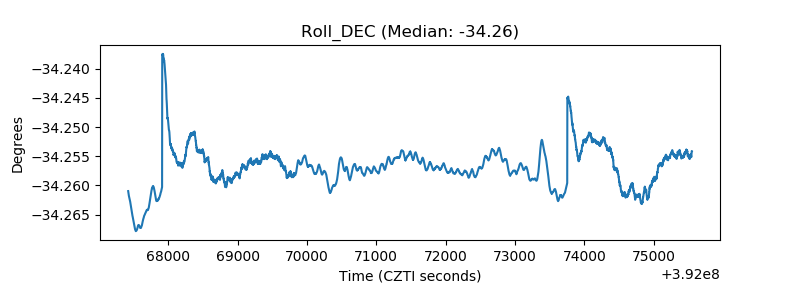 |
| _Roll_RA | 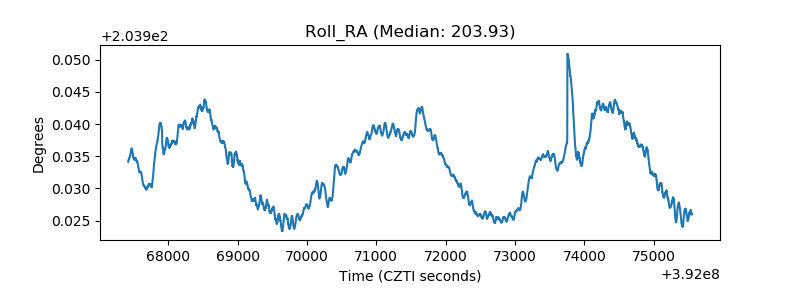 |
| Veto Counter | 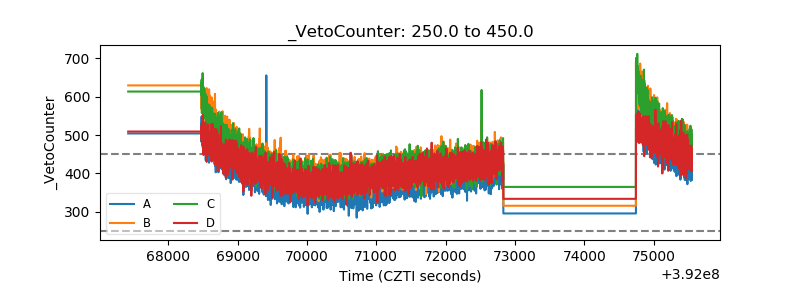 |