| Param | Original file | Final file |
|---|---|---|
| Filename | modeM0/AS1T04_069T01_9000005158_36136cztM0_level2.evt | modeM0/AS1T04_069T01_9000005158_36136cztM0_level2_quad_clean.evt |
| Size (bytes) | 501,353,280 | 82,336,320 |
| Size | 478.1 MB | 78.5 MB |
| Events in quadrant A | 3,447,235 | 530,998 |
| Events in quadrant B | 3,644,374 | 527,151 |
| Events in quadrant C | 4,310,596 | 516,398 |
| Events in quadrant D | 3,377,169 | 502,246 |
| Mode M0 | |||
|---|---|---|---|
| Quadrant | BADHDUFLAG | Total packets | Discarded packets |
| A | 0 | 14039 | 3 |
| B | 0 | 14667 | 2 |
| C | 0 | 16487 | 2 |
| D | 0 | 14044 | 2 |
| Mode M9 | |||
|---|---|---|---|
| Quadrant | BADHDUFLAG | Total packets | Discarded packets |
| A | 0 | 28 | 0 |
| B | 0 | 28 | 0 |
| C | 0 | 28 | 0 |
| D | 0 | 28 | 0 |
| Mode SS | |||
|---|---|---|---|
| Quadrant | BADHDUFLAG | Total packets | Discarded packets |
| A | 0 | 122 | 0 |
| B | 0 | 122 | 0 |
| C | 0 | 122 | 0 |
| D | 0 | 122 | 0 |
| Quadrant | Total seconds | Saturated seconds | Saturation percentage |
|---|---|---|---|
| A | 5965 | 42 | 0.704107% |
| B | 5965 | 210 | 3.520536% |
| C | 5965 | 188 | 3.151718% |
| D | 5965 | 119 | 1.994971% |
Noise dominated data is calculated using 1-second bins in cleaned event files. If a bin has >2000 counts, and if more than 50% of those come from <1% of pixels, then it is considered to be noise-dominated and hence unusable.
| Quadrant | # 1 sec bins | Bins with >0 counts | Bins with >2000 counts | High rate bins dominated by noise | Noise dominated (total time) | Noise dominated (detector-on time) | Marked lightcurve |
|---|---|---|---|---|---|---|---|
| A | 8681 | 5967 | 22 | 22 | 0.25% | 0.37% | 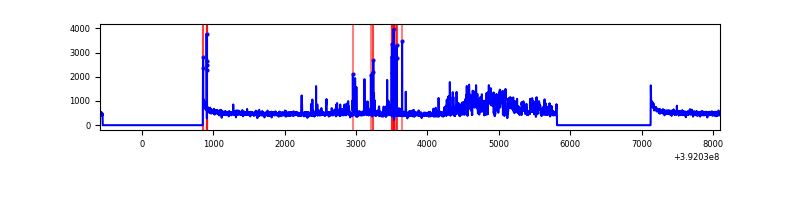 |
| B | 8681 | 5967 | 152 | 152 | 1.75% | 2.55% | 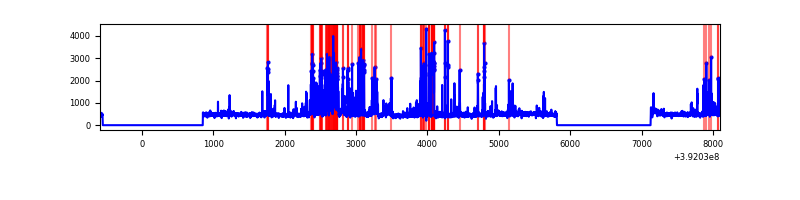 |
| C | 8681 | 5967 | 149 | 149 | 1.72% | 2.50% | 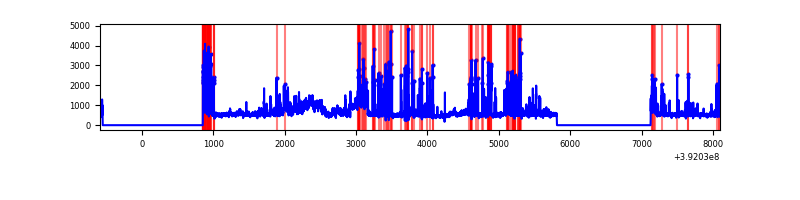 |
| D | 8681 | 5967 | 106 | 106 | 1.22% | 1.78% | 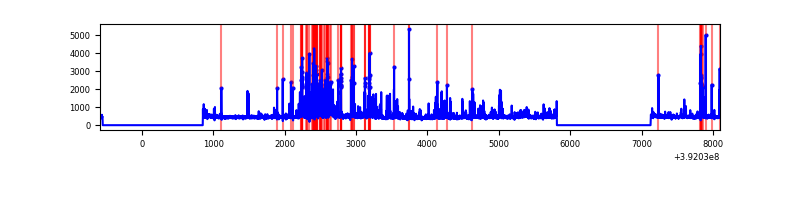 |
Top three noisy pixels from each quadrant. If the there are fewer than three noisy pixels in the level2.evt file, extra rows are filled as -1
| Pixel properties | Quadrant properties | ||||||
|---|---|---|---|---|---|---|---|
| Quadrant | DetID | PixID | Counts | Sigma | Mean | Median | Sigma |
| A | 15 | 223 | 468141 | 3346.93 | 685 | 674 | 139.7 |
| A | 10 | 83 | 187353 | 1336.57 | 685 | 674 | 139.7 |
| A | 9 | 143 | 118168 | 841.22 | 685 | 674 | 139.7 |
| B | 5 | 172 | 854278 | 6599.27 | 671 | 653 | 129.4 |
| B | 4 | 171 | 45223 | 344.57 | 671 | 653 | 129.4 |
| B | 0 | 213 | 32959 | 249.75 | 671 | 653 | 129.4 |
| C | 0 | 207 | 749355 | 4847.26 | 656 | 661 | 154.5 |
| C | 9 | 54 | 541829 | 3503.68 | 656 | 661 | 154.5 |
| C | 15 | 214 | 252641 | 1631.39 | 656 | 661 | 154.5 |
| D | 12 | 17 | 336547 | 2034.75 | 663 | 643 | 165.1 |
| D | 2 | 249 | 108026 | 650.48 | 663 | 643 | 165.1 |
| D | 12 | 6 | 106234 | 639.62 | 663 | 643 | 165.1 |
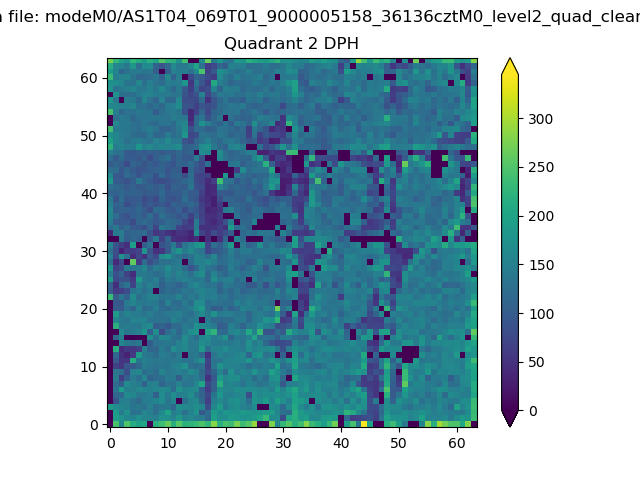
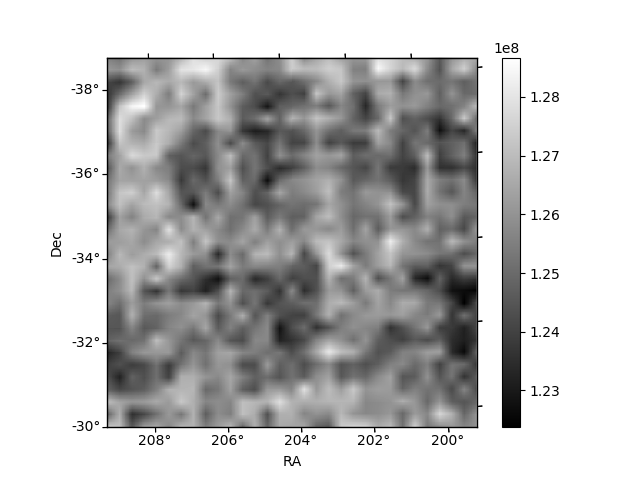
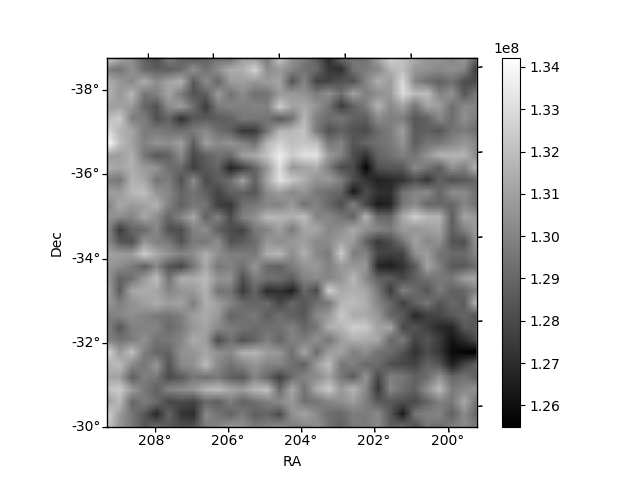
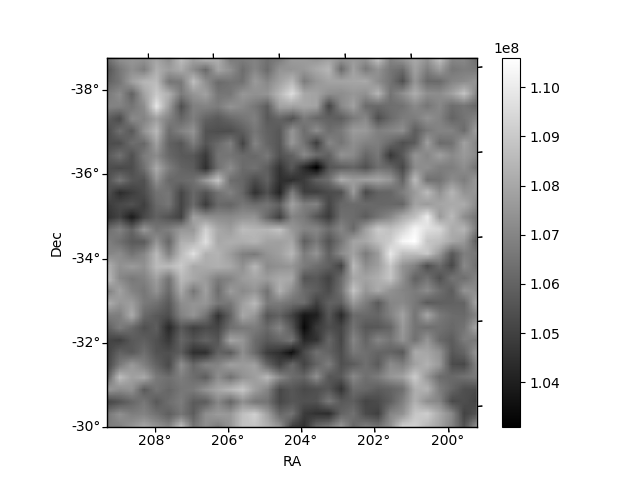
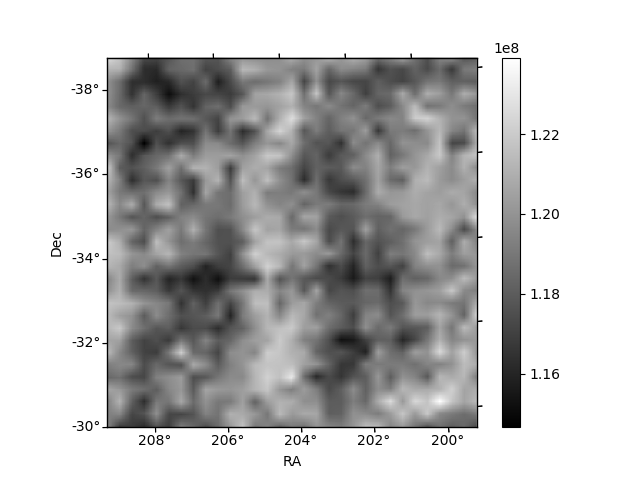
Histogram calculated using DETX and DETY for each event in the final _common_clean file
| Quadrant A | 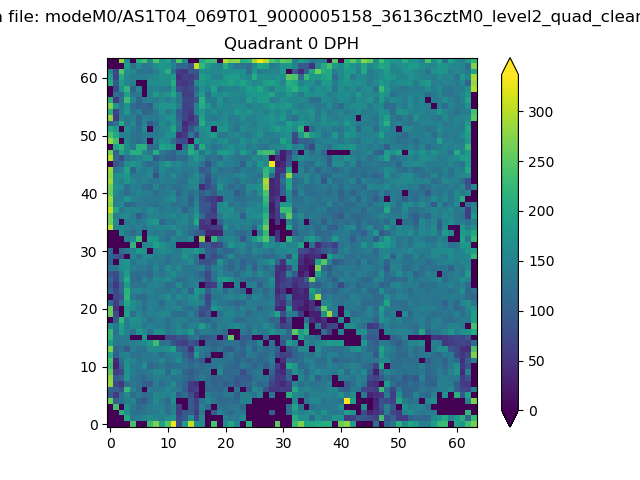 |
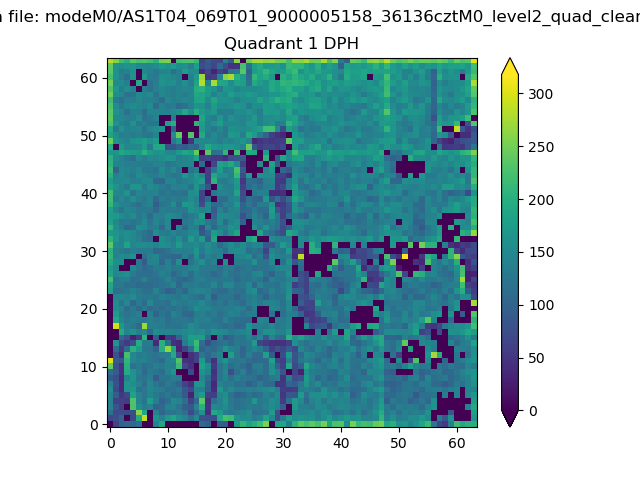 |
Quadrant B |
|---|---|---|---|
| Quadrant D | 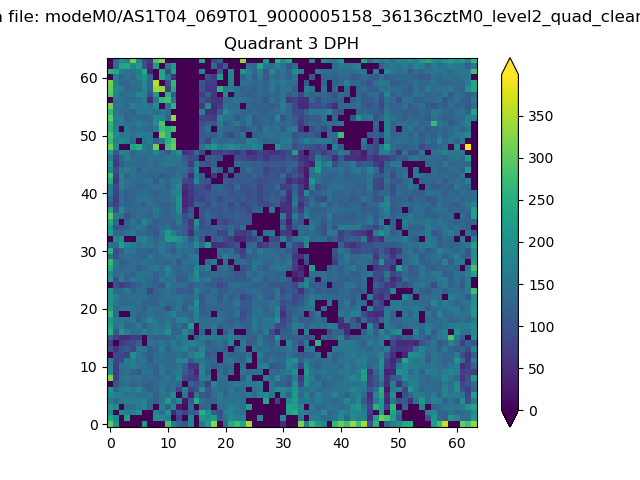 |
 |
Quadrant C |
| Plot type | Count rate plots | Images |
|---|---|---|
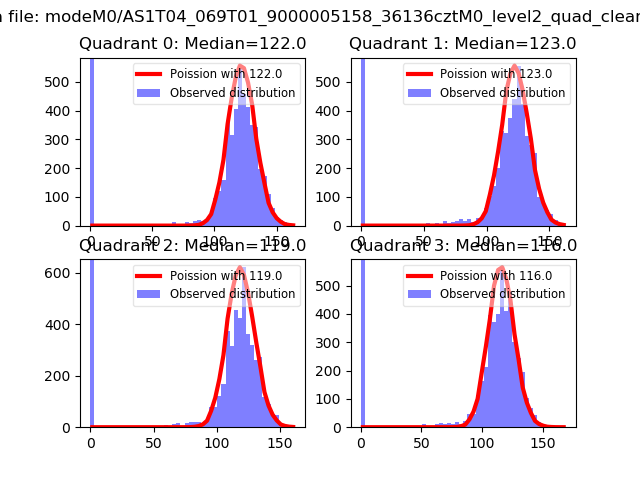
| Comparison with Poisson distribution Blue bars denote a histogram of data divided into 1 sec bins. Red curve is a Poisson curve with rate = median count rate of data. |
 |
 |
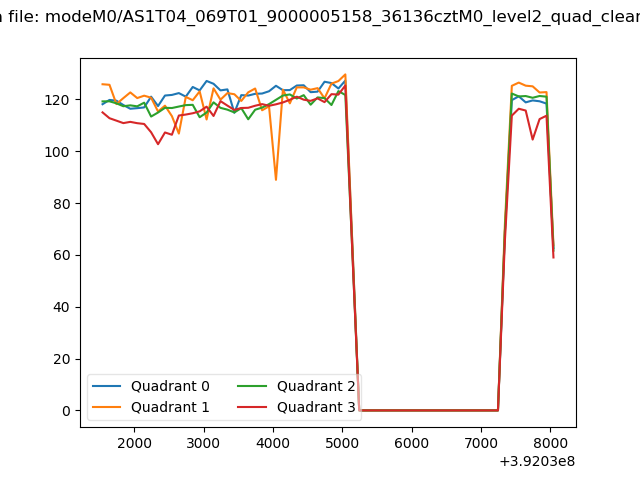
| Quadrant-wise count rates Data is divided into 100 sec bins |
 |
|
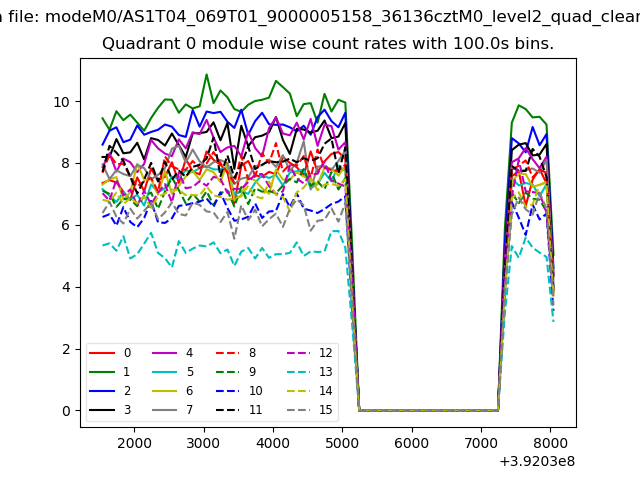
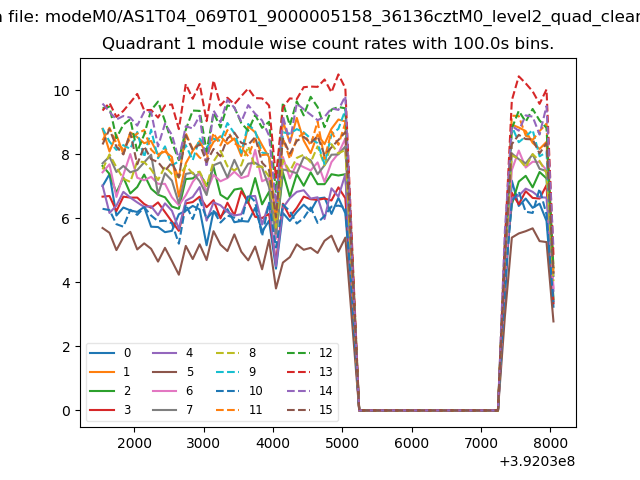
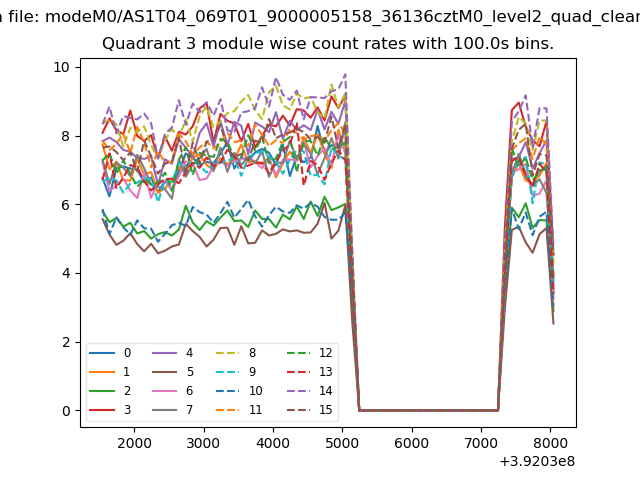
| Module-wise count rates for Quadrant A Data is divided into 100 sec bins |
 |
 |
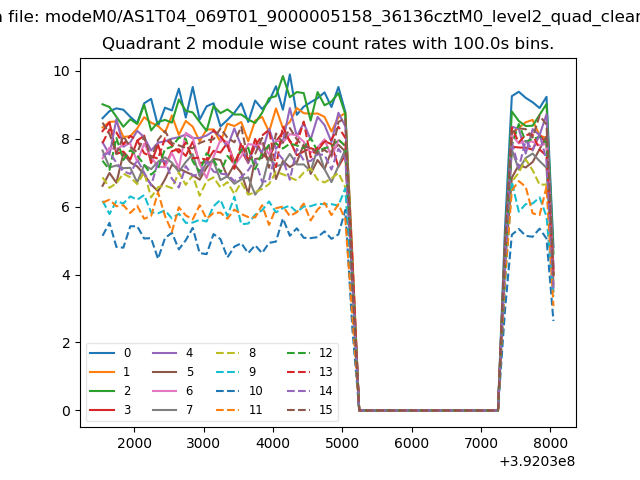
| Module-wise count rates for Quadrant B Data is divided into 100 sec bins |
 |
 |
| Module-wise count rates for Quadrant C Data is divided into 100 sec bins |
 |
 |
| Module-wise count rates for Quadrant D Data is divided into 100 sec bins |
 |
 |
| Parameter | Plot |
|---|---|
| CZT HV Monitor | 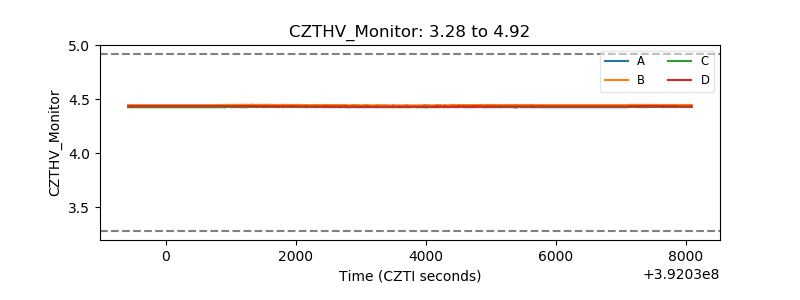 |
| D_VDD | 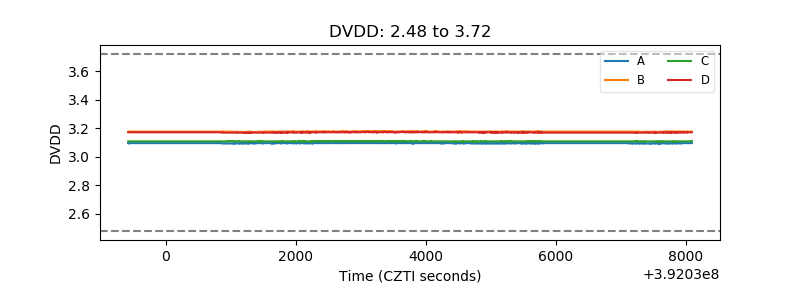 |
| Temperature 1 | 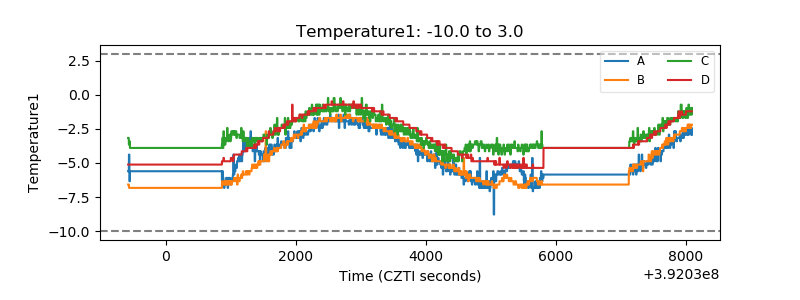 |
| Veto HV Monitor | 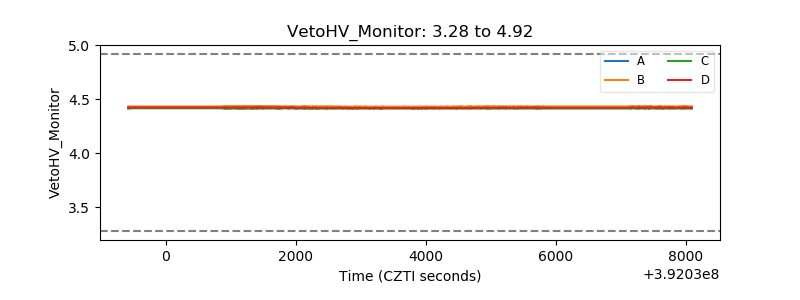 |
| Veto LLD | 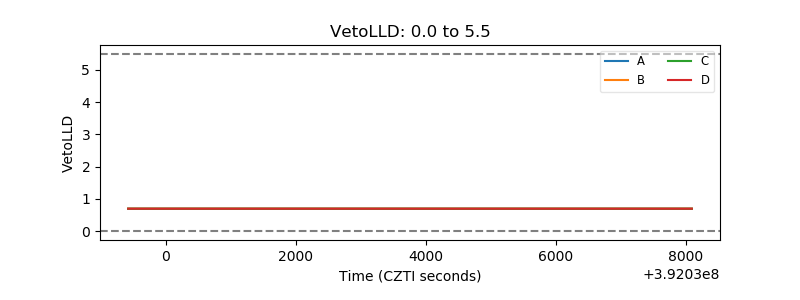 |
| Alpha Counter | 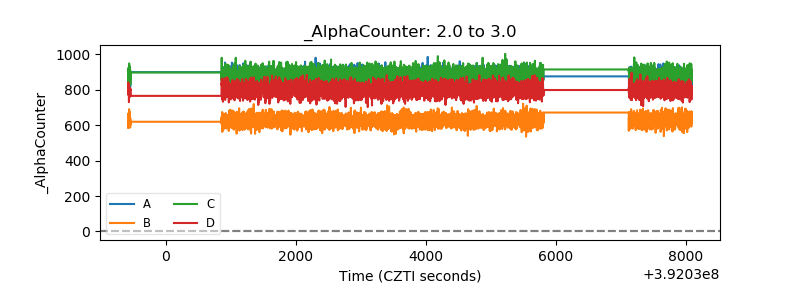 |
| _CPM_Rate | 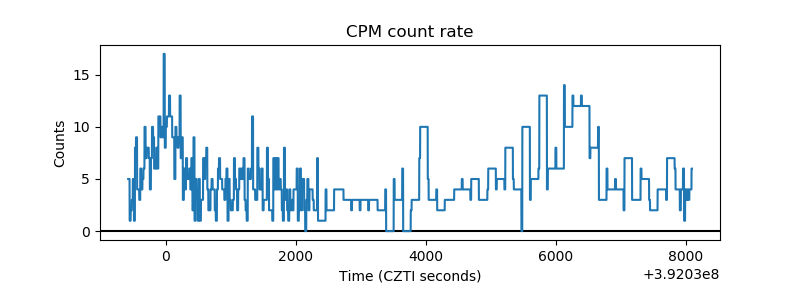 |
| CZT Counter | 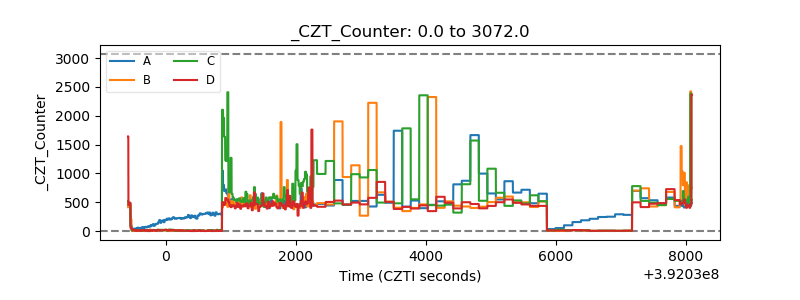 |
| +2.5 Volts monitor | 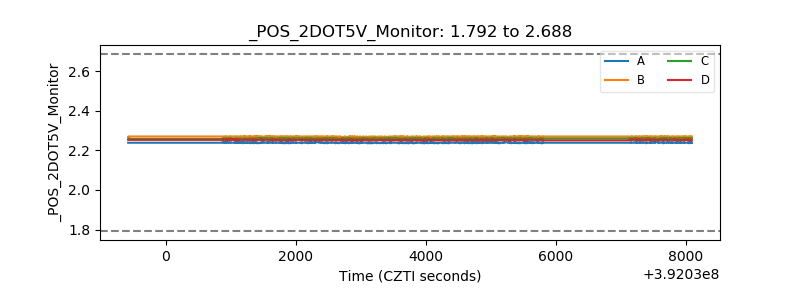 |
| +5 Volts monitor | 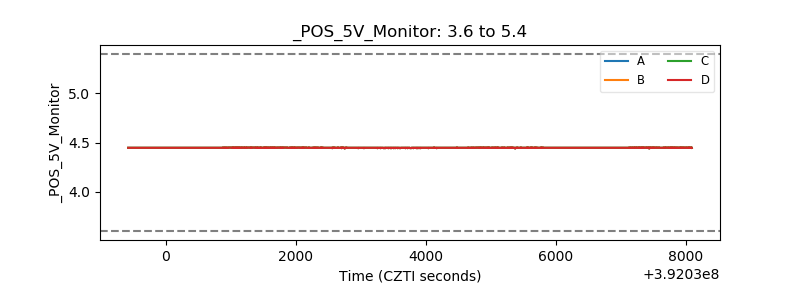 |
| _ROLL_ROT | 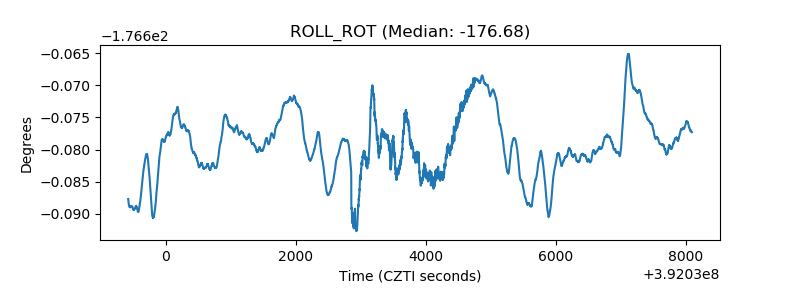 |
| _Roll_DEC | 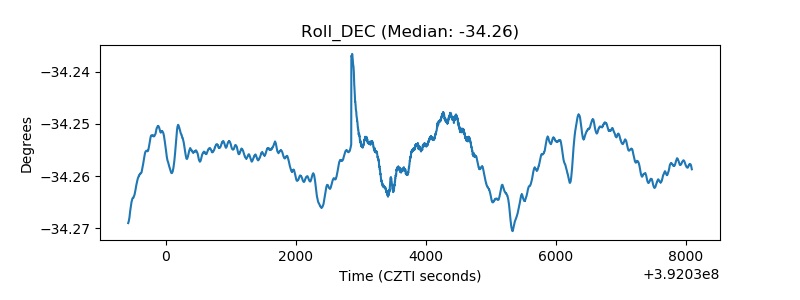 |
| _Roll_RA | 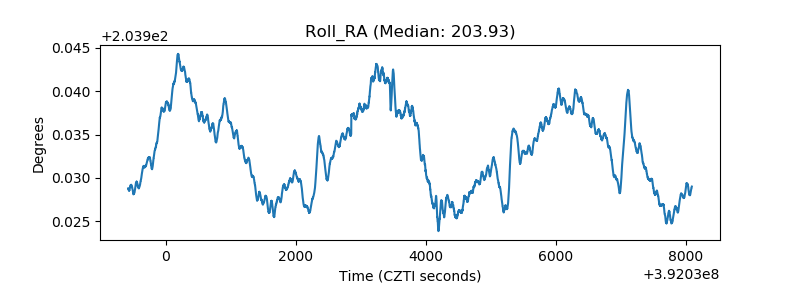 |
| Veto Counter | 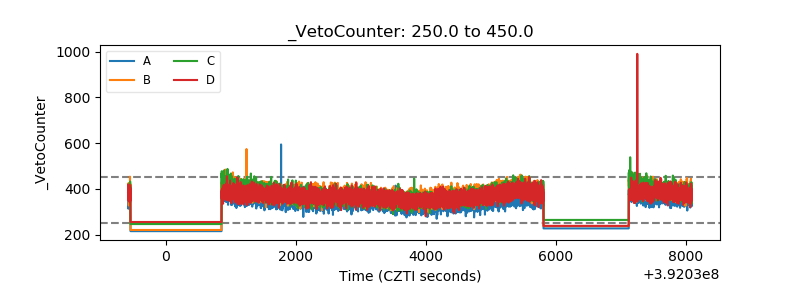 |