| Param | Original file | Final file |
|---|---|---|
| Filename | modeM0/AS1T04_069T01_9000005158_36135cztM0_level2.evt | modeM0/AS1T04_069T01_9000005158_36135cztM0_level2_quad_clean.evt |
| Size (bytes) | 515,220,480 | 79,790,400 |
| Size | 491.4 MB | 76.1 MB |
| Events in quadrant A | 2,961,976 | 521,354 |
| Events in quadrant B | 4,228,558 | 493,835 |
| Events in quadrant C | 3,208,523 | 508,477 |
| Events in quadrant D | 4,793,809 | 469,458 |
| Mode M0 | |||
|---|---|---|---|
| Quadrant | BADHDUFLAG | Total packets | Discarded packets |
| A | 0 | 12589 | 3 |
| B | 0 | 16560 | 2 |
| C | 0 | 13149 | 2 |
| D | 0 | 18291 | 2 |
| Mode M9 | |||
|---|---|---|---|
| Quadrant | BADHDUFLAG | Total packets | Discarded packets |
| A | 0 | 31 | 0 |
| B | 0 | 31 | 0 |
| C | 0 | 31 | 0 |
| D | 0 | 31 | 0 |
| Mode SS | |||
|---|---|---|---|
| Quadrant | BADHDUFLAG | Total packets | Discarded packets |
| A | 0 | 124 | 0 |
| B | 0 | 124 | 0 |
| C | 0 | 124 | 0 |
| D | 0 | 124 | 0 |
| Quadrant | Total seconds | Saturated seconds | Saturation percentage |
|---|---|---|---|
| A | 6056 | 20 | 0.330251% |
| B | 6056 | 458 | 7.562748% |
| C | 6056 | 74 | 1.221929% |
| D | 6056 | 433 | 7.149934% |
Noise dominated data is calculated using 1-second bins in cleaned event files. If a bin has >2000 counts, and if more than 50% of those come from <1% of pixels, then it is considered to be noise-dominated and hence unusable.
| Quadrant | # 1 sec bins | Bins with >0 counts | Bins with >2000 counts | High rate bins dominated by noise | Noise dominated (total time) | Noise dominated (detector-on time) | Marked lightcurve |
|---|---|---|---|---|---|---|---|
| A | 9161 | 6058 | 10 | 10 | 0.11% | 0.17% | 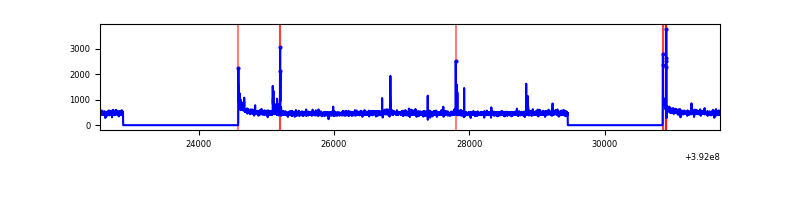 |
| B | 9161 | 6058 | 343 | 343 | 3.74% | 5.66% | 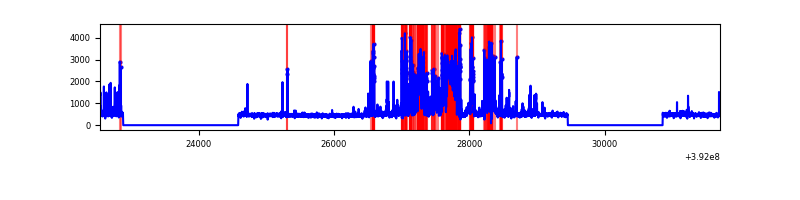 |
| C | 9161 | 6058 | 52 | 52 | 0.57% | 0.86% | 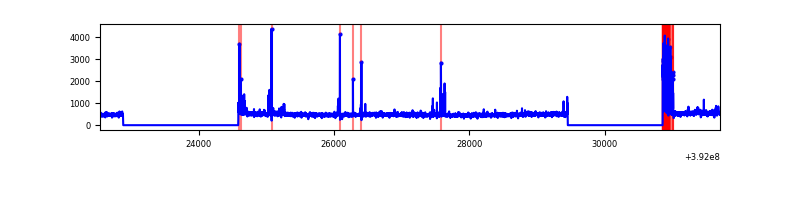 |
| D | 9161 | 6058 | 352 | 352 | 3.84% | 5.81% | 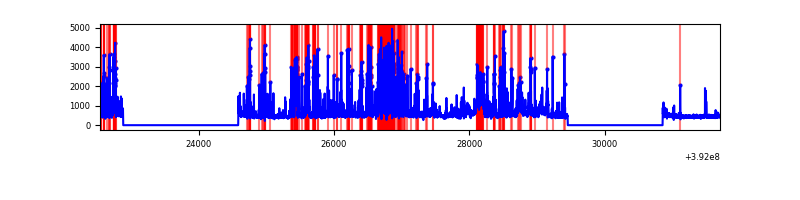 |
Top three noisy pixels from each quadrant. If the there are fewer than three noisy pixels in the level2.evt file, extra rows are filled as -1
| Pixel properties | Quadrant properties | ||||||
|---|---|---|---|---|---|---|---|
| Quadrant | DetID | PixID | Counts | Sigma | Mean | Median | Sigma |
| A | 10 | 83 | 188087 | 1329.74 | 695 | 679 | 140.9 |
| A | 9 | 143 | 67420 | 473.56 | 695 | 679 | 140.9 |
| A | 8 | 144 | 13877 | 93.64 | 695 | 679 | 140.9 |
| B | 5 | 172 | 1486274 | 11403.54 | 669 | 650 | 130.3 |
| B | 0 | 213 | 49487 | 374.87 | 669 | 650 | 130.3 |
| B | 5 | 255 | 43853 | 331.62 | 669 | 650 | 130.3 |
| C | 15 | 214 | 258755 | 1652.88 | 668 | 674 | 156.1 |
| C | 0 | 10 | 192919 | 1231.23 | 668 | 674 | 156.1 |
| C | 0 | 207 | 124322 | 791.9 | 668 | 674 | 156.1 |
| D | 12 | 17 | 1019898 | 6265.54 | 656 | 637 | 162.7 |
| D | 1 | 52 | 601792 | 3695.38 | 656 | 637 | 162.7 |
| D | 12 | 6 | 162855 | 997.18 | 656 | 637 | 162.7 |
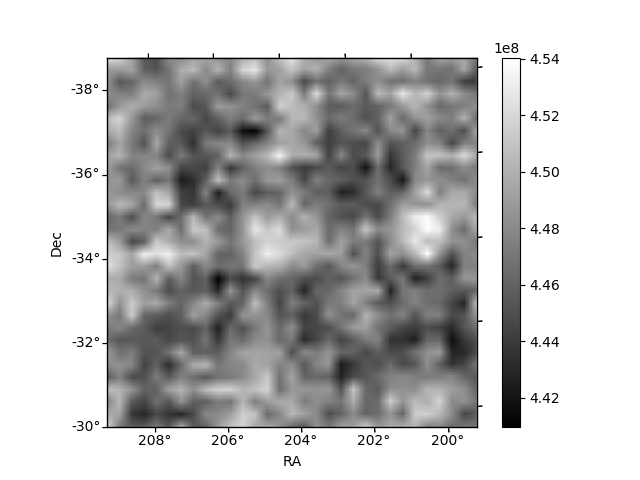
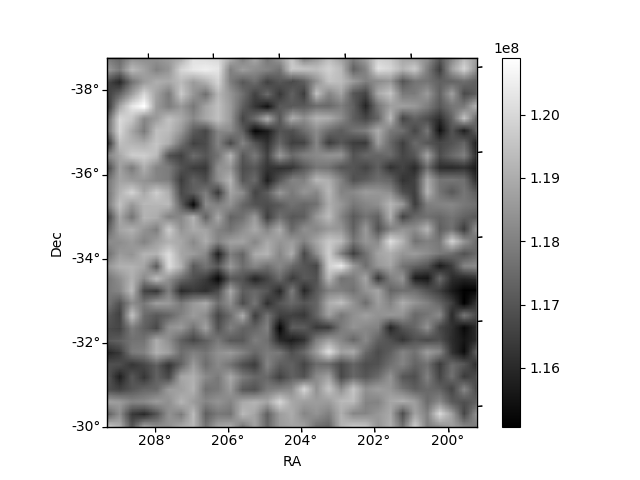
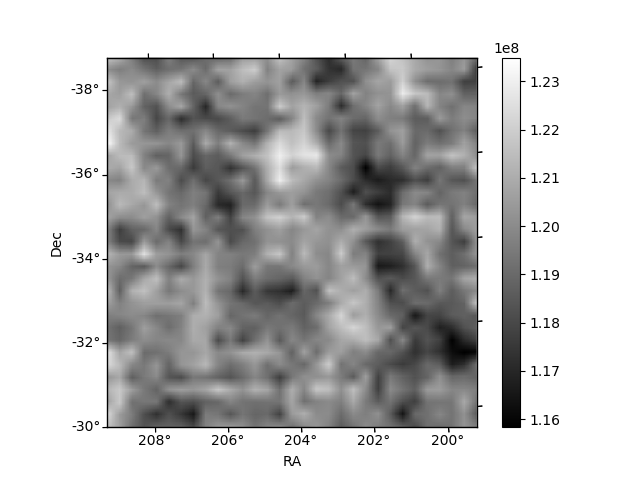
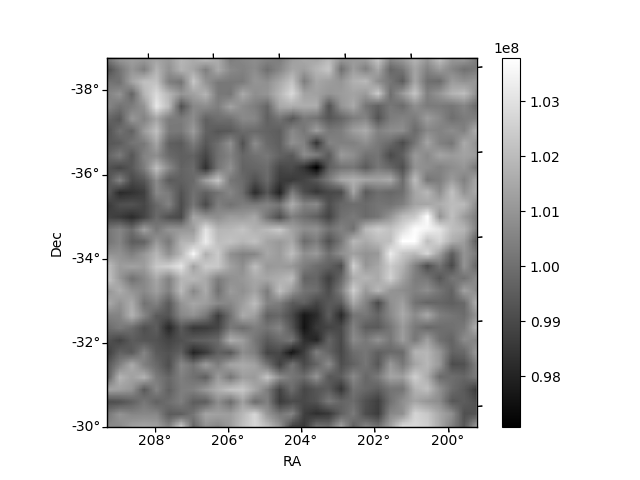
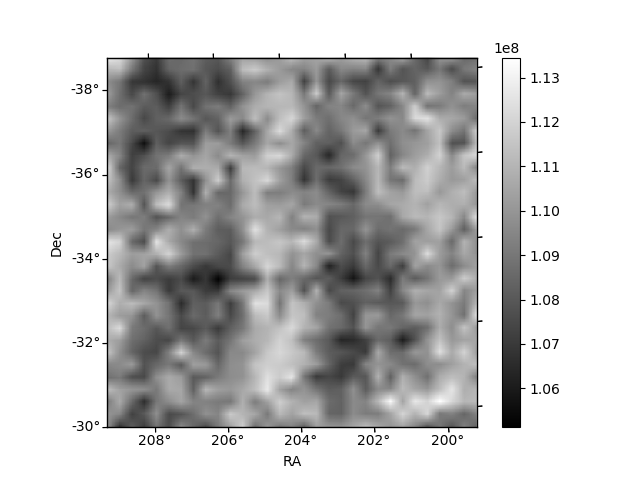
Histogram calculated using DETX and DETY for each event in the final _common_clean file
| Quadrant A | 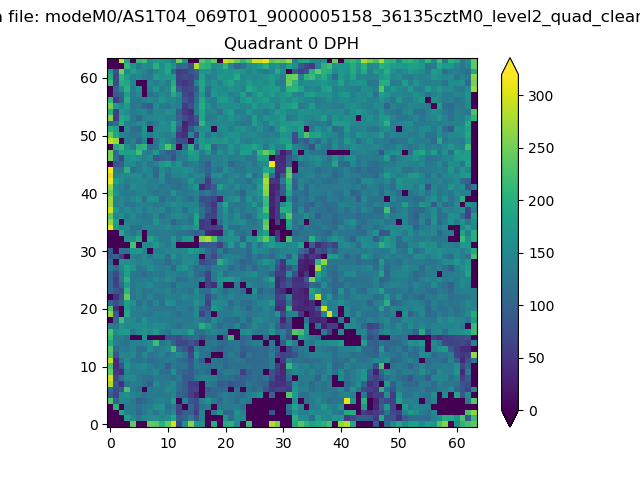 |
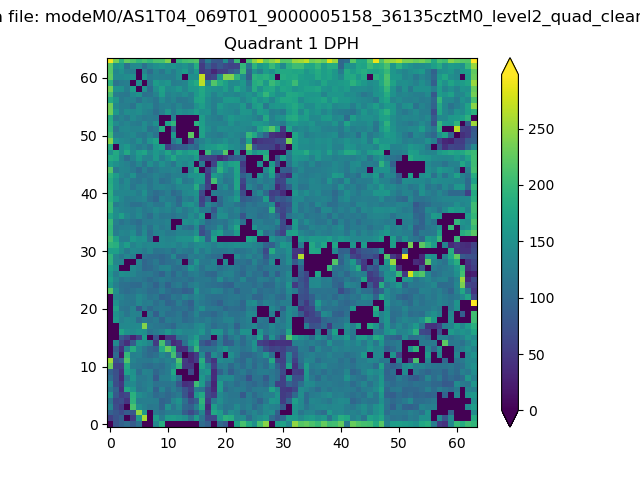 |
Quadrant B |
|---|---|---|---|
| Quadrant D | 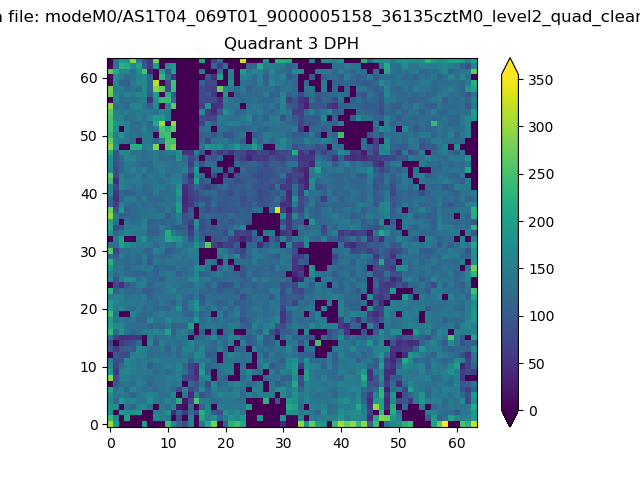 |
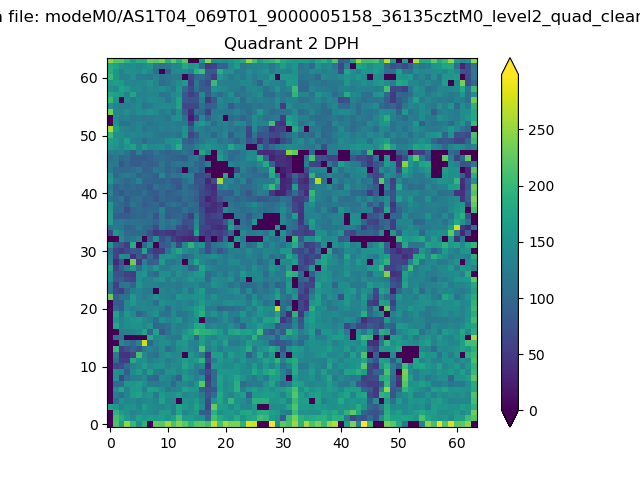 |
Quadrant C |
| Plot type | Count rate plots | Images |
|---|---|---|
| Comparison with Poisson distribution Blue bars denote a histogram of data divided into 1 sec bins. Red curve is a Poisson curve with rate = median count rate of data. |
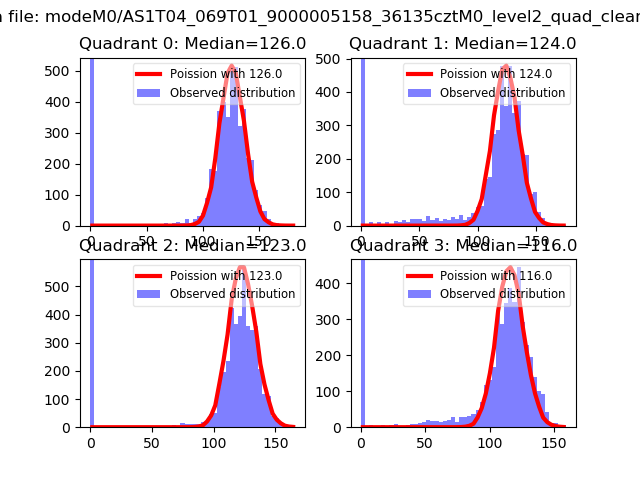 |
 |
| Quadrant-wise count rates Data is divided into 100 sec bins |
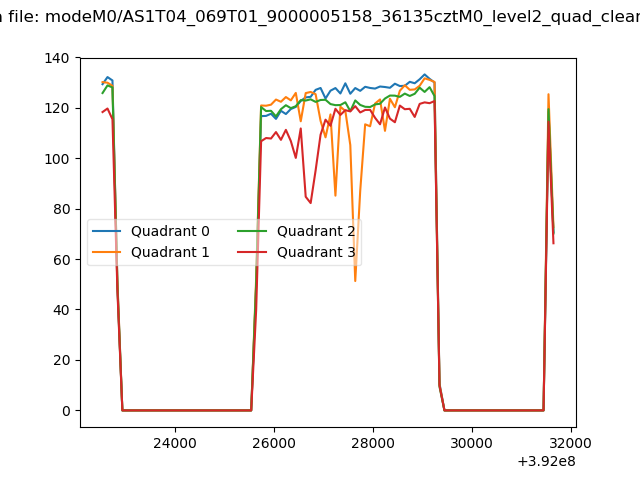 |
|
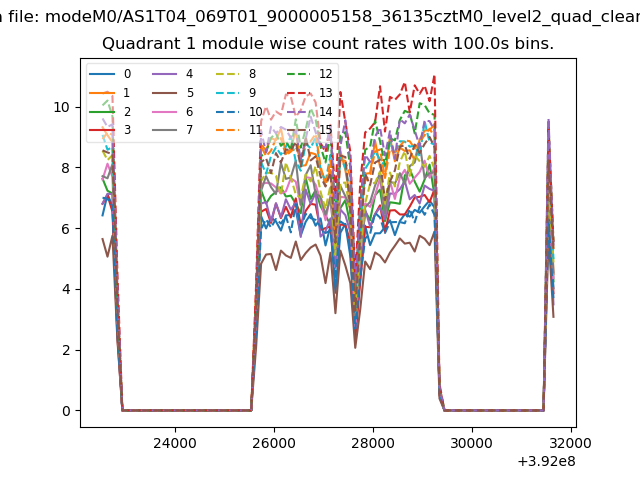
| Module-wise count rates for Quadrant A Data is divided into 100 sec bins |
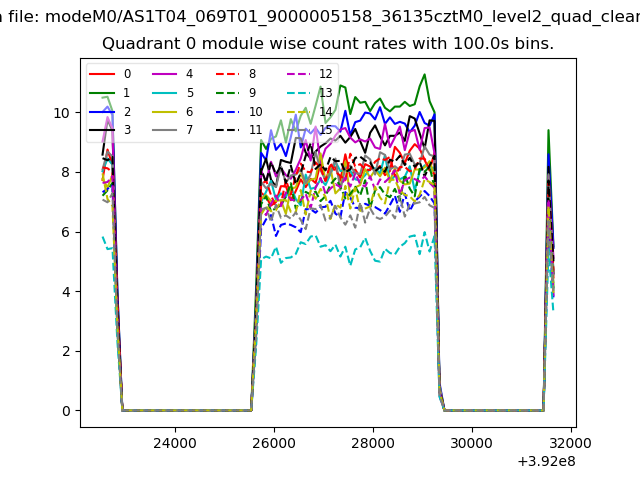 |
 |
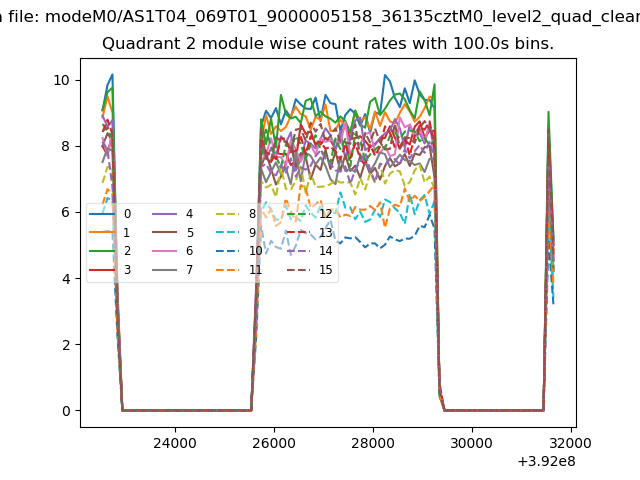
| Module-wise count rates for Quadrant B Data is divided into 100 sec bins |
 |
 |
| Module-wise count rates for Quadrant C Data is divided into 100 sec bins |
 |
 |
| Module-wise count rates for Quadrant D Data is divided into 100 sec bins |
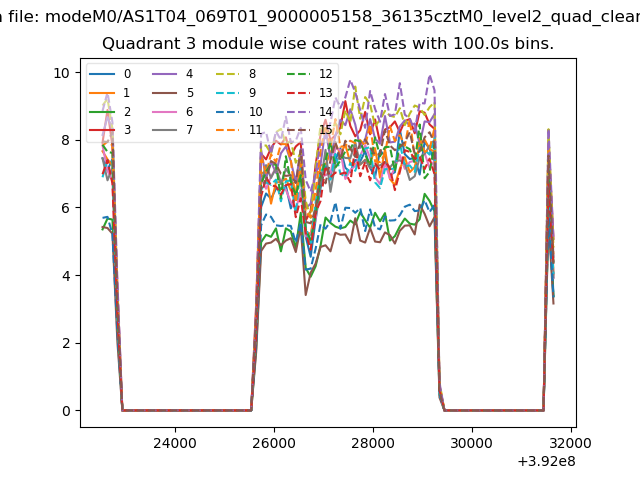 |
 |
| Parameter | Plot |
|---|---|
| CZT HV Monitor | 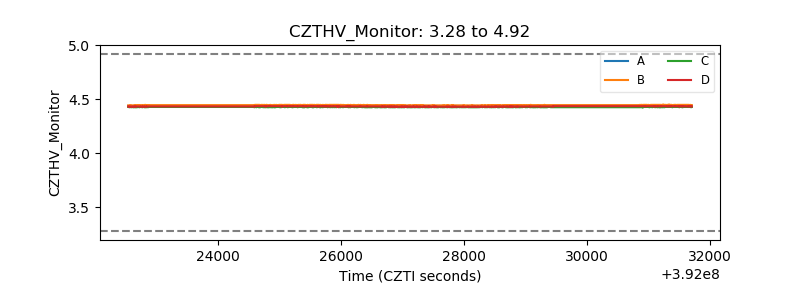 |
| D_VDD | 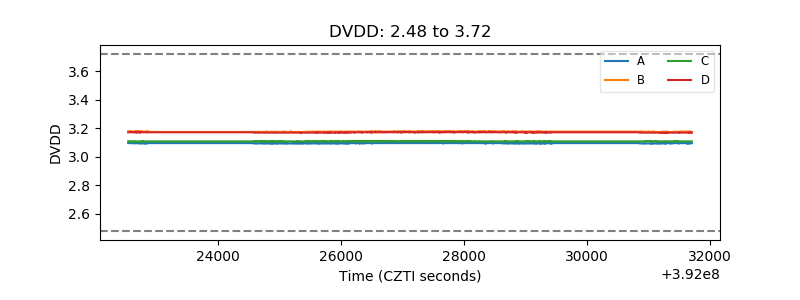 |
| Temperature 1 | 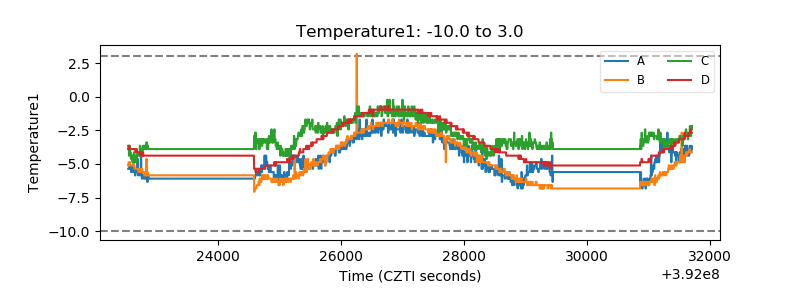 |
| Veto HV Monitor | 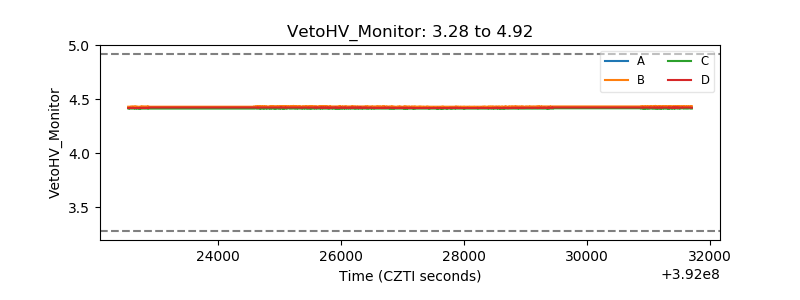 |
| Veto LLD | 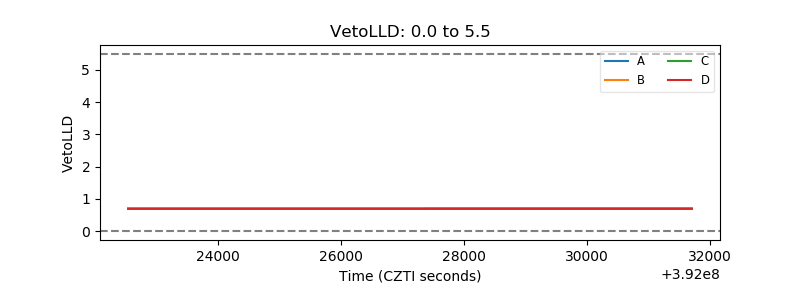 |
| Alpha Counter | 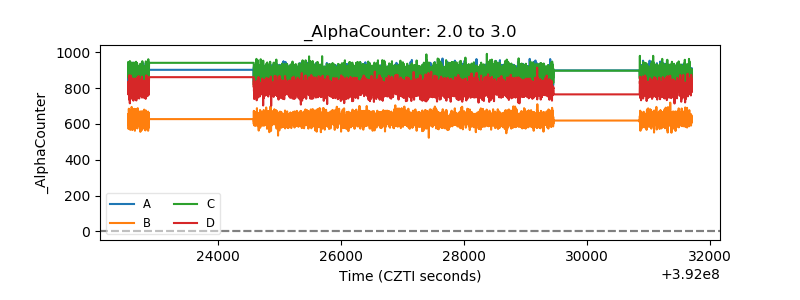 |
| _CPM_Rate | 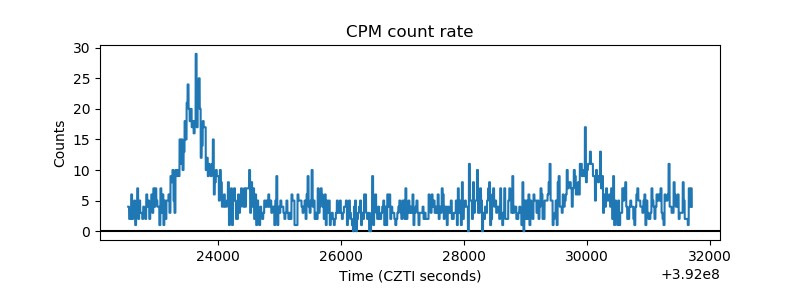 |
| CZT Counter | 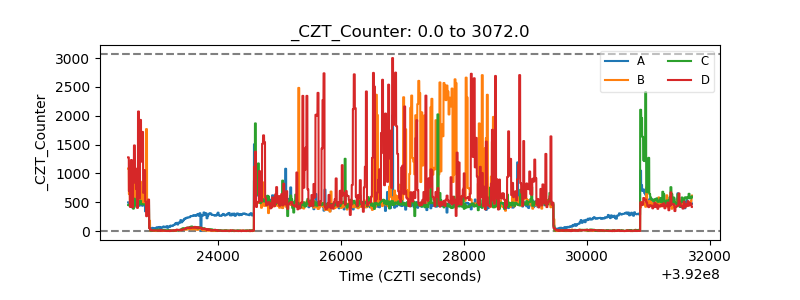 |
| +2.5 Volts monitor | 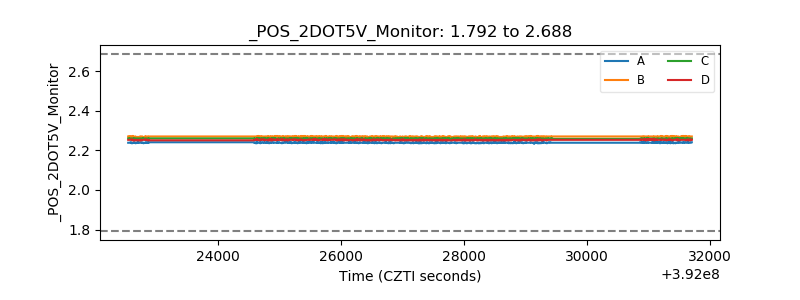 |
| +5 Volts monitor | 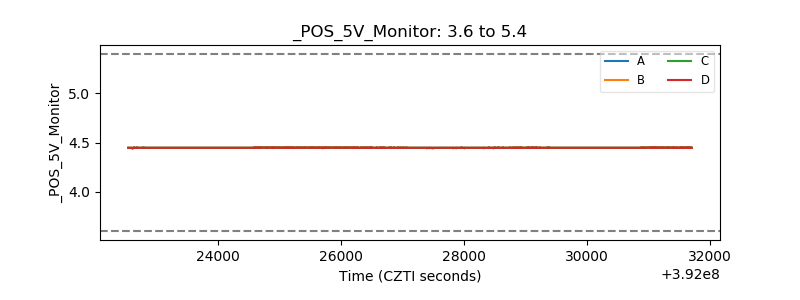 |
| _ROLL_ROT | 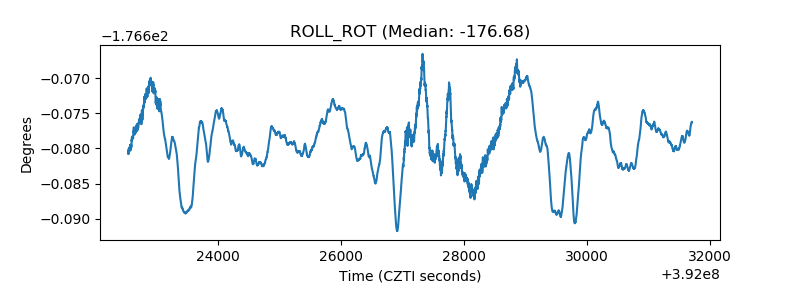 |
| _Roll_DEC | 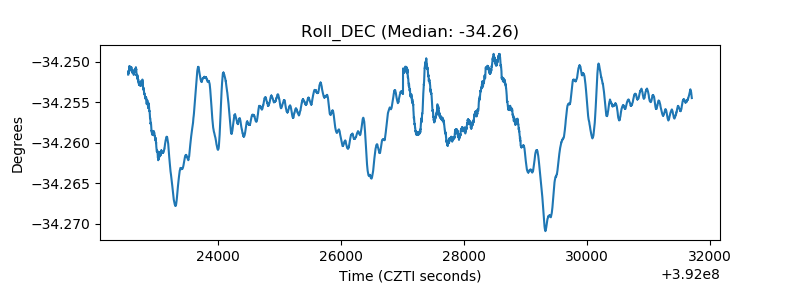 |
| _Roll_RA | 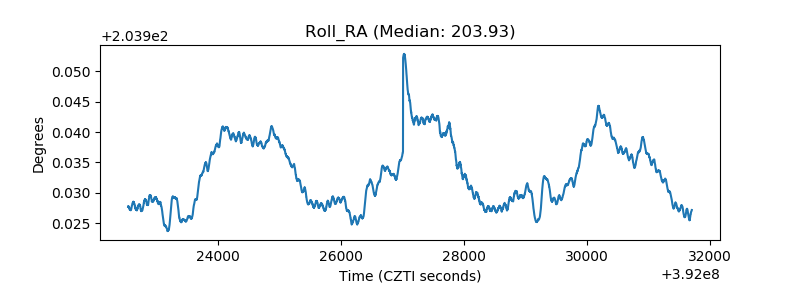 |
| Veto Counter | 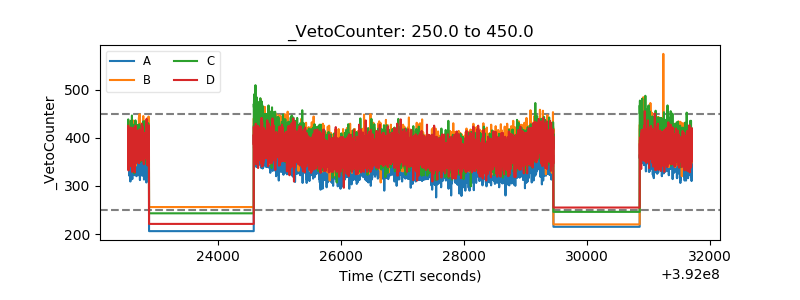 |