| Param | Original file | Final file |
|---|---|---|
| Filename | modeM0/AS1T04_069T01_9000005158_36133cztM0_level2.evt | modeM0/AS1T04_069T01_9000005158_36133cztM0_level2_quad_clean.evt |
| Size (bytes) | 445,256,640 | 50,486,400 |
| Size | 424.6 MB | 48.1 MB |
| Events in quadrant A | 2,657,052 | 300,178 |
| Events in quadrant B | 2,938,321 | 299,902 |
| Events in quadrant C | 3,361,457 | 290,696 |
| Events in quadrant D | 4,172,785 | 271,310 |
| Mode M0 | |||
|---|---|---|---|
| Quadrant | BADHDUFLAG | Total packets | Discarded packets |
| A | 0 | 11042 | 3 |
| B | 0 | 12038 | 2 |
| C | 0 | 13107 | 2 |
| D | 0 | 15864 | 2 |
| Mode M9 | |||
|---|---|---|---|
| Quadrant | BADHDUFLAG | Total packets | Discarded packets |
| A | 0 | 36 | 0 |
| B | 0 | 36 | 0 |
| C | 0 | 36 | 0 |
| D | 0 | 37 | 0 |
| Mode SS | |||
|---|---|---|---|
| Quadrant | BADHDUFLAG | Total packets | Discarded packets |
| A | 0 | 106 | 0 |
| B | 0 | 106 | 0 |
| C | 0 | 106 | 0 |
| D | 0 | 106 | 0 |
| Quadrant | Total seconds | Saturated seconds | Saturation percentage |
|---|---|---|---|
| A | 5228 | 10 | 0.191278% |
| B | 5228 | 114 | 2.180566% |
| C | 5228 | 148 | 2.830910% |
| D | 5228 | 440 | 8.416220% |
Noise dominated data is calculated using 1-second bins in cleaned event files. If a bin has >2000 counts, and if more than 50% of those come from <1% of pixels, then it is considered to be noise-dominated and hence unusable.
| Quadrant | # 1 sec bins | Bins with >0 counts | Bins with >2000 counts | High rate bins dominated by noise | Noise dominated (total time) | Noise dominated (detector-on time) | Marked lightcurve |
|---|---|---|---|---|---|---|---|
| A | 7232 | 5229 | 4 | 4 | 0.06% | 0.08% |  |
| B | 7232 | 5229 | 75 | 75 | 1.04% | 1.43% |  |
| C | 7232 | 5229 | 120 | 120 | 1.66% | 2.29% |  |
| D | 7232 | 5229 | 350 | 350 | 4.84% | 6.69% |  |
Top three noisy pixels from each quadrant. If the there are fewer than three noisy pixels in the level2.evt file, extra rows are filled as -1
| Pixel properties | Quadrant properties | ||||||
|---|---|---|---|---|---|---|---|
| Quadrant | DetID | PixID | Counts | Sigma | Mean | Median | Sigma |
| A | 10 | 83 | 171568 | 1374.74 | 614 | 603 | 124.4 |
| A | 15 | 223 | 60570 | 482.2 | 614 | 603 | 124.4 |
| A | 9 | 143 | 31370 | 247.4 | 614 | 603 | 124.4 |
| B | 5 | 172 | 455975 | 3883.2 | 608 | 590 | 117.3 |
| B | 5 | 255 | 40916 | 343.87 | 608 | 590 | 117.3 |
| B | 4 | 232 | 22556 | 187.31 | 608 | 590 | 117.3 |
| C | 0 | 207 | 538366 | 3937.74 | 589 | 592 | 136.6 |
| C | 15 | 214 | 221150 | 1614.99 | 589 | 592 | 136.6 |
| C | 0 | 10 | 190752 | 1392.41 | 589 | 592 | 136.6 |
| D | 12 | 17 | 1110887 | 7806.7 | 577 | 560 | 142.2 |
| D | 2 | 250 | 252513 | 1771.48 | 577 | 560 | 142.2 |
| D | 13 | 249 | 195302 | 1369.23 | 577 | 560 | 142.2 |
Histogram calculated using DETX and DETY for each event in the final _common_clean file
| Quadrant A |  |
 |
Quadrant B |
|---|---|---|---|
| Quadrant D | 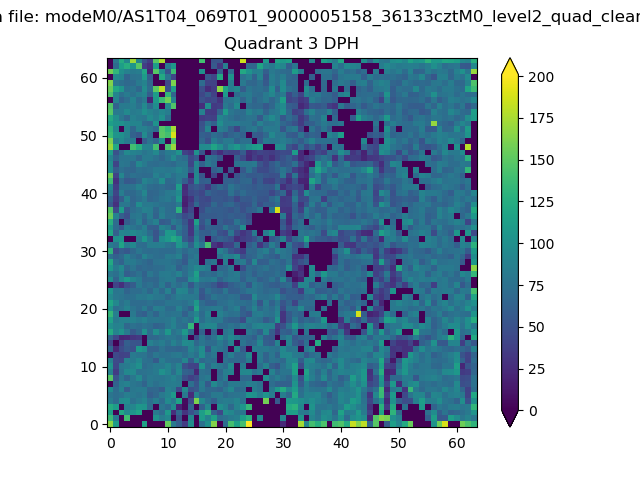 |
 |
Quadrant C |
| Plot type | Count rate plots | Images |
|---|---|---|
| Comparison with Poisson distribution Blue bars denote a histogram of data divided into 1 sec bins. Red curve is a Poisson curve with rate = median count rate of data. |
 |
 |
| Quadrant-wise count rates Data is divided into 100 sec bins |
 |
|
| Module-wise count rates for Quadrant A Data is divided into 100 sec bins |
 |
 |
| Module-wise count rates for Quadrant B Data is divided into 100 sec bins |
 |
 |
| Module-wise count rates for Quadrant C Data is divided into 100 sec bins |
 |
 |
| Module-wise count rates for Quadrant D Data is divided into 100 sec bins |
 |
 |
| Parameter | Plot |
|---|---|
| CZT HV Monitor |  |
| D_VDD |  |
| Temperature 1 |  |
| Veto HV Monitor |  |
| Veto LLD |  |
| Alpha Counter |  |
| _CPM_Rate |  |
| CZT Counter |  |
| +2.5 Volts monitor |  |
| +5 Volts monitor |  |
| _ROLL_ROT |  |
| _Roll_DEC |  |
| _Roll_RA |  |
| Veto Counter |  |