| Param | Original file | Final file |
|---|---|---|
| Filename | modeM0/AS1T04_069T01_9000005158_36132cztM0_level2.evt | modeM0/AS1T04_069T01_9000005158_36132cztM0_level2_quad_clean.evt |
| Size (bytes) | 446,382,720 | 46,883,520 |
| Size | 425.7 MB | 44.7 MB |
| Events in quadrant A | 2,722,710 | 269,918 |
| Events in quadrant B | 3,258,436 | 266,798 |
| Events in quadrant C | 3,033,949 | 267,830 |
| Events in quadrant D | 4,146,703 | 246,187 |
| Mode M0 | |||
|---|---|---|---|
| Quadrant | BADHDUFLAG | Total packets | Discarded packets |
| A | 0 | 11260 | 3 |
| B | 0 | 12982 | 2 |
| C | 0 | 11959 | 2 |
| D | 0 | 15802 | 2 |
| Mode M9 | |||
|---|---|---|---|
| Quadrant | BADHDUFLAG | Total packets | Discarded packets |
| A | 0 | 42 | 0 |
| B | 0 | 42 | 0 |
| C | 0 | 42 | 0 |
| D | 0 | 42 | 0 |
| Mode SS | |||
|---|---|---|---|
| Quadrant | BADHDUFLAG | Total packets | Discarded packets |
| A | 0 | 110 | 0 |
| B | 0 | 110 | 0 |
| C | 0 | 110 | 0 |
| D | 0 | 110 | 0 |
| Quadrant | Total seconds | Saturated seconds | Saturation percentage |
|---|---|---|---|
| A | 5254 | 28 | 0.532927% |
| B | 5254 | 178 | 3.387895% |
| C | 5254 | 68 | 1.294252% |
| D | 5254 | 404 | 7.689380% |
Noise dominated data is calculated using 1-second bins in cleaned event files. If a bin has >2000 counts, and if more than 50% of those come from <1% of pixels, then it is considered to be noise-dominated and hence unusable.
| Quadrant | # 1 sec bins | Bins with >0 counts | Bins with >2000 counts | High rate bins dominated by noise | Noise dominated (total time) | Noise dominated (detector-on time) | Marked lightcurve |
|---|---|---|---|---|---|---|---|
| A | 9501 | 5256 | 9 | 9 | 0.09% | 0.17% | 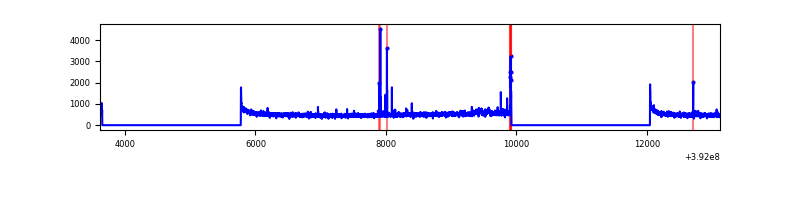 |
| B | 9501 | 5256 | 103 | 103 | 1.08% | 1.96% | 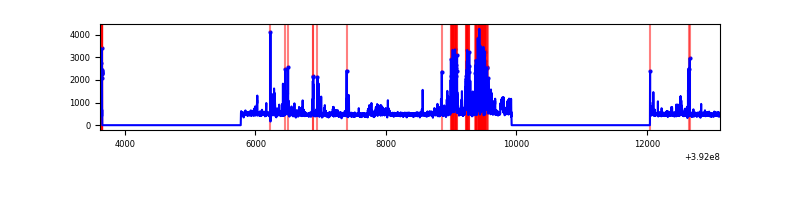 |
| C | 9501 | 5256 | 56 | 56 | 0.59% | 1.07% | 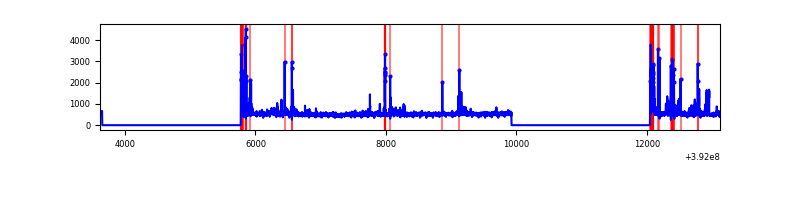 |
| D | 9501 | 5256 | 336 | 336 | 3.54% | 6.39% | 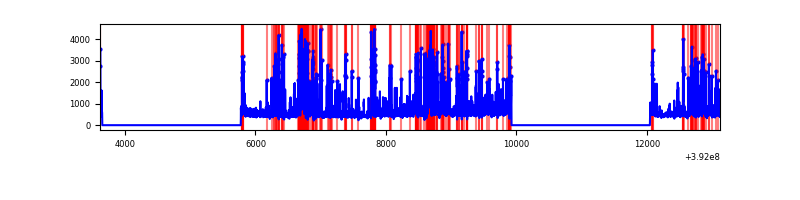 |
Top three noisy pixels from each quadrant. If the there are fewer than three noisy pixels in the level2.evt file, extra rows are filled as -1
| Pixel properties | Quadrant properties | ||||||
|---|---|---|---|---|---|---|---|
| Quadrant | DetID | PixID | Counts | Sigma | Mean | Median | Sigma |
| A | 10 | 83 | 167183 | 1318.35 | 631 | 619 | 126.3 |
| A | 9 | 143 | 70123 | 550.12 | 631 | 619 | 126.3 |
| A | 15 | 223 | 29852 | 231.38 | 631 | 619 | 126.3 |
| B | 5 | 172 | 668410 | 5593.52 | 624 | 608 | 119.4 |
| B | 4 | 232 | 92014 | 765.62 | 624 | 608 | 119.4 |
| B | 0 | 229 | 21517 | 175.13 | 624 | 608 | 119.4 |
| C | 0 | 207 | 261707 | 1840.01 | 614 | 619 | 141.9 |
| C | 15 | 214 | 222615 | 1564.51 | 614 | 619 | 141.9 |
| C | 0 | 10 | 131302 | 920.98 | 614 | 619 | 141.9 |
| D | 12 | 17 | 1032675 | 7073.6 | 593 | 577 | 145.9 |
| D | 13 | 249 | 231058 | 1579.63 | 593 | 577 | 145.9 |
| D | 2 | 250 | 217194 | 1484.61 | 593 | 577 | 145.9 |
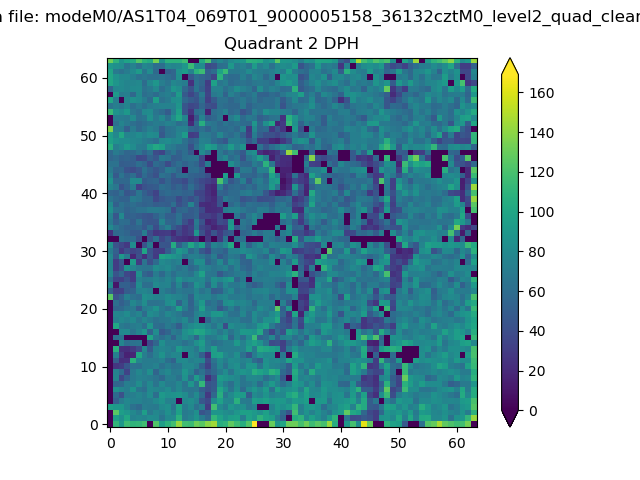
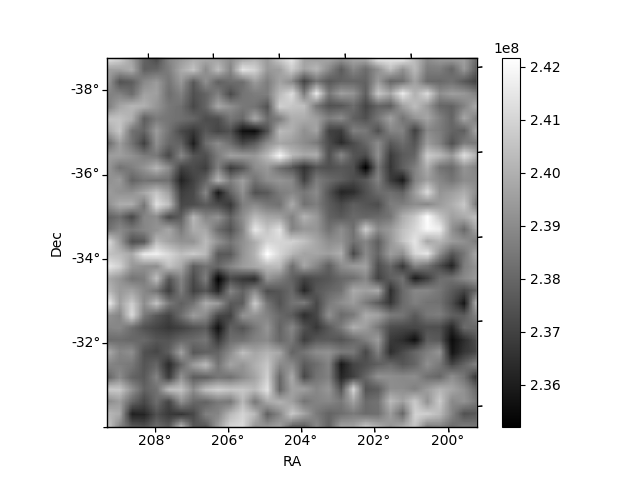
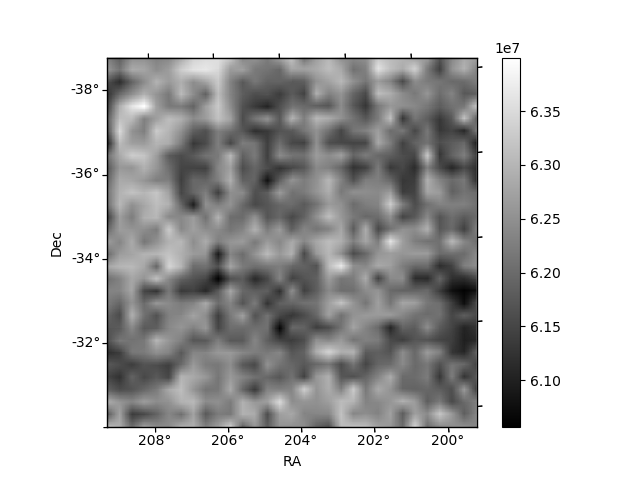
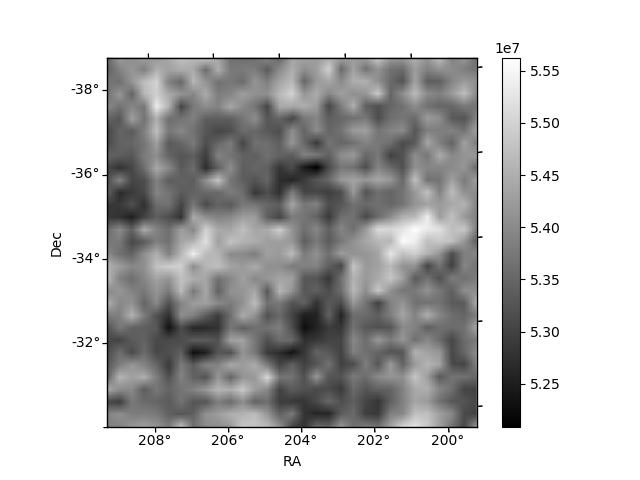
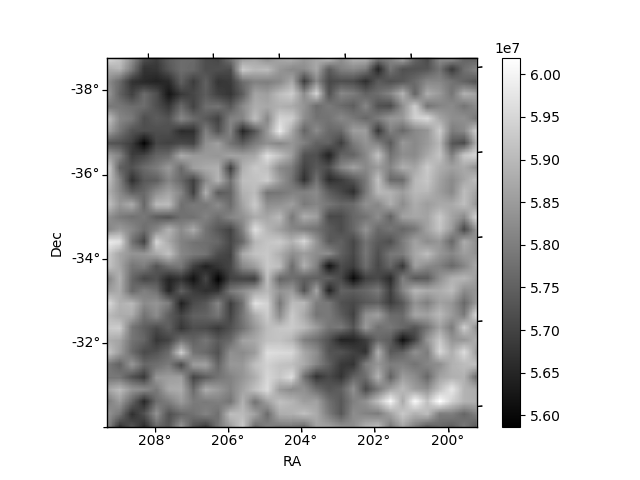
Histogram calculated using DETX and DETY for each event in the final _common_clean file
| Quadrant A | 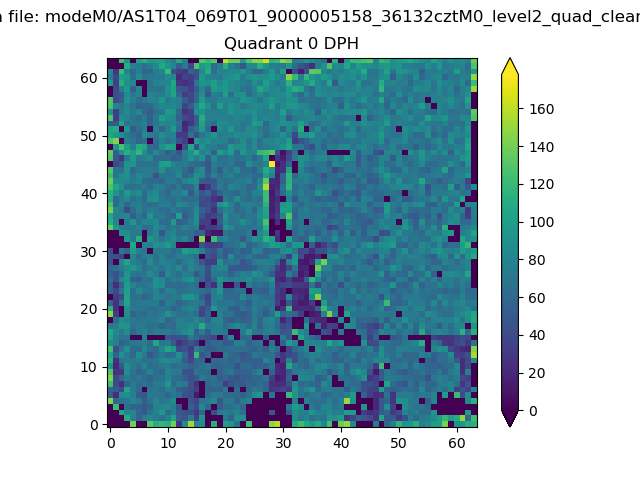 |
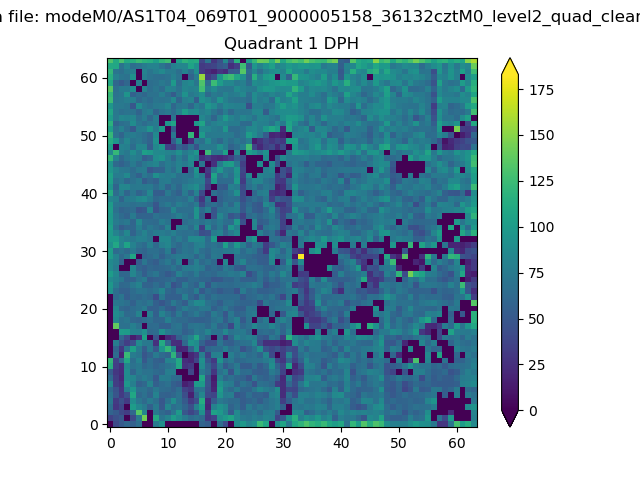 |
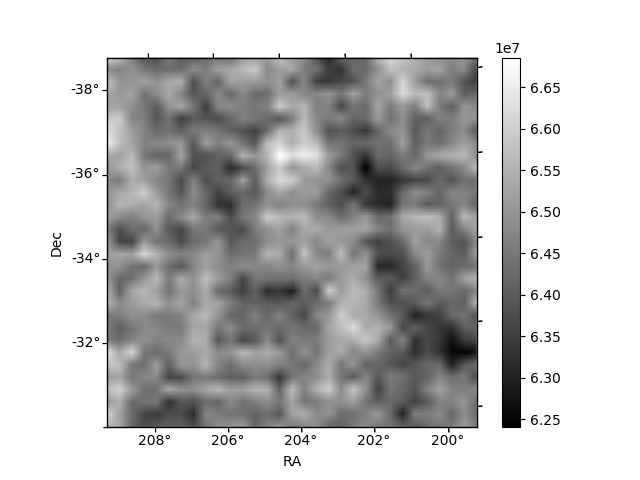
Quadrant B |
|---|---|---|---|
| Quadrant D | 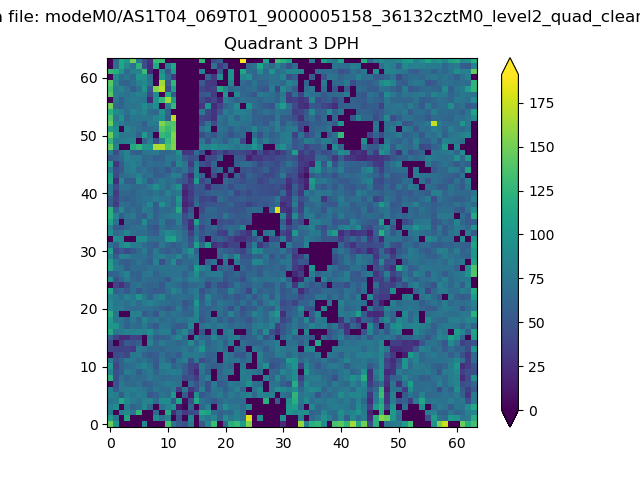 |
 |
Quadrant C |
| Plot type | Count rate plots | Images |
|---|---|---|
| Comparison with Poisson distribution Blue bars denote a histogram of data divided into 1 sec bins. Red curve is a Poisson curve with rate = median count rate of data. |
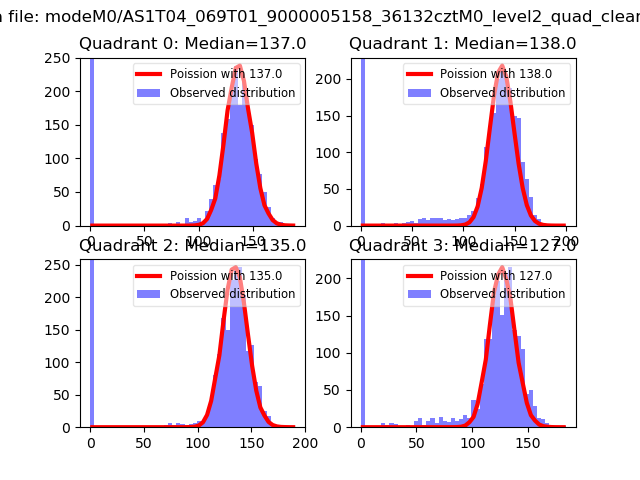 |
 |
| Quadrant-wise count rates Data is divided into 100 sec bins |
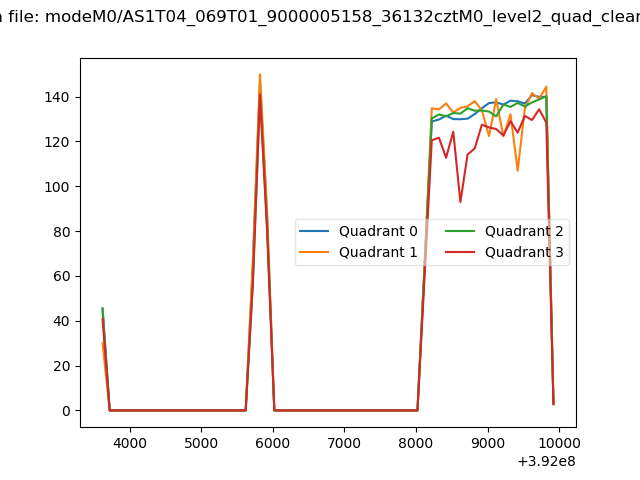 |
|
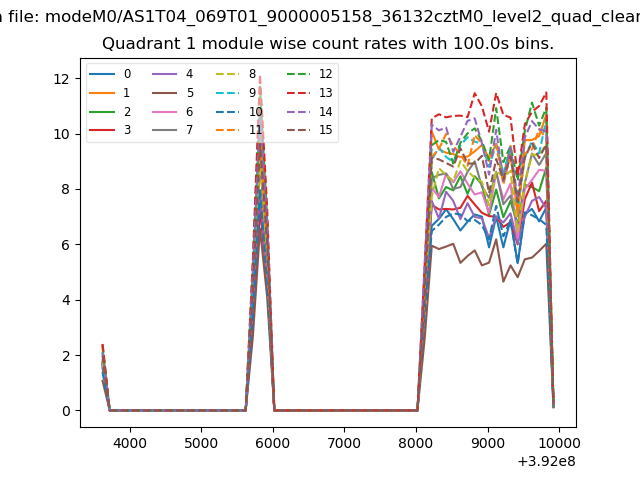
| Module-wise count rates for Quadrant A Data is divided into 100 sec bins |
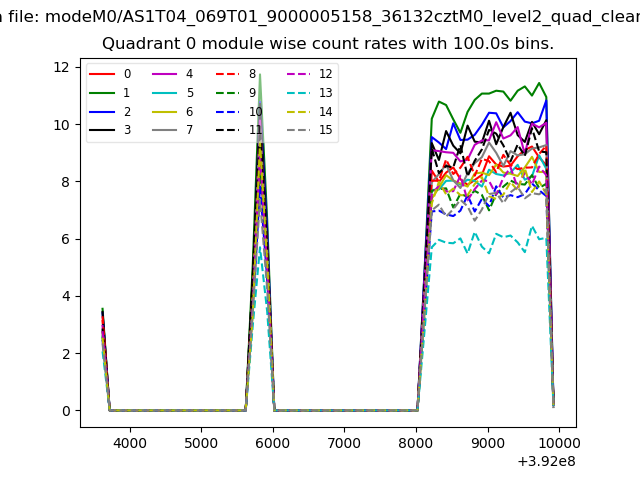 |
 |
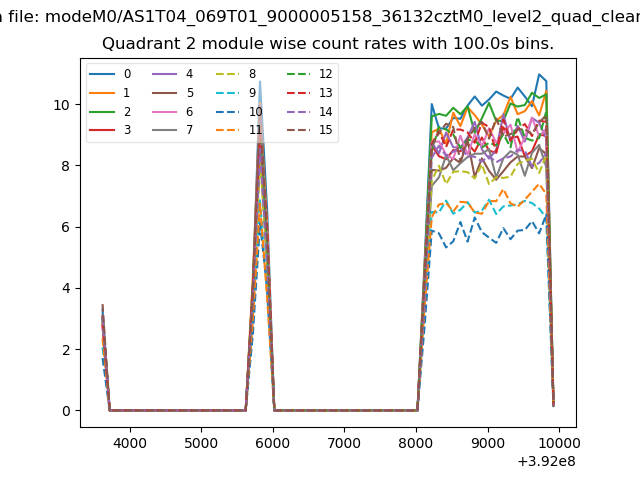
| Module-wise count rates for Quadrant B Data is divided into 100 sec bins |
 |
 |
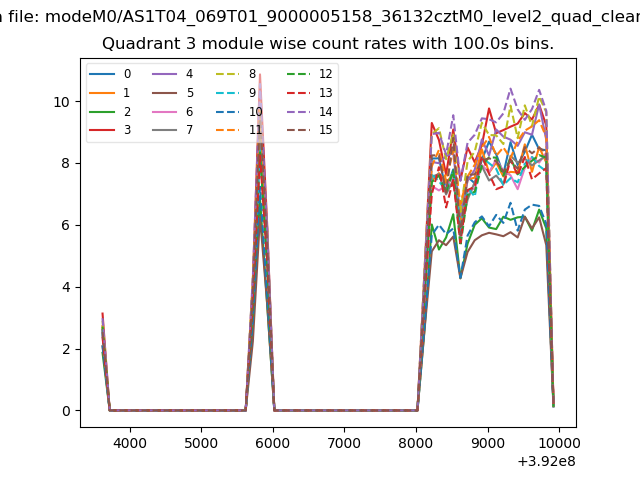
| Module-wise count rates for Quadrant C Data is divided into 100 sec bins |
 |
 |
| Module-wise count rates for Quadrant D Data is divided into 100 sec bins |
 |
 |
| Parameter | Plot |
|---|---|
| CZT HV Monitor | 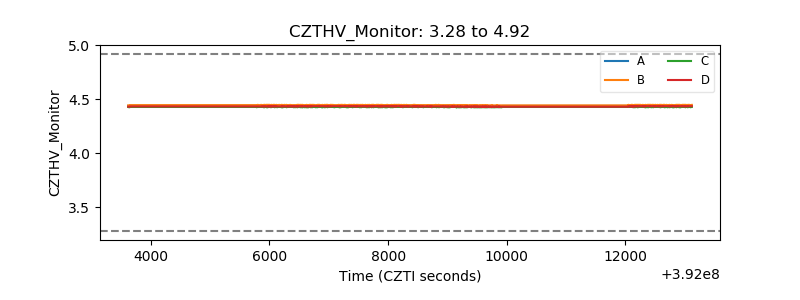 |
| D_VDD | 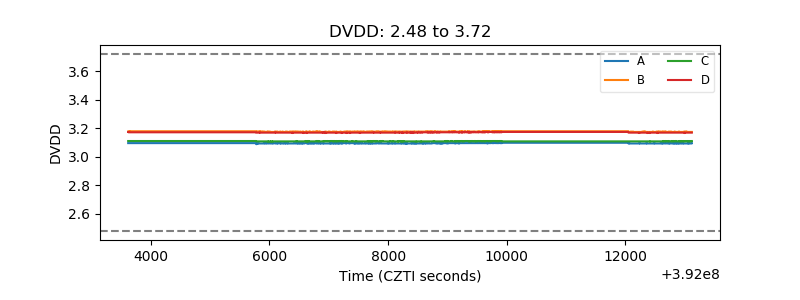 |
| Temperature 1 | 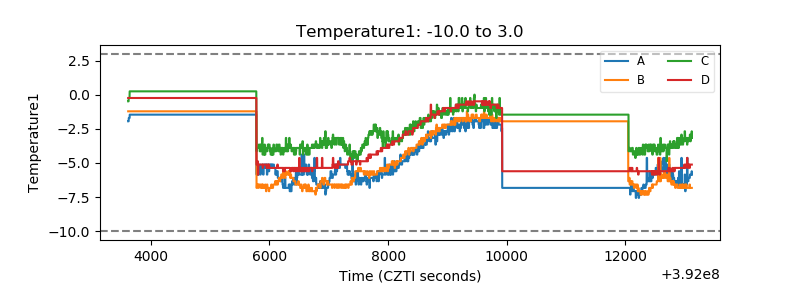 |
| Veto HV Monitor | 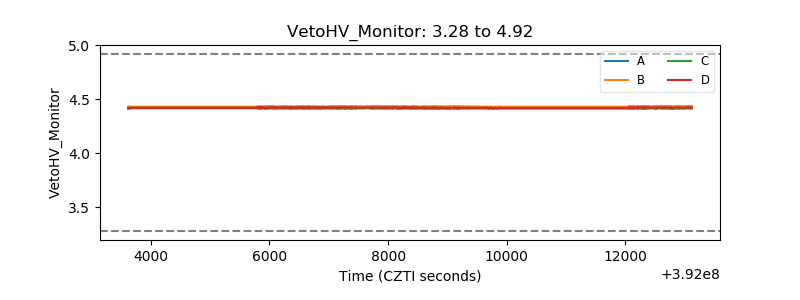 |
| Veto LLD | 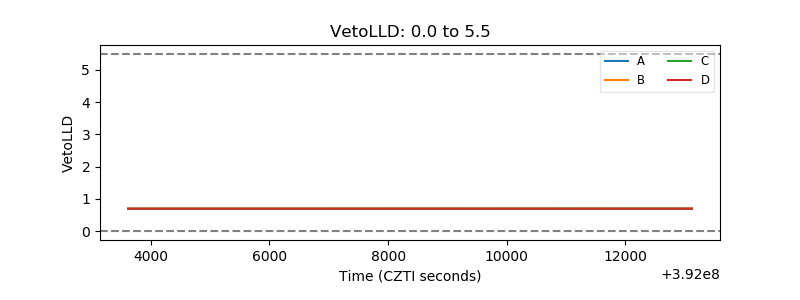 |
| Alpha Counter | 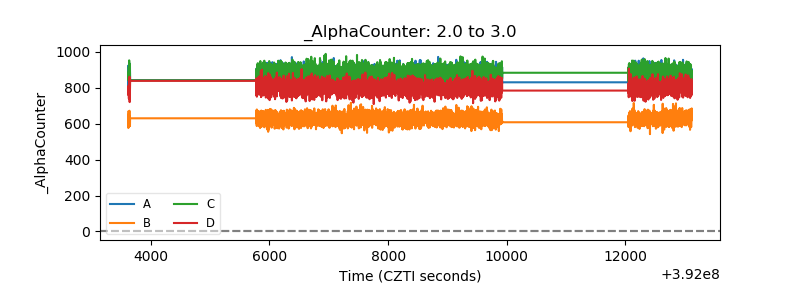 |
| _CPM_Rate | 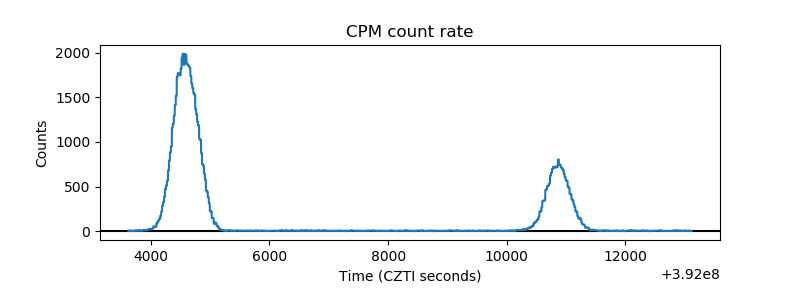 |
| CZT Counter | 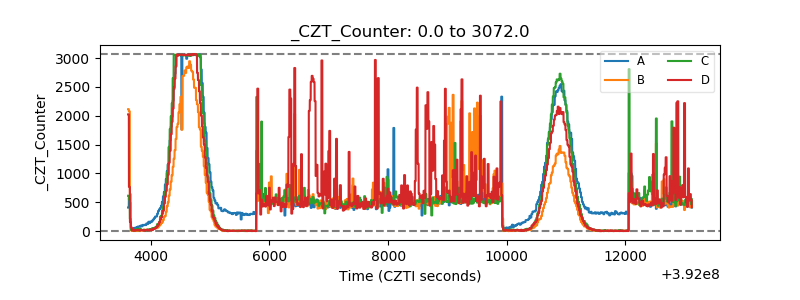 |
| +2.5 Volts monitor | 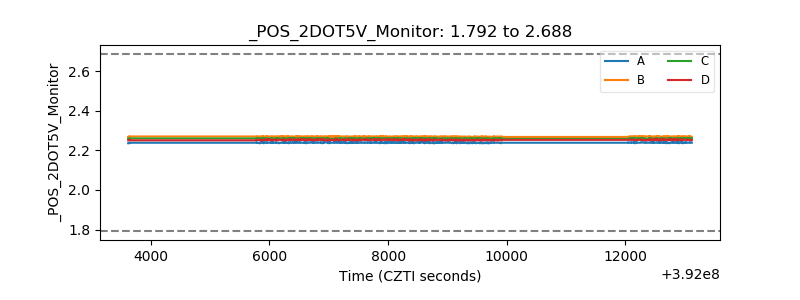 |
| +5 Volts monitor | 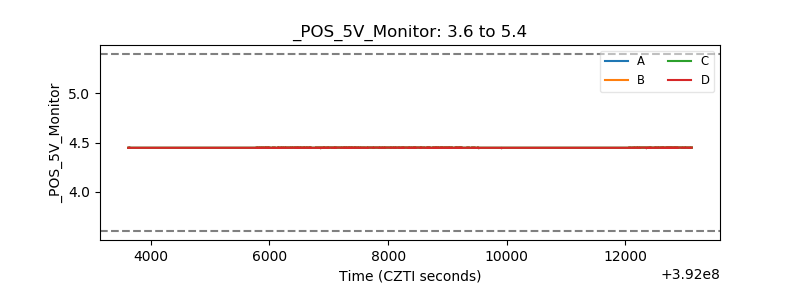 |
| _ROLL_ROT | 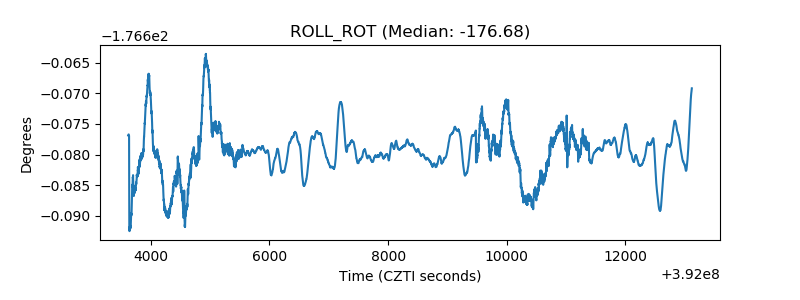 |
| _Roll_DEC | 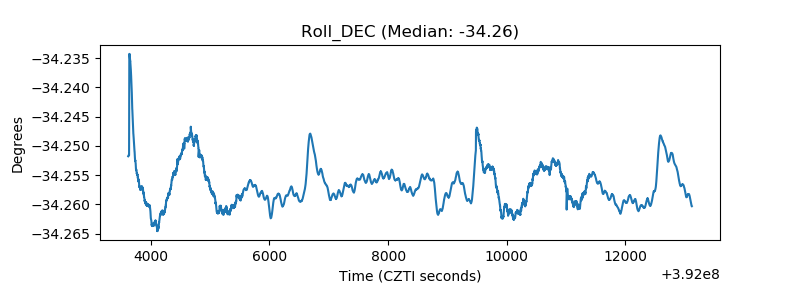 |
| _Roll_RA | 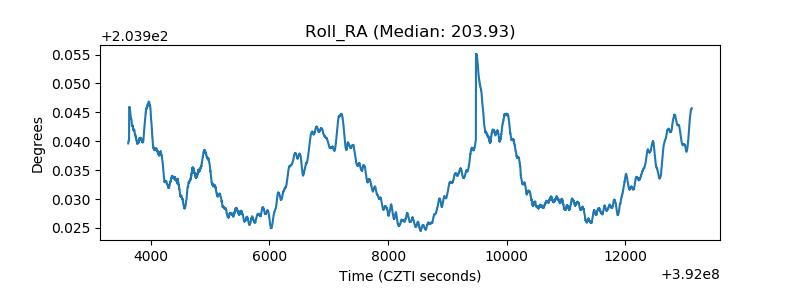 |
| Veto Counter | 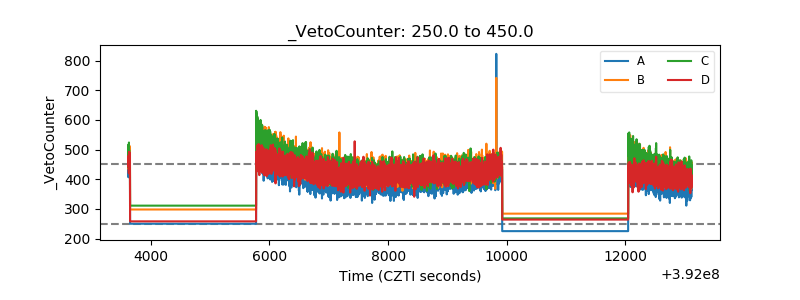 |