| Param | Original file | Final file |
|---|---|---|
| Filename | modeM0/AS1T04_069T01_9000005158_36129cztM0_level2.evt | modeM0/AS1T04_069T01_9000005158_36129cztM0_level2_quad_clean.evt |
| Size (bytes) | 464,768,640 | 62,997,120 |
| Size | 443.2 MB | 60.1 MB |
| Events in quadrant A | 2,667,845 | 405,699 |
| Events in quadrant B | 2,958,828 | 404,924 |
| Events in quadrant C | 2,762,572 | 395,015 |
| Events in quadrant D | 5,342,703 | 346,841 |
| Mode M0 | |||
|---|---|---|---|
| Quadrant | BADHDUFLAG | Total packets | Discarded packets |
| A | 0 | 11075 | 3 |
| B | 0 | 11986 | 2 |
| C | 0 | 11110 | 2 |
| D | 0 | 19242 | 2 |
| Mode M9 | |||
|---|---|---|---|
| Quadrant | BADHDUFLAG | Total packets | Discarded packets |
| A | 0 | 28 | 0 |
| B | 0 | 28 | 0 |
| C | 0 | 28 | 0 |
| D | 0 | 29 | 0 |
| Mode SS | |||
|---|---|---|---|
| Quadrant | BADHDUFLAG | Total packets | Discarded packets |
| A | 0 | 102 | 0 |
| B | 0 | 102 | 0 |
| C | 0 | 102 | 0 |
| D | 0 | 102 | 0 |
| Quadrant | Total seconds | Saturated seconds | Saturation percentage |
|---|---|---|---|
| A | 5063 | 12 | 0.237014% |
| B | 5063 | 160 | 3.160182% |
| C | 5063 | 55 | 1.086312% |
| D | 5063 | 912 | 18.013036% |
Noise dominated data is calculated using 1-second bins in cleaned event files. If a bin has >2000 counts, and if more than 50% of those come from <1% of pixels, then it is considered to be noise-dominated and hence unusable.
| Quadrant | # 1 sec bins | Bins with >0 counts | Bins with >2000 counts | High rate bins dominated by noise | Noise dominated (total time) | Noise dominated (detector-on time) | Marked lightcurve |
|---|---|---|---|---|---|---|---|
| A | 7005 | 5064 | 3 | 3 | 0.04% | 0.06% | 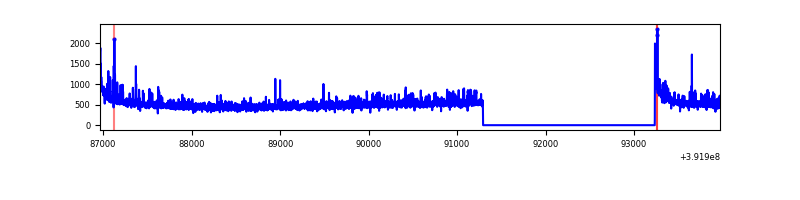 |
| B | 7005 | 5064 | 108 | 108 | 1.54% | 2.13% | 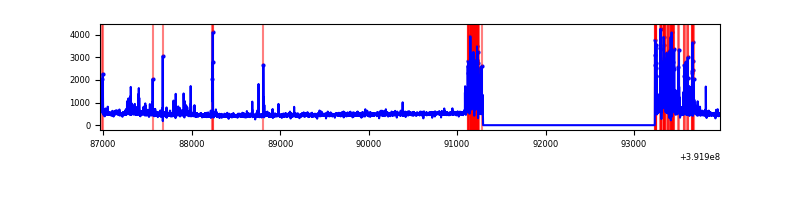 |
| C | 7005 | 5064 | 41 | 41 | 0.59% | 0.81% | 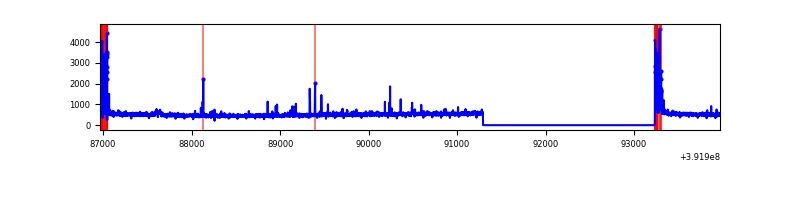 |
| D | 7005 | 5064 | 777 | 777 | 11.09% | 15.34% | 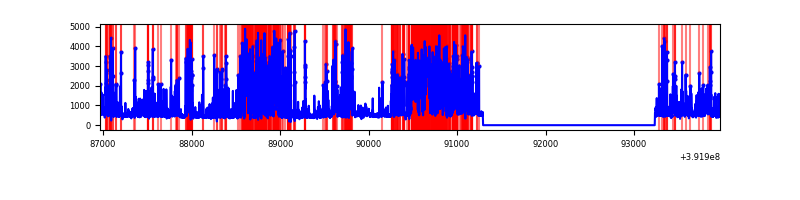 |
Top three noisy pixels from each quadrant. If the there are fewer than three noisy pixels in the level2.evt file, extra rows are filled as -1
| Pixel properties | Quadrant properties | ||||||
|---|---|---|---|---|---|---|---|
| Quadrant | DetID | PixID | Counts | Sigma | Mean | Median | Sigma |
| A | 10 | 83 | 169075 | 1375.71 | 605 | 593 | 122.5 |
| A | 15 | 223 | 114228 | 927.86 | 605 | 593 | 122.5 |
| A | 9 | 143 | 20132 | 159.54 | 605 | 593 | 122.5 |
| B | 5 | 172 | 472858 | 4141.58 | 600 | 586 | 114.0 |
| B | 5 | 255 | 42898 | 371.05 | 600 | 586 | 114.0 |
| B | 15 | 85 | 28209 | 242.24 | 600 | 586 | 114.0 |
| C | 15 | 214 | 215517 | 1563.63 | 586 | 592 | 137.5 |
| C | 0 | 10 | 163158 | 1182.7 | 586 | 592 | 137.5 |
| C | 10 | 49 | 69352 | 500.24 | 586 | 592 | 137.5 |
| D | 12 | 17 | 2231571 | 17301.97 | 524 | 510 | 128.9 |
| D | 2 | 249 | 285668 | 2211.41 | 524 | 510 | 128.9 |
| D | 13 | 249 | 250107 | 1935.63 | 524 | 510 | 128.9 |
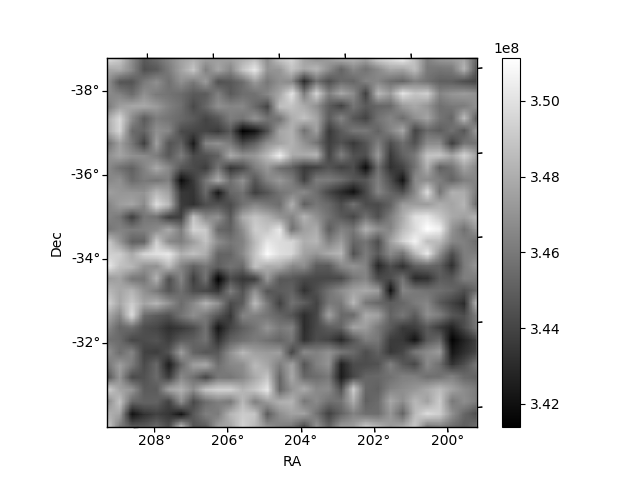
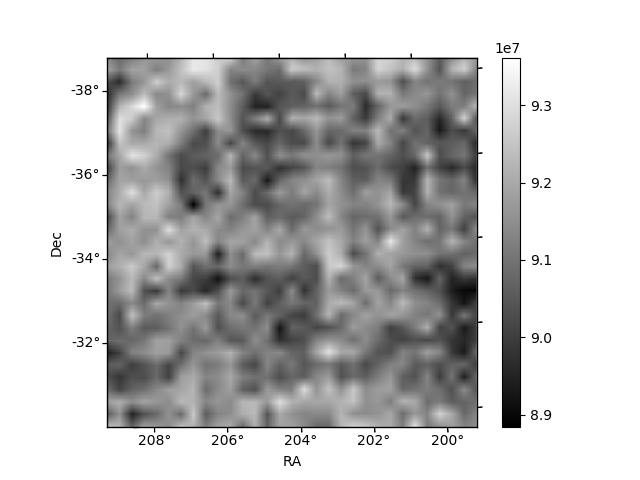
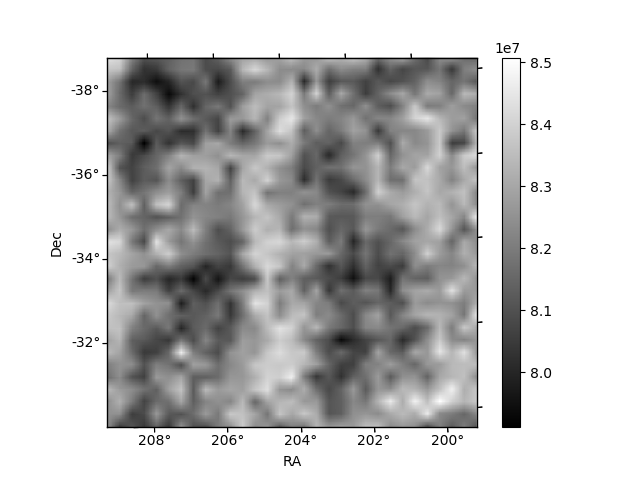
Histogram calculated using DETX and DETY for each event in the final _common_clean file
| Quadrant A | 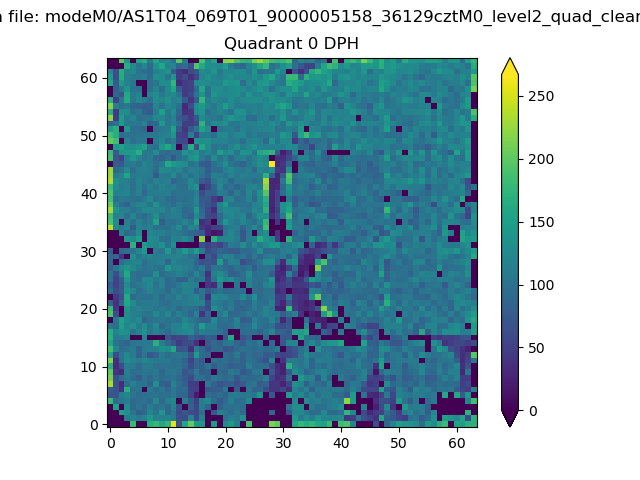 |
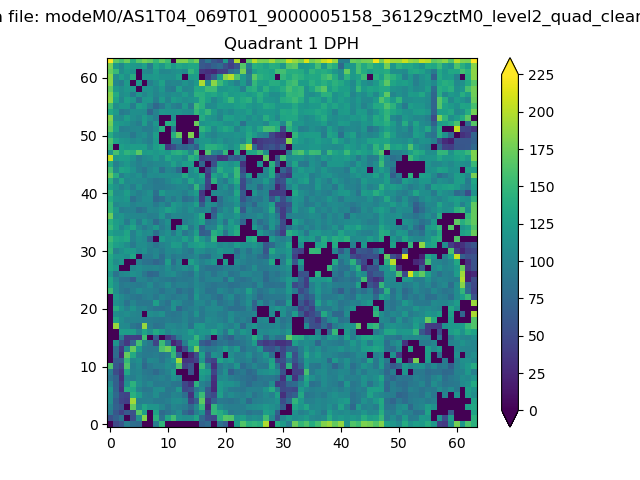 |
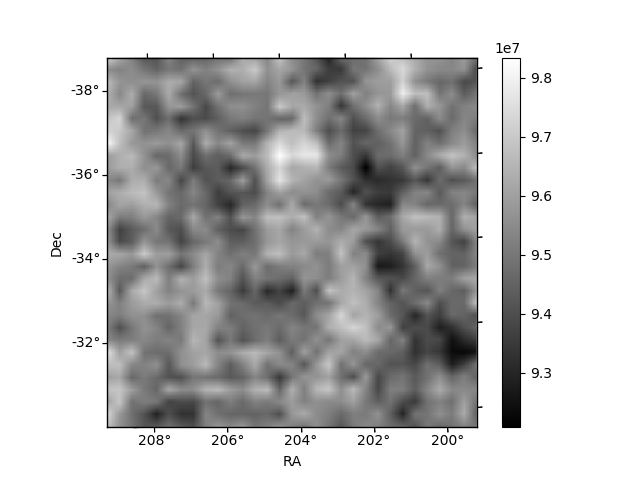
Quadrant B |
|---|---|---|---|
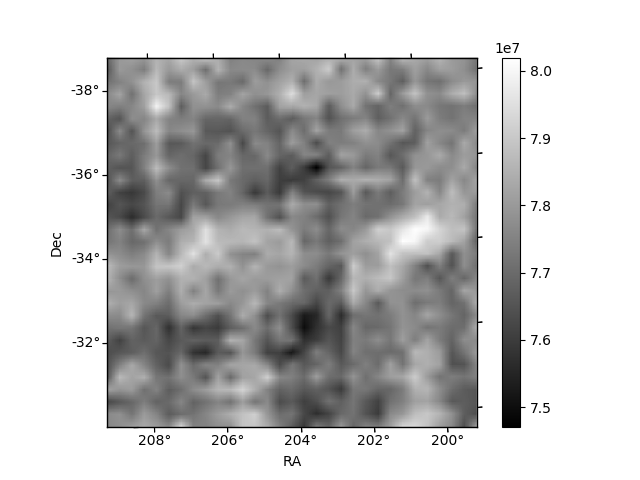
| Quadrant D | 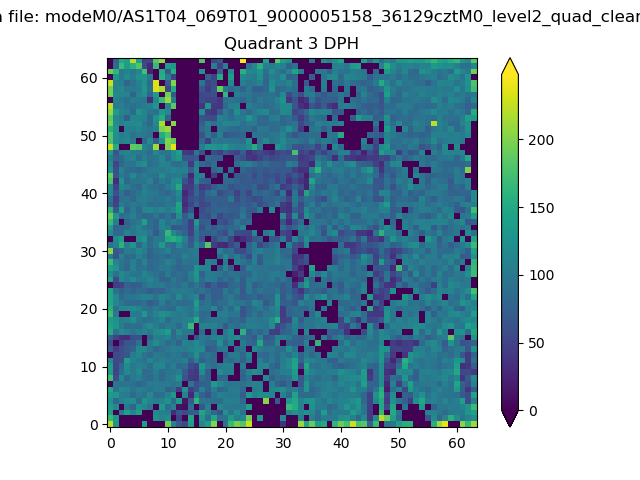 |
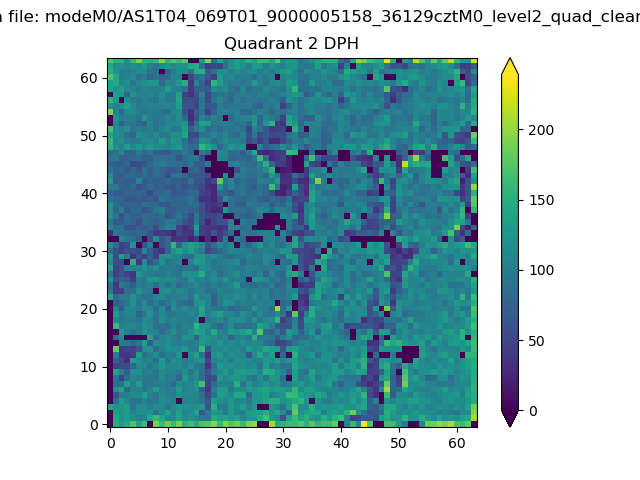 |
Quadrant C |
| Plot type | Count rate plots | Images |
|---|---|---|
| Comparison with Poisson distribution Blue bars denote a histogram of data divided into 1 sec bins. Red curve is a Poisson curve with rate = median count rate of data. |
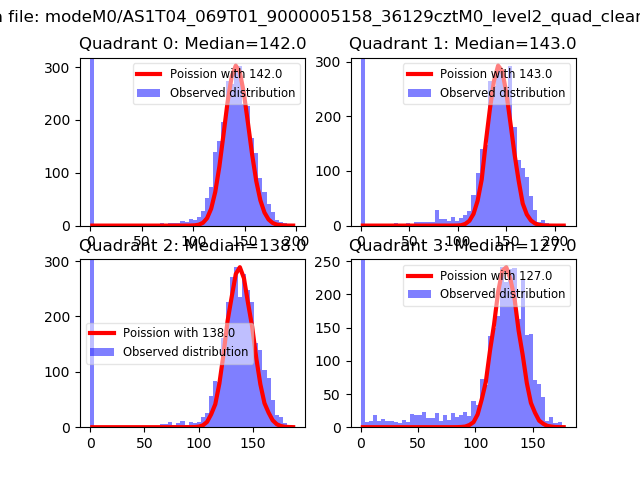 |
 |
| Quadrant-wise count rates Data is divided into 100 sec bins |
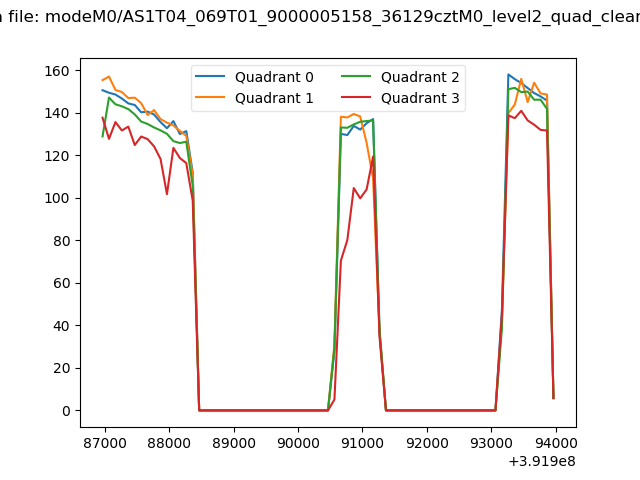 |
|
| Module-wise count rates for Quadrant A Data is divided into 100 sec bins |
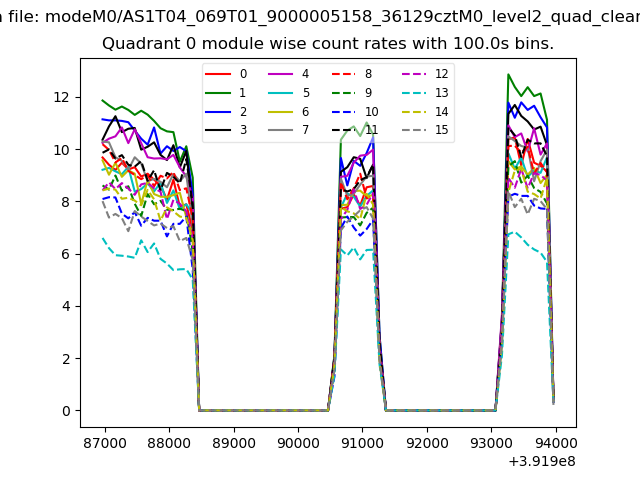 |
 |
| Module-wise count rates for Quadrant B Data is divided into 100 sec bins |
 |
 |
| Module-wise count rates for Quadrant C Data is divided into 100 sec bins |
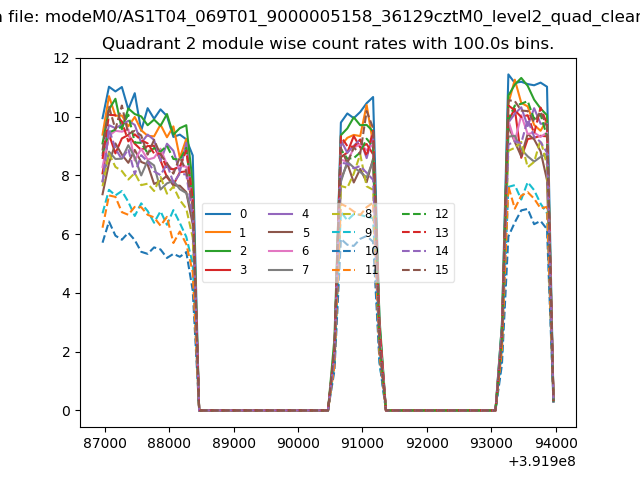 |
 |
| Module-wise count rates for Quadrant D Data is divided into 100 sec bins |
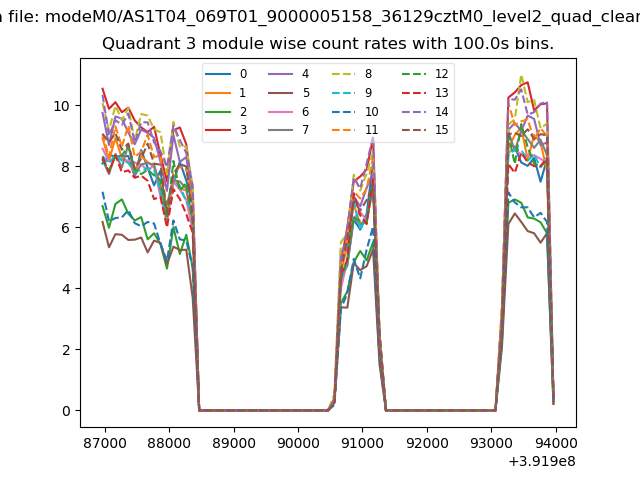 |
 |
| Parameter | Plot |
|---|---|
| CZT HV Monitor | 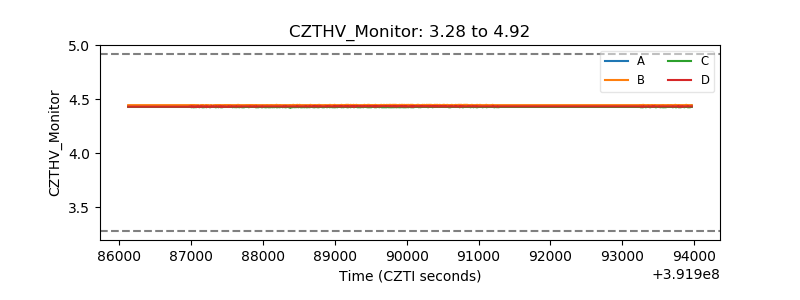 |
| D_VDD | 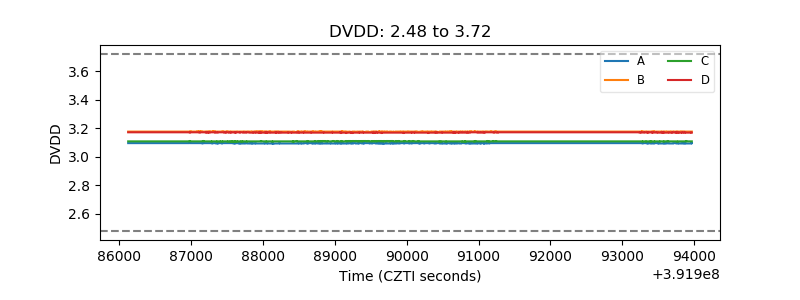 |
| Temperature 1 | 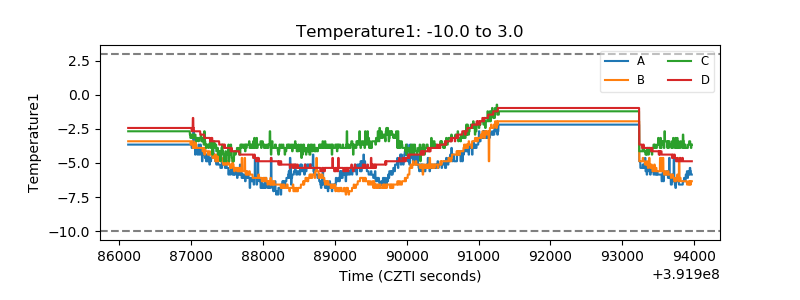 |
| Veto HV Monitor | 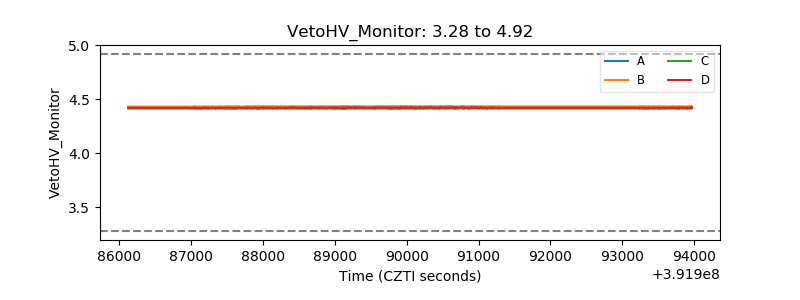 |
| Veto LLD | 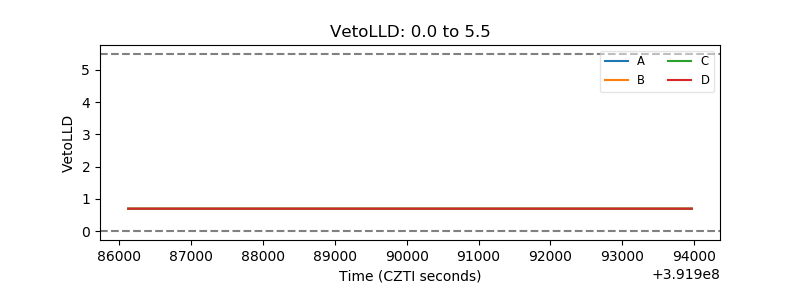 |
| Alpha Counter | 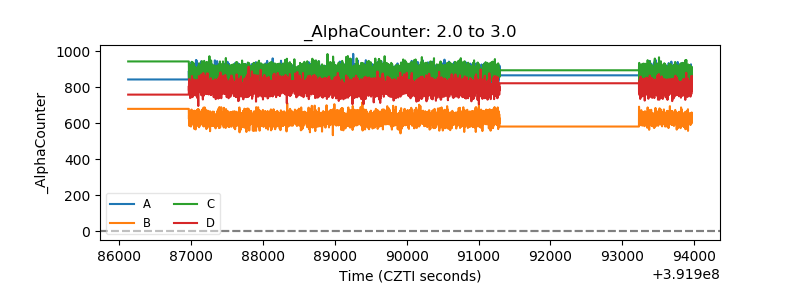 |
| _CPM_Rate | 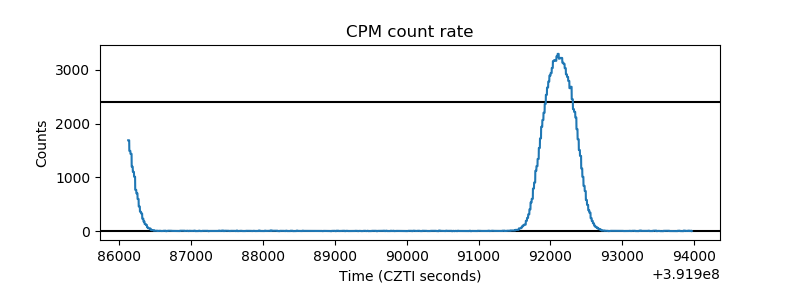 |
| CZT Counter | 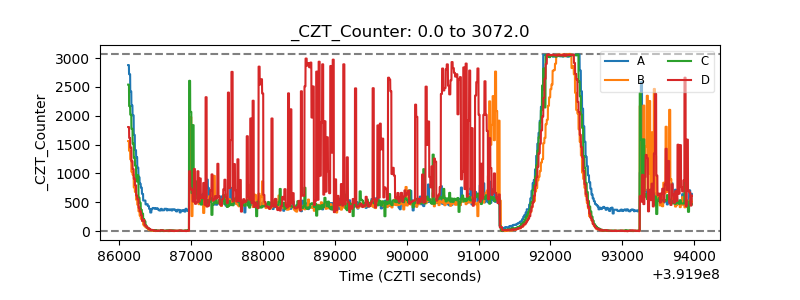 |
| +2.5 Volts monitor | 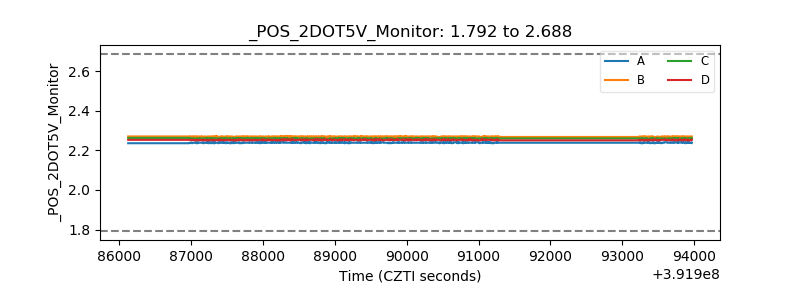 |
| +5 Volts monitor | 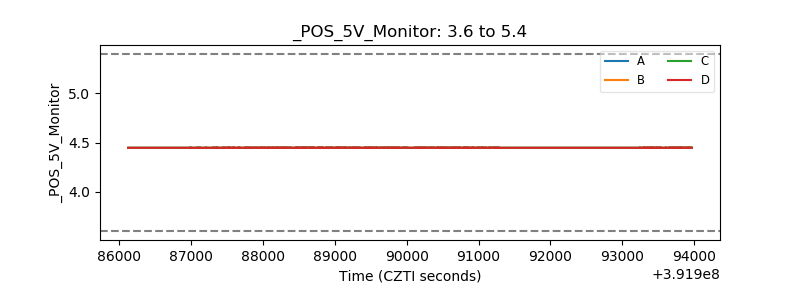 |
| _ROLL_ROT | 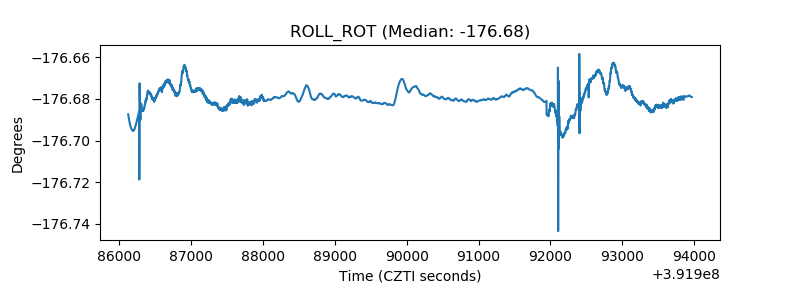 |
| _Roll_DEC | 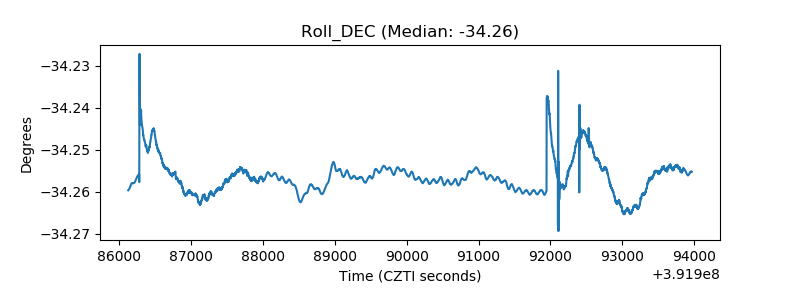 |
| _Roll_RA | 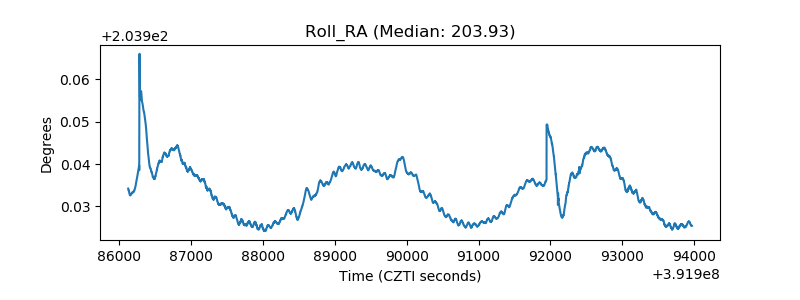 |
| Veto Counter | 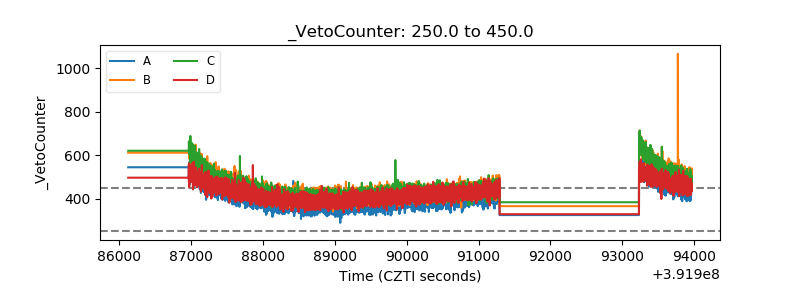 |