| Param | Original file | Final file |
|---|---|---|
| Filename | modeM0/AS1T04_069T01_9000005158_36125cztM0_level2.evt | modeM0/AS1T04_069T01_9000005158_36125cztM0_level2_quad_clean.evt |
| Size (bytes) | 475,418,880 | 70,557,120 |
| Size | 453.4 MB | 67.3 MB |
| Events in quadrant A | 2,966,250 | 459,098 |
| Events in quadrant B | 4,005,766 | 429,416 |
| Events in quadrant C | 2,814,305 | 442,666 |
| Events in quadrant D | 4,228,521 | 410,008 |
| Mode M0 | |||
|---|---|---|---|
| Quadrant | BADHDUFLAG | Total packets | Discarded packets |
| A | 0 | 12479 | 3 |
| B | 0 | 15687 | 2 |
| C | 0 | 11982 | 2 |
| D | 0 | 16324 | 2 |
| Mode M9 | |||
|---|---|---|---|
| Quadrant | BADHDUFLAG | Total packets | Discarded packets |
| A | 0 | 19 | 0 |
| B | 0 | 19 | 0 |
| C | 0 | 19 | 0 |
| D | 0 | 20 | 0 |
| Mode SS | |||
|---|---|---|---|
| Quadrant | BADHDUFLAG | Total packets | Discarded packets |
| A | 0 | 114 | 0 |
| B | 0 | 114 | 0 |
| C | 0 | 114 | 0 |
| D | 0 | 114 | 0 |
| Quadrant | Total seconds | Saturated seconds | Saturation percentage |
|---|---|---|---|
| A | 5648 | 59 | 1.044618% |
| B | 5648 | 412 | 7.294618% |
| C | 5648 | 26 | 0.460340% |
| D | 5648 | 396 | 7.011331% |
Noise dominated data is calculated using 1-second bins in cleaned event files. If a bin has >2000 counts, and if more than 50% of those come from <1% of pixels, then it is considered to be noise-dominated and hence unusable.
| Quadrant | # 1 sec bins | Bins with >0 counts | Bins with >2000 counts | High rate bins dominated by noise | Noise dominated (total time) | Noise dominated (detector-on time) | Marked lightcurve |
|---|---|---|---|---|---|---|---|
| A | 7232 | 5649 | 34 | 34 | 0.47% | 0.60% | 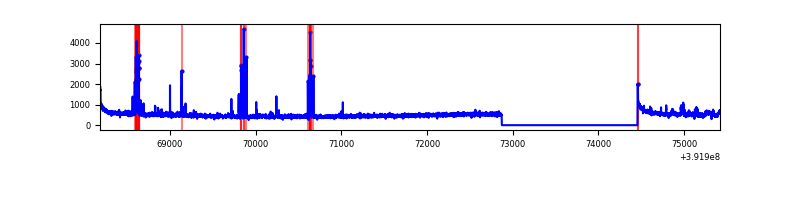 |
| B | 7232 | 5649 | 303 | 303 | 4.19% | 5.36% | 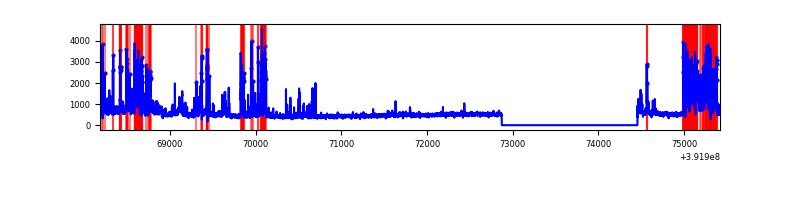 |
| C | 7232 | 5649 | 21 | 21 | 0.29% | 0.37% | 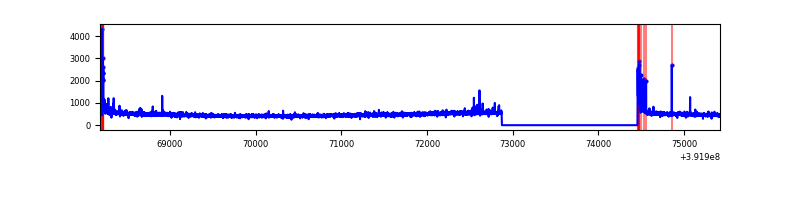 |
| D | 7232 | 5649 | 345 | 345 | 4.77% | 6.11% | 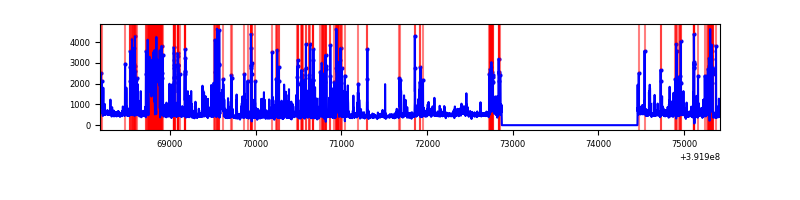 |
Top three noisy pixels from each quadrant. If the there are fewer than three noisy pixels in the level2.evt file, extra rows are filled as -1
| Pixel properties | Quadrant properties | ||||||
|---|---|---|---|---|---|---|---|
| Quadrant | DetID | PixID | Counts | Sigma | Mean | Median | Sigma |
| A | 10 | 83 | 190571 | 1436.32 | 648 | 635 | 132.2 |
| A | 9 | 143 | 184337 | 1389.18 | 648 | 635 | 132.2 |
| A | 15 | 223 | 46339 | 345.62 | 648 | 635 | 132.2 |
| B | 5 | 172 | 1216084 | 10040.51 | 622 | 605 | 121.1 |
| B | 0 | 190 | 117346 | 964.34 | 622 | 605 | 121.1 |
| B | 5 | 255 | 110015 | 903.79 | 622 | 605 | 121.1 |
| C | 15 | 214 | 238262 | 1639.63 | 619 | 625 | 144.9 |
| C | 0 | 10 | 128683 | 883.57 | 619 | 625 | 144.9 |
| C | 0 | 207 | 13993 | 92.24 | 619 | 625 | 144.9 |
| D | 1 | 52 | 568776 | 3809.13 | 603 | 584 | 149.2 |
| D | 2 | 249 | 418171 | 2799.49 | 603 | 584 | 149.2 |
| D | 12 | 17 | 318354 | 2130.32 | 603 | 584 | 149.2 |
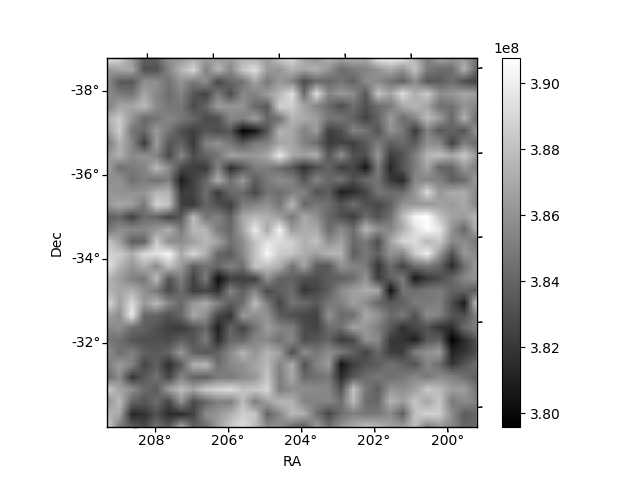
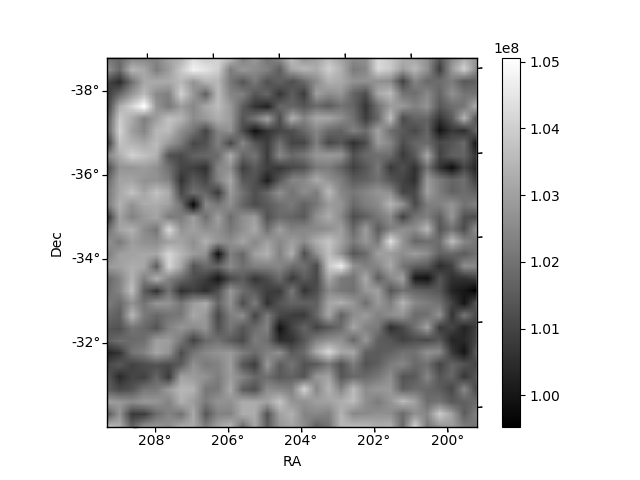
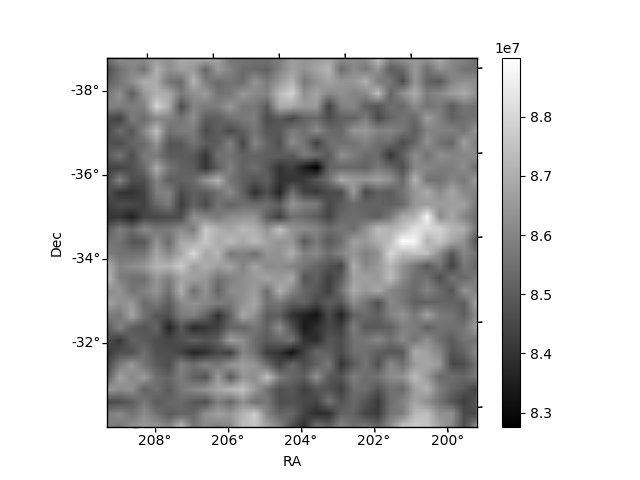
Histogram calculated using DETX and DETY for each event in the final _common_clean file
| Quadrant A | 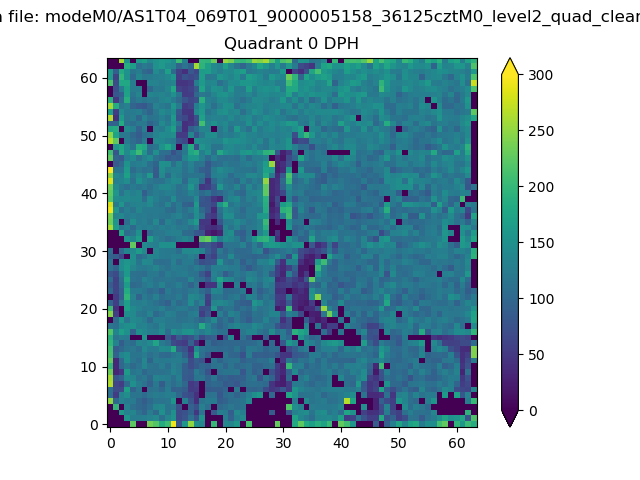 |
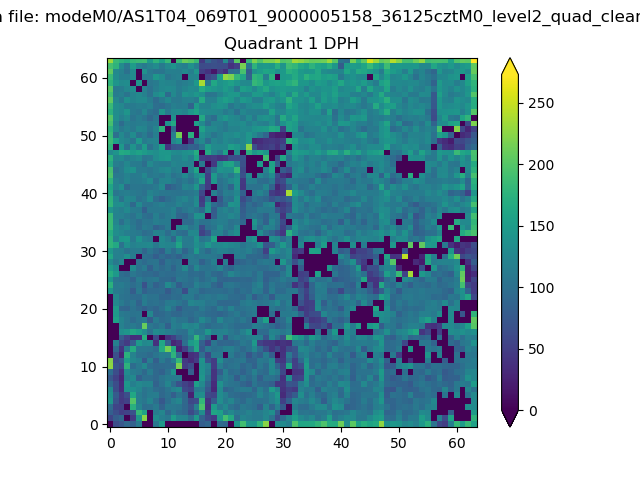 |
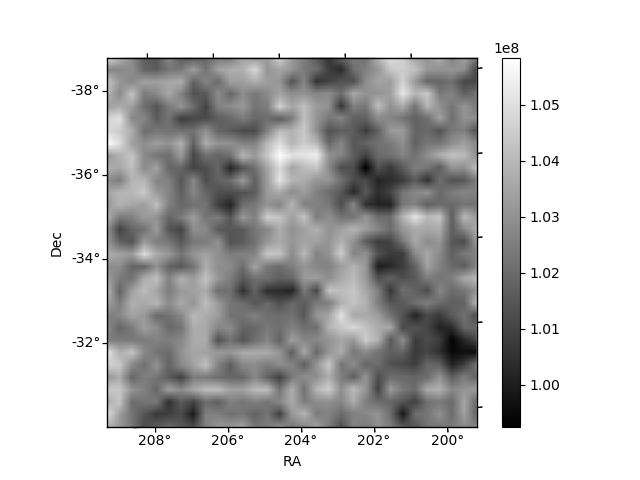
Quadrant B |
|---|---|---|---|
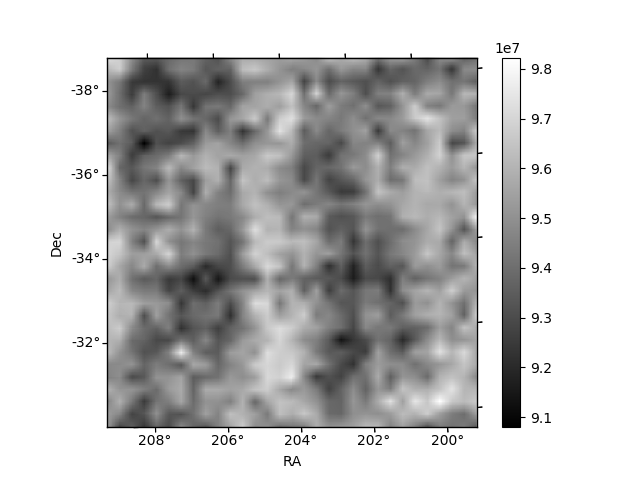
| Quadrant D | 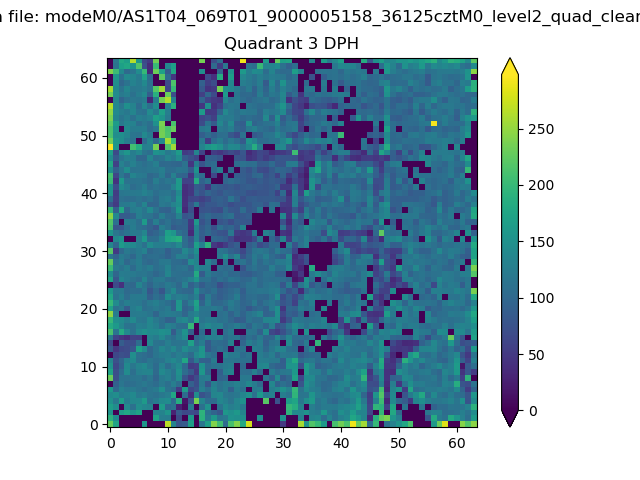 |
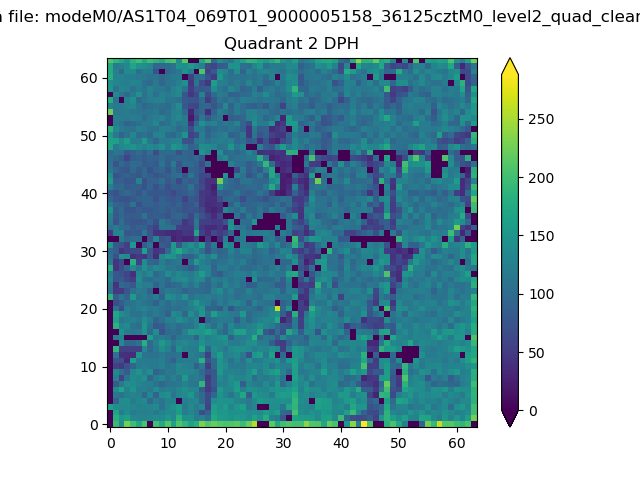 |
Quadrant C |
| Plot type | Count rate plots | Images |
|---|---|---|
| Comparison with Poisson distribution Blue bars denote a histogram of data divided into 1 sec bins. Red curve is a Poisson curve with rate = median count rate of data. |
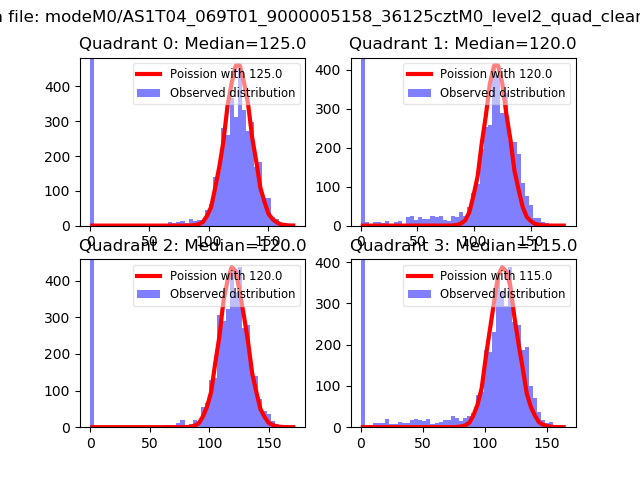 |
 |
| Quadrant-wise count rates Data is divided into 100 sec bins |
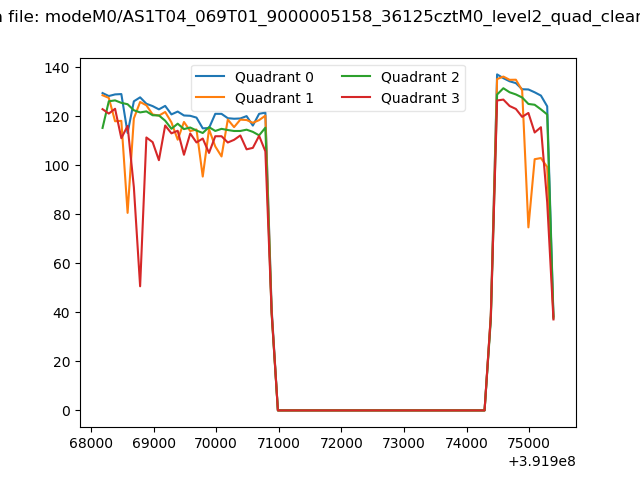 |
|
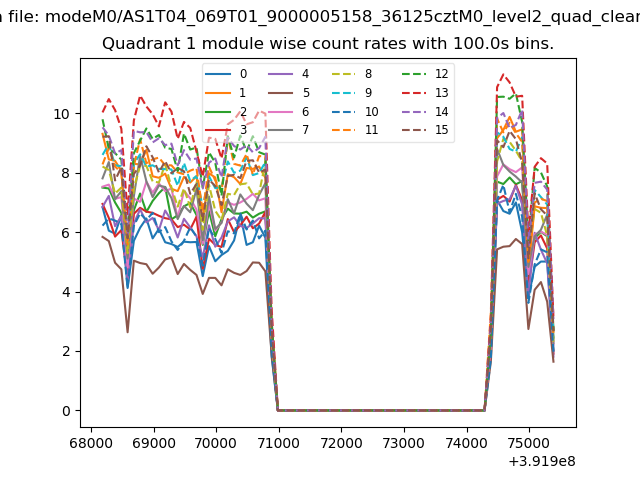
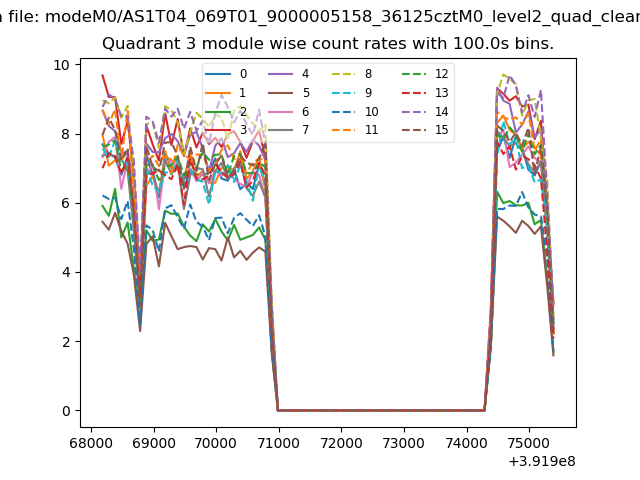
| Module-wise count rates for Quadrant A Data is divided into 100 sec bins |
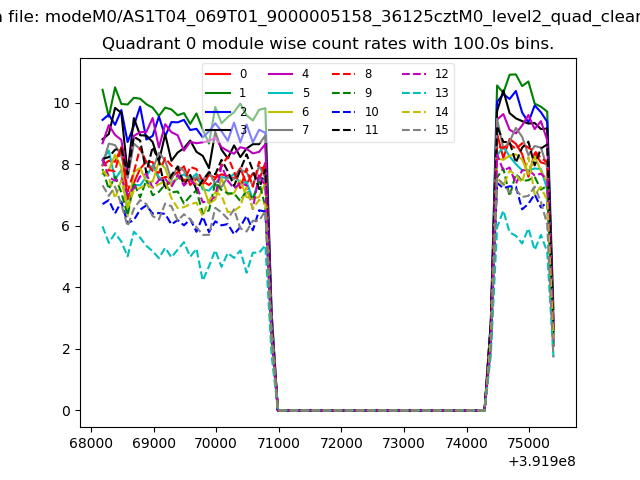 |
 |
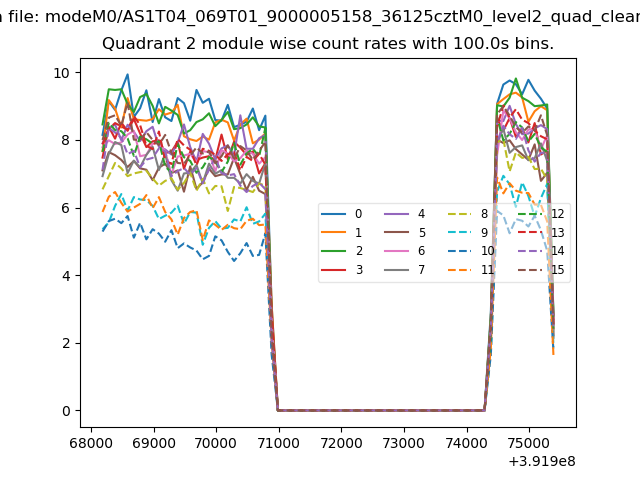
| Module-wise count rates for Quadrant B Data is divided into 100 sec bins |
 |
 |
| Module-wise count rates for Quadrant C Data is divided into 100 sec bins |
 |
 |
| Module-wise count rates for Quadrant D Data is divided into 100 sec bins |
 |
 |
| Parameter | Plot |
|---|---|
| CZT HV Monitor | 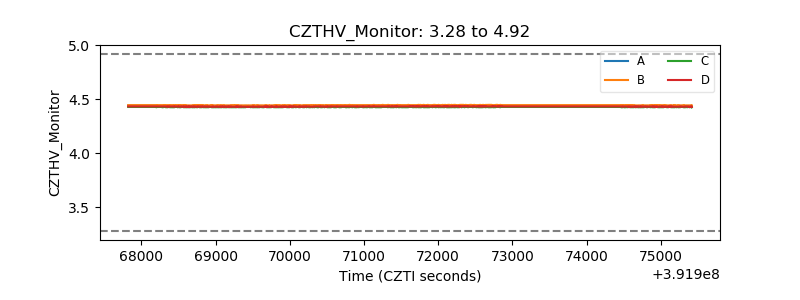 |
| D_VDD | 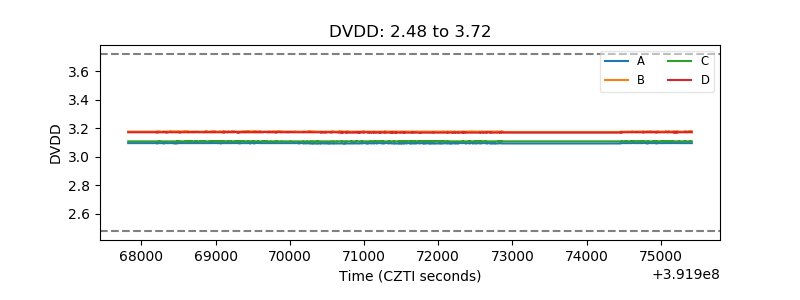 |
| Temperature 1 | 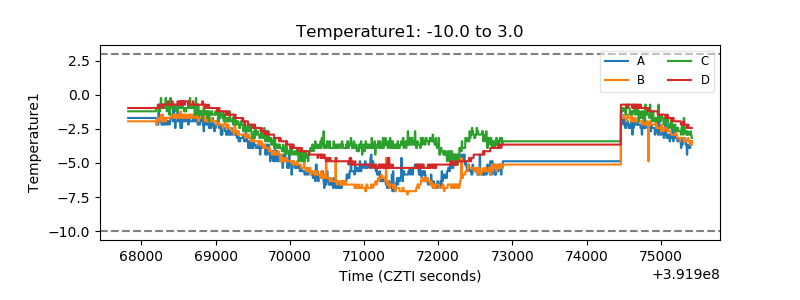 |
| Veto HV Monitor | 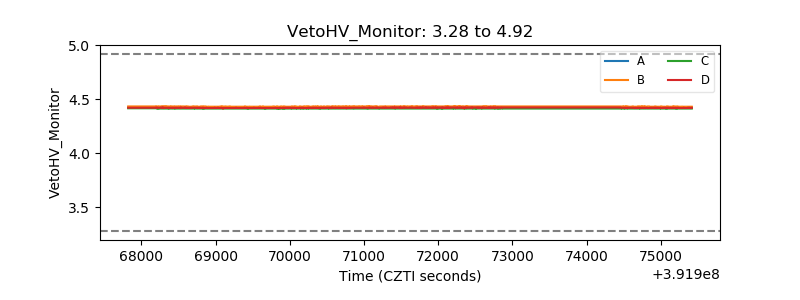 |
| Veto LLD | 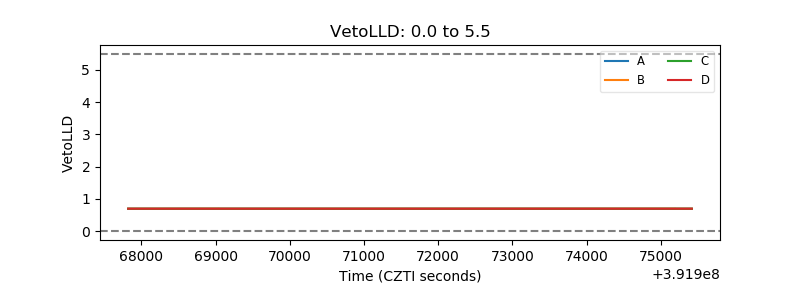 |
| Alpha Counter | 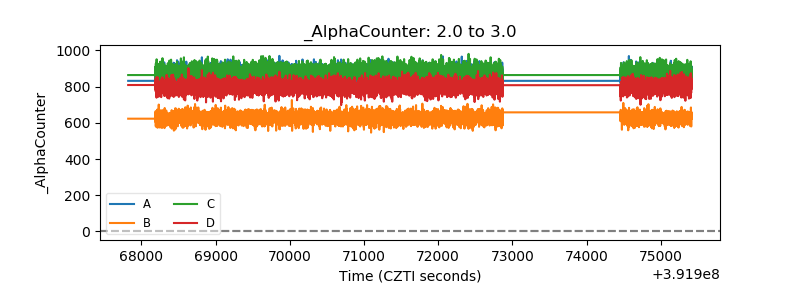 |
| _CPM_Rate | 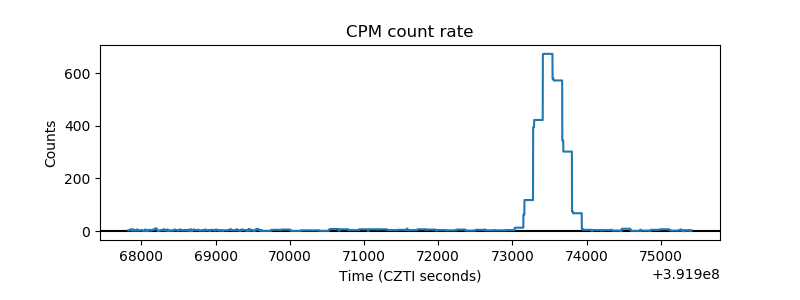 |
| CZT Counter | 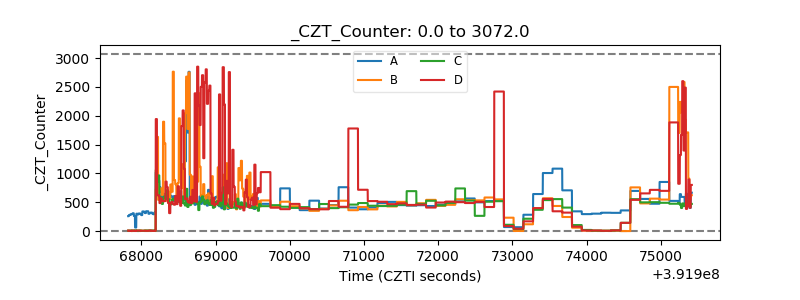 |
| +2.5 Volts monitor | 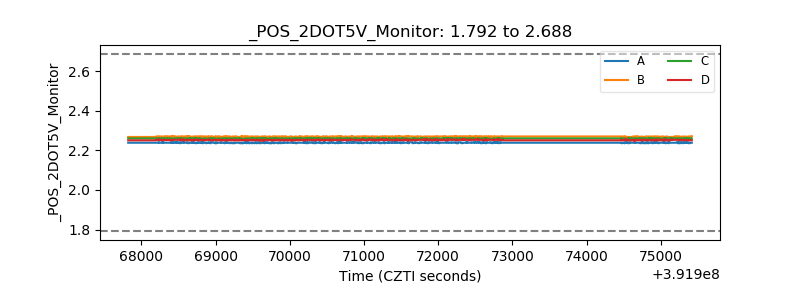 |
| +5 Volts monitor | 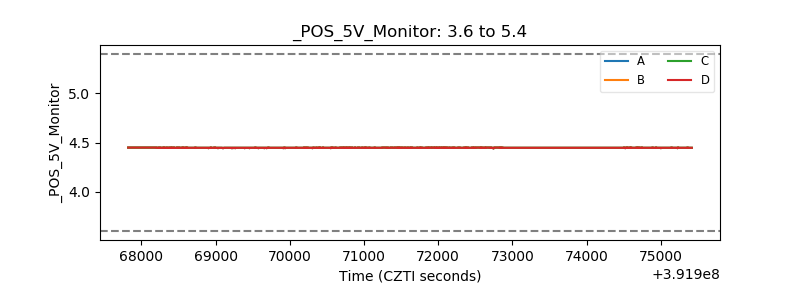 |
| _ROLL_ROT | 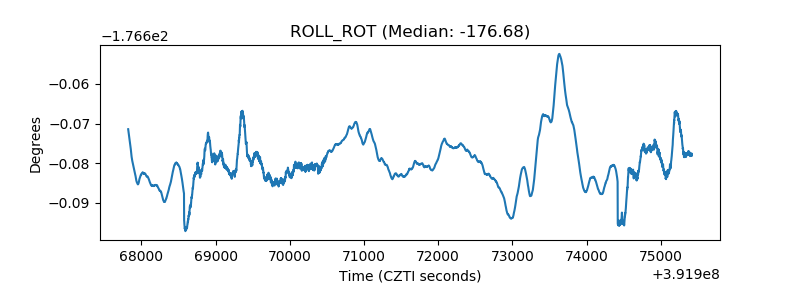 |
| _Roll_DEC | 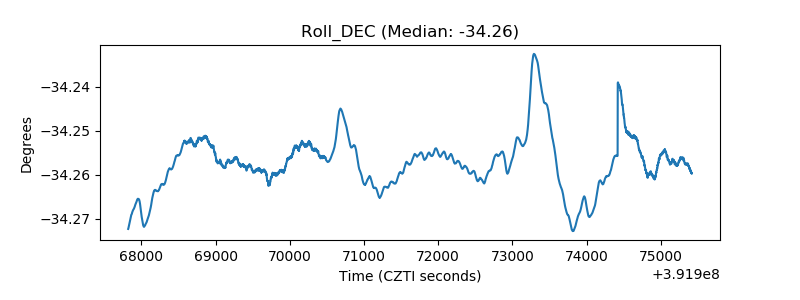 |
| _Roll_RA | 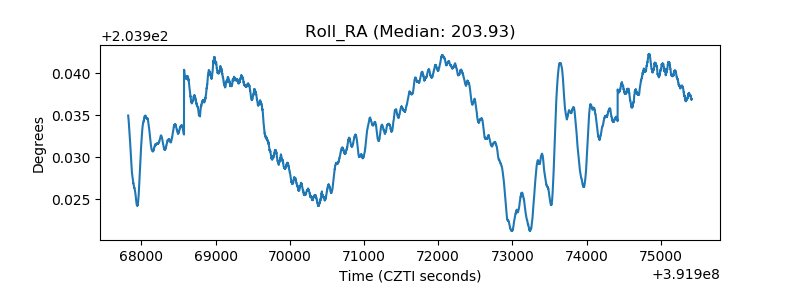 |
| Veto Counter | 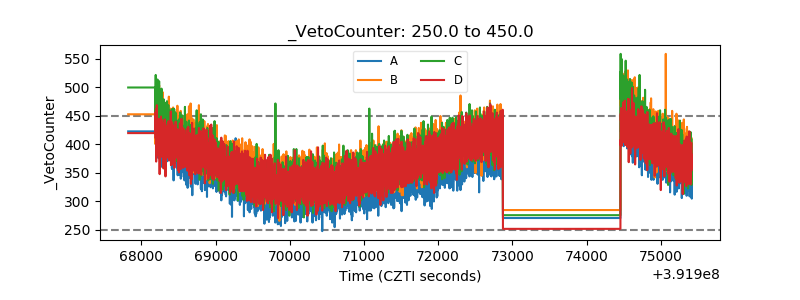 |