| Param | Original file | Final file |
|---|---|---|
| Filename | modeM0/AS1T04_069T01_9000005158_36097cztM0_level2.evt | modeM0/AS1T04_069T01_9000005158_36097cztM0_level2_quad_clean.evt |
| Size (bytes) | 393,341,760 | 64,722,240 |
| Size | 375.1 MB | 61.7 MB |
| Events in quadrant A | 2,579,385 | 407,457 |
| Events in quadrant B | 2,756,244 | 406,670 |
| Events in quadrant C | 2,764,636 | 390,414 |
| Events in quadrant D | 3,445,279 | 377,650 |
| Mode M0 | |||
|---|---|---|---|
| Quadrant | BADHDUFLAG | Total packets | Discarded packets |
| A | 0 | 11207 | 3 |
| B | 0 | 11597 | 2 |
| C | 0 | 11586 | 2 |
| D | 0 | 13872 | 2 |
| Mode M9 | |||
|---|---|---|---|
| Quadrant | BADHDUFLAG | Total packets | Discarded packets |
| A | 0 | 26 | 0 |
| B | 0 | 26 | 0 |
| C | 0 | 26 | 0 |
| D | 0 | 27 | 0 |
| Mode SS | |||
|---|---|---|---|
| Quadrant | BADHDUFLAG | Total packets | Discarded packets |
| A | 0 | 110 | 0 |
| B | 0 | 110 | 0 |
| C | 0 | 110 | 0 |
| D | 0 | 110 | 0 |
| Quadrant | Total seconds | Saturated seconds | Saturation percentage |
|---|---|---|---|
| A | 5390 | 8 | 0.148423% |
| B | 5390 | 35 | 0.649351% |
| C | 5390 | 55 | 1.020408% |
| D | 5390 | 165 | 3.061224% |
Noise dominated data is calculated using 1-second bins in cleaned event files. If a bin has >2000 counts, and if more than 50% of those come from <1% of pixels, then it is considered to be noise-dominated and hence unusable.
| Quadrant | # 1 sec bins | Bins with >0 counts | Bins with >2000 counts | High rate bins dominated by noise | Noise dominated (total time) | Noise dominated (detector-on time) | Marked lightcurve |
|---|---|---|---|---|---|---|---|
| A | 7093 | 5391 | 0 | 0 | 0.00% | 0.00% | 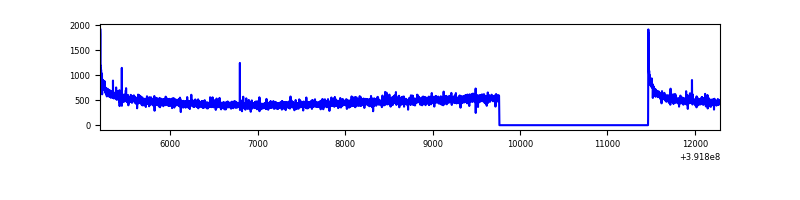 |
| B | 7093 | 5391 | 18 | 18 | 0.25% | 0.33% | 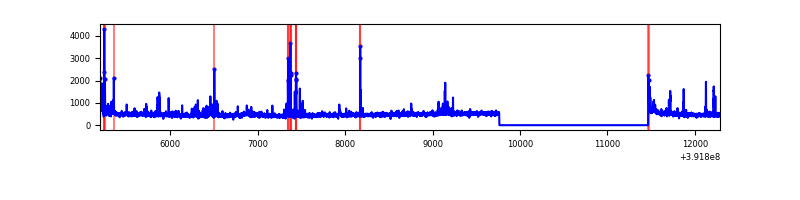 |
| C | 7093 | 5391 | 46 | 46 | 0.65% | 0.85% | 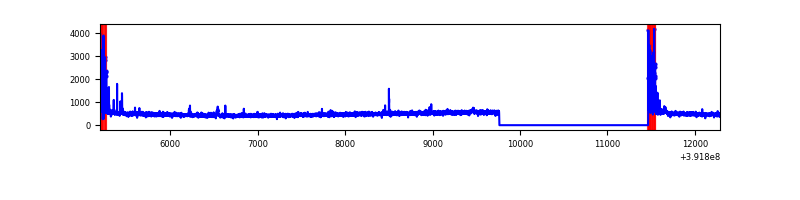 |
| D | 7092 | 5390 | 127 | 127 | 1.79% | 2.36% | 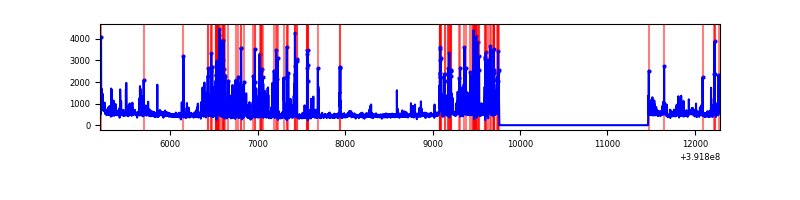 |
Top three noisy pixels from each quadrant. If the there are fewer than three noisy pixels in the level2.evt file, extra rows are filled as -1
| Pixel properties | Quadrant properties | ||||||
|---|---|---|---|---|---|---|---|
| Quadrant | DetID | PixID | Counts | Sigma | Mean | Median | Sigma |
| A | 10 | 83 | 182097 | 1442.64 | 616 | 604 | 125.8 |
| A | 13 | 6 | 12721 | 96.32 | 616 | 604 | 125.8 |
| A | 3 | 137 | 6537 | 47.16 | 616 | 604 | 125.8 |
| B | 5 | 172 | 126498 | 1059.37 | 612 | 595 | 118.8 |
| B | 0 | 214 | 41677 | 345.67 | 612 | 595 | 118.8 |
| B | 0 | 190 | 37792 | 312.98 | 612 | 595 | 118.8 |
| C | 15 | 214 | 242351 | 1747.4 | 590 | 591 | 138.4 |
| C | 0 | 10 | 206631 | 1489.22 | 590 | 591 | 138.4 |
| C | 15 | 159 | 8020 | 53.7 | 590 | 591 | 138.4 |
| D | 12 | 6 | 548345 | 3783.27 | 587 | 571 | 144.8 |
| D | 1 | 52 | 193403 | 1331.82 | 587 | 571 | 144.8 |
| D | 13 | 249 | 142223 | 978.34 | 587 | 571 | 144.8 |
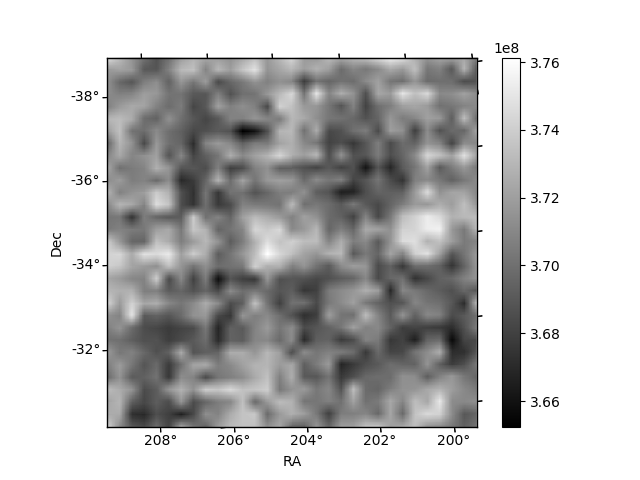
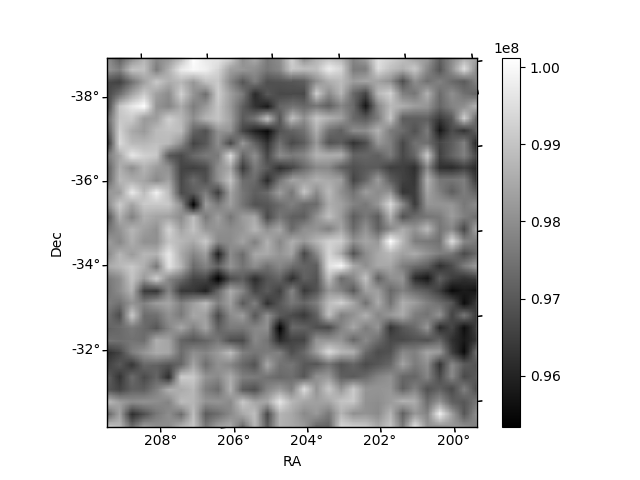
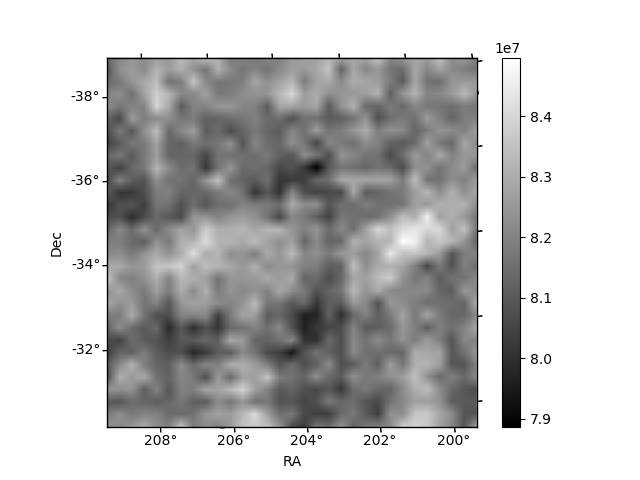
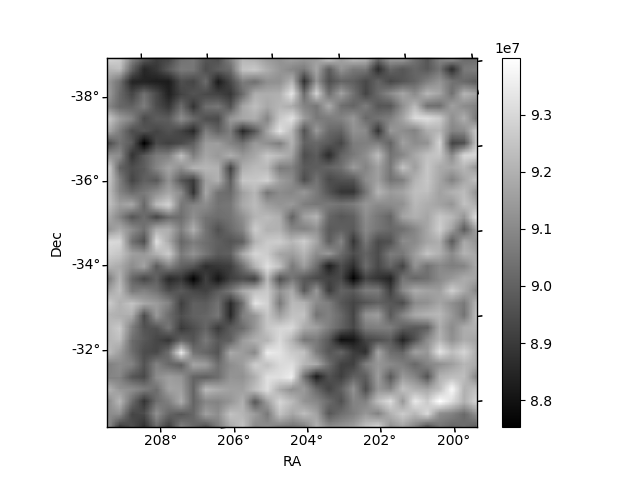
Histogram calculated using DETX and DETY for each event in the final _common_clean file
| Quadrant A | 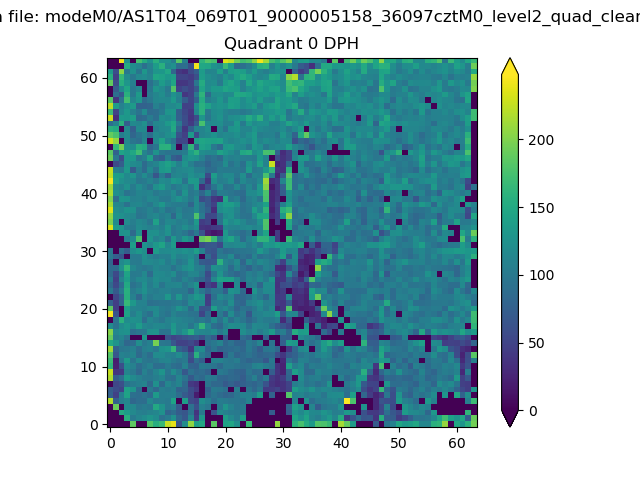 |
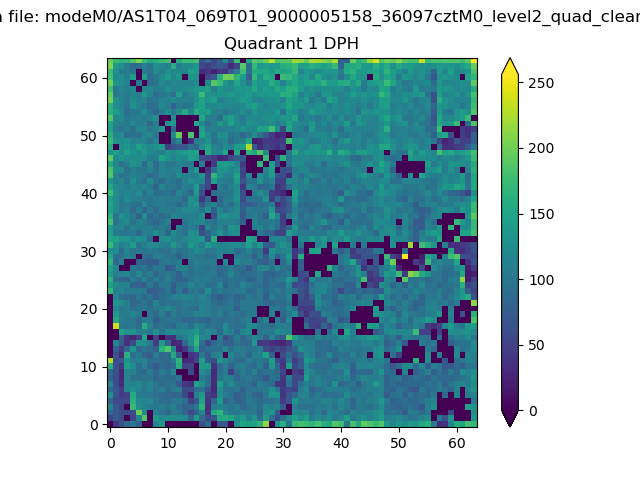 |
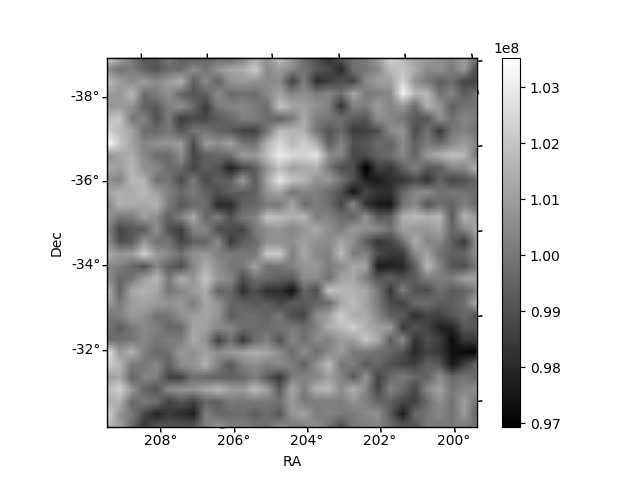
Quadrant B |
|---|---|---|---|
| Quadrant D | 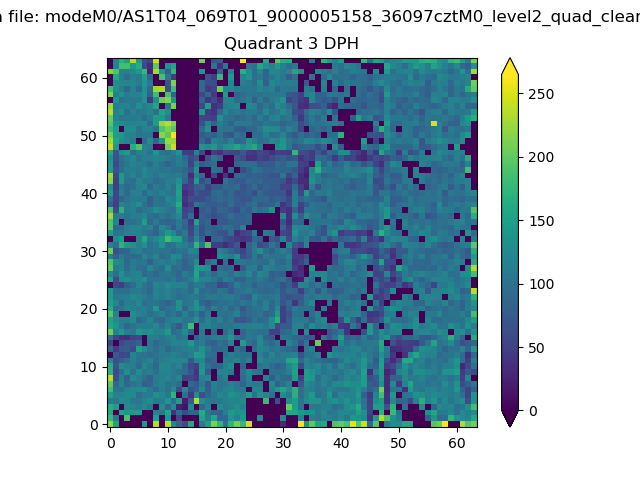 |
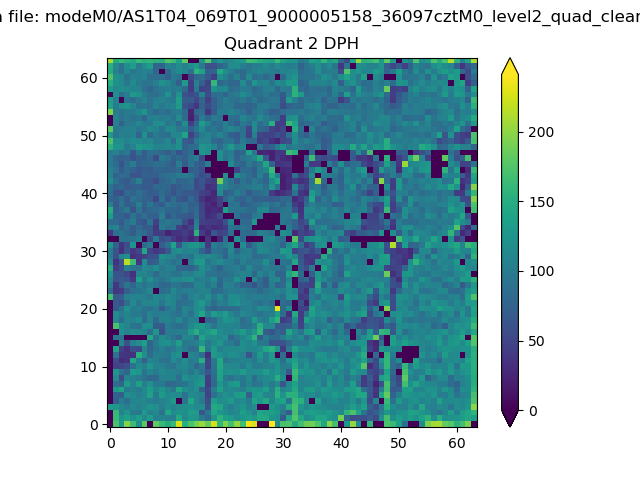 |
Quadrant C |
| Plot type | Count rate plots | Images |
|---|---|---|
| Comparison with Poisson distribution Blue bars denote a histogram of data divided into 1 sec bins. Red curve is a Poisson curve with rate = median count rate of data. |
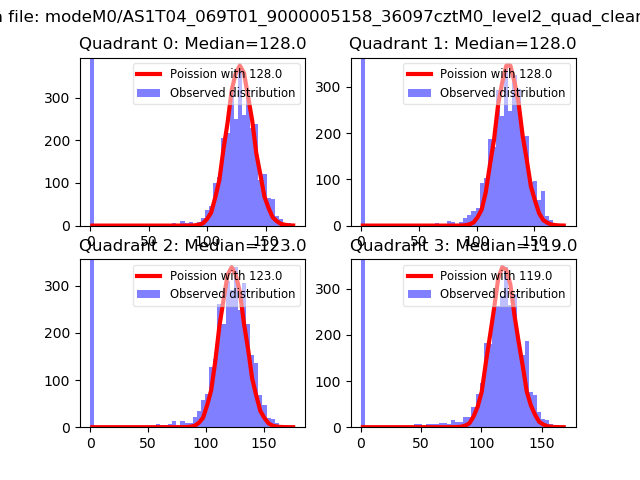 |
 |
| Quadrant-wise count rates Data is divided into 100 sec bins |
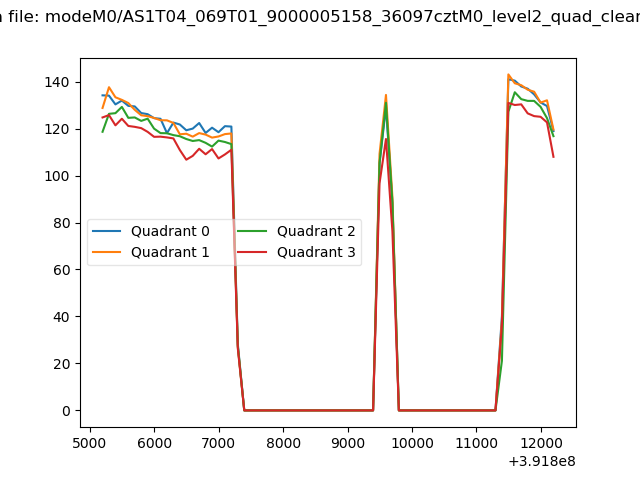 |
|
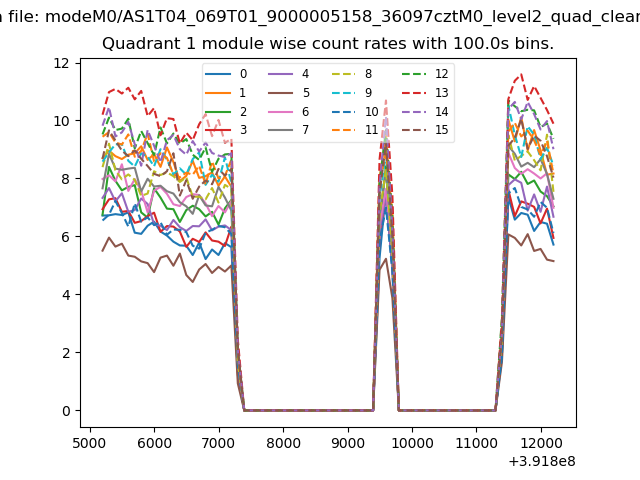
| Module-wise count rates for Quadrant A Data is divided into 100 sec bins |
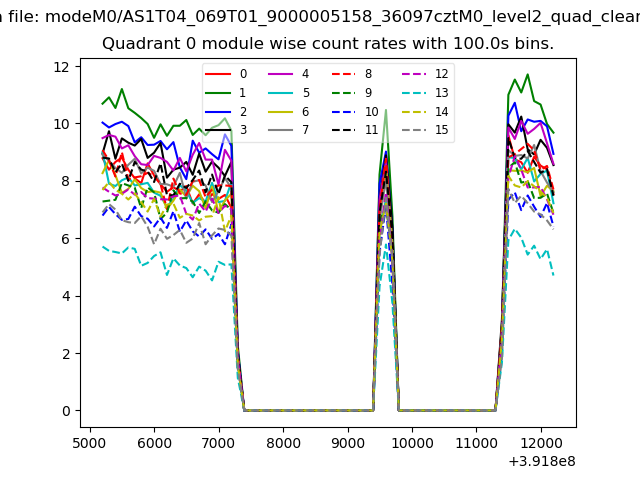 |
 |
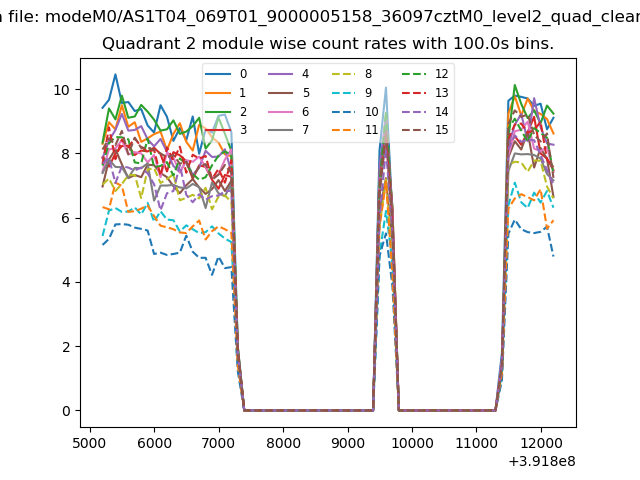
| Module-wise count rates for Quadrant B Data is divided into 100 sec bins |
 |
 |
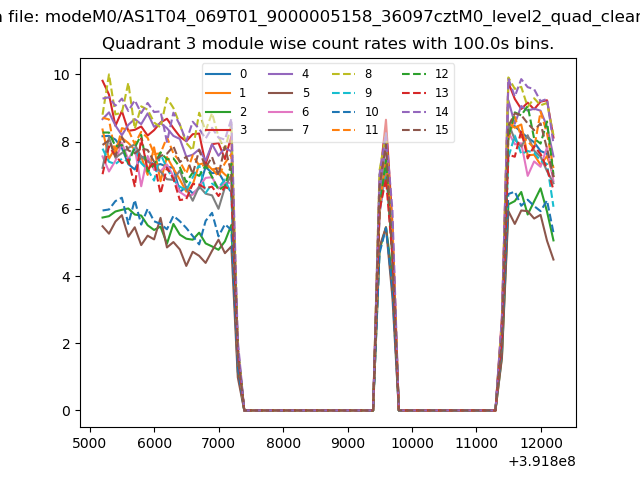
| Module-wise count rates for Quadrant C Data is divided into 100 sec bins |
 |
 |
| Module-wise count rates for Quadrant D Data is divided into 100 sec bins |
 |
 |
| Parameter | Plot |
|---|---|
| CZT HV Monitor | 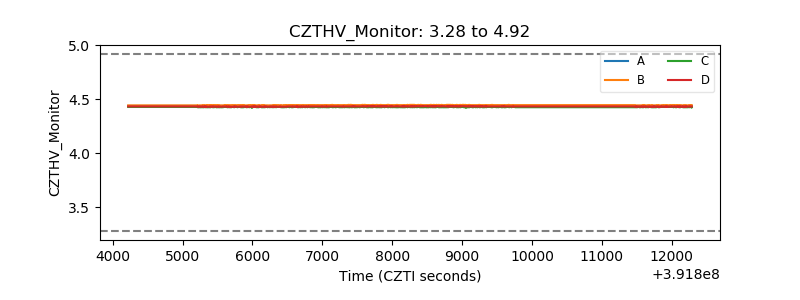 |
| D_VDD | 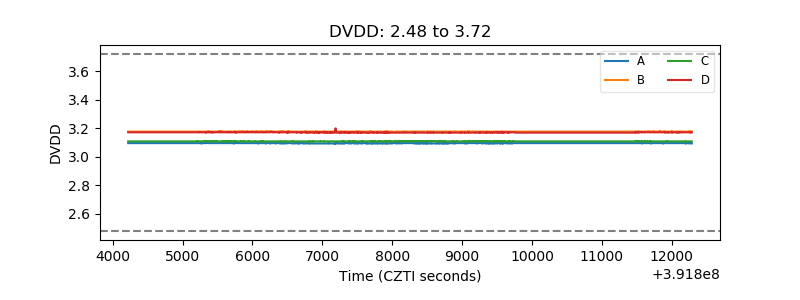 |
| Temperature 1 | 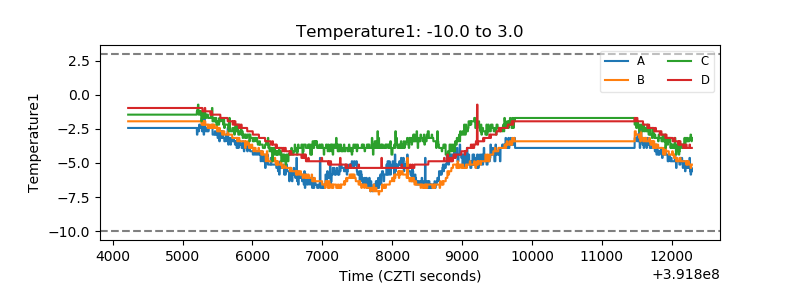 |
| Veto HV Monitor | 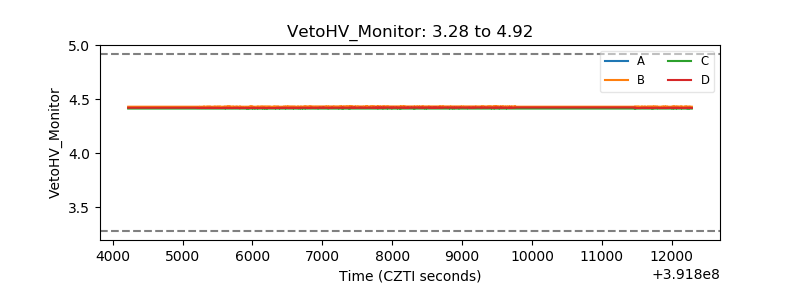 |
| Veto LLD | 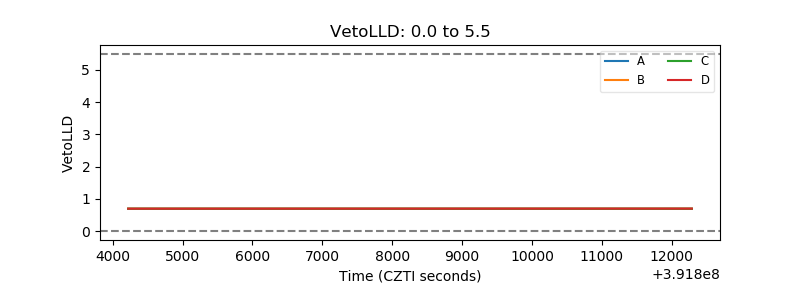 |
| Alpha Counter | 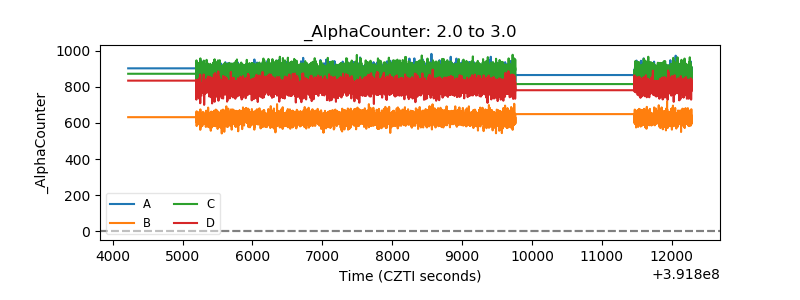 |
| _CPM_Rate | 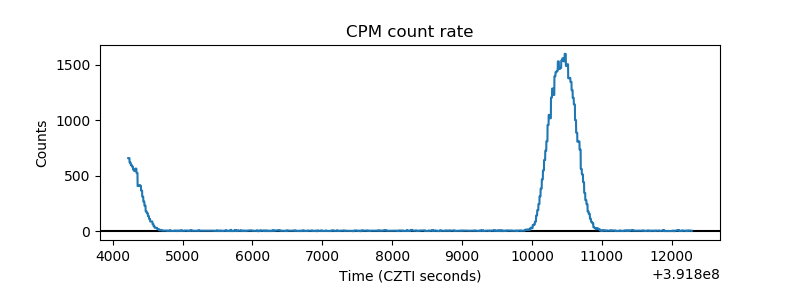 |
| CZT Counter | 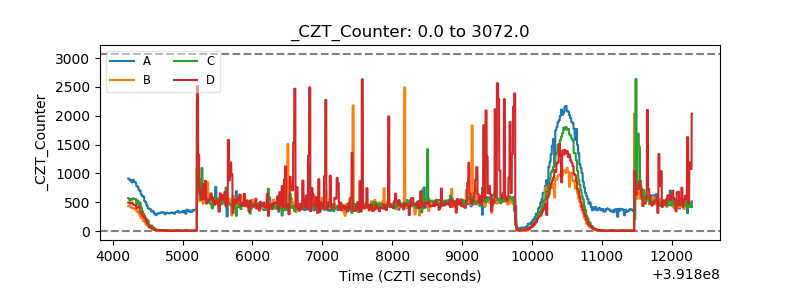 |
| +2.5 Volts monitor | 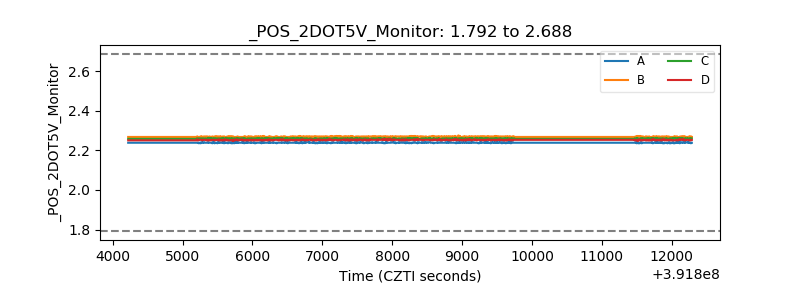 |
| +5 Volts monitor | 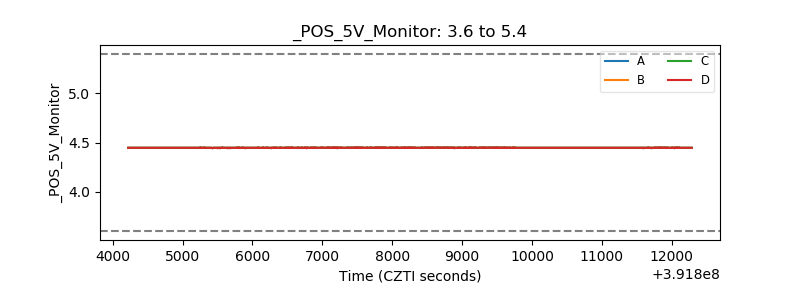 |
| _ROLL_ROT | 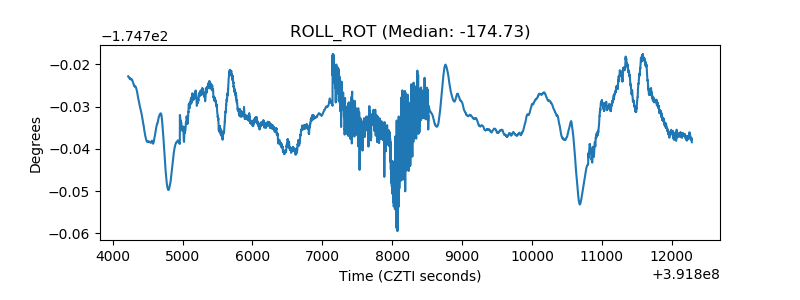 |
| _Roll_DEC | 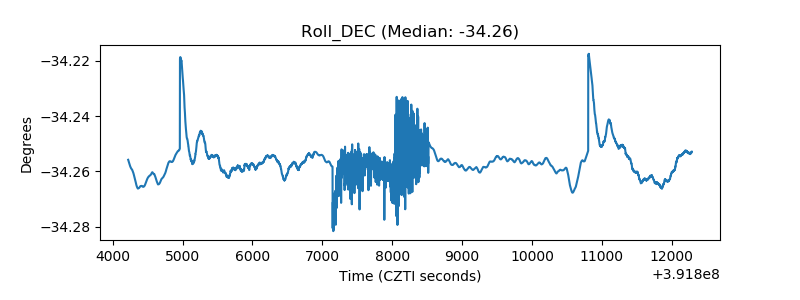 |
| _Roll_RA | 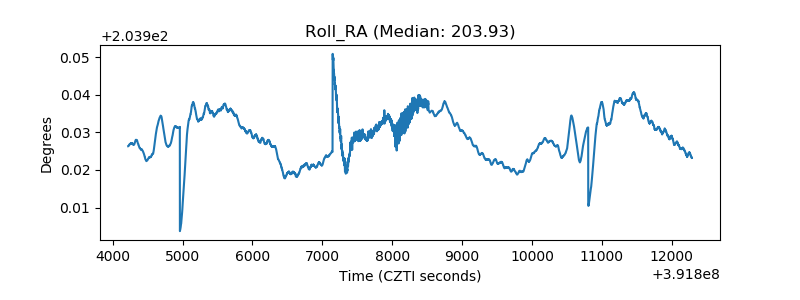 |
| Veto Counter | 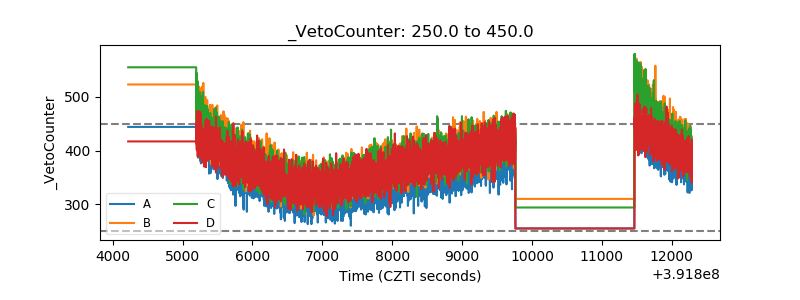 |