| Param | Original file | Final file |
|---|---|---|
| Filename | modeM0/AS1T04_069T01_9000005158_36089cztM0_level2.evt | modeM0/AS1T04_069T01_9000005158_36089cztM0_level2_quad_clean.evt |
| Size (bytes) | 443,059,200 | 50,607,360 |
| Size | 422.5 MB | 48.3 MB |
| Events in quadrant A | 2,492,435 | 303,803 |
| Events in quadrant B | 2,982,140 | 307,876 |
| Events in quadrant C | 3,062,944 | 301,141 |
| Events in quadrant D | 4,539,887 | 267,145 |
| Mode M0 | |||
|---|---|---|---|
| Quadrant | BADHDUFLAG | Total packets | Discarded packets |
| A | 0 | 10358 | 3 |
| B | 0 | 11810 | 2 |
| C | 0 | 12020 | 2 |
| D | 0 | 16846 | 2 |
| Mode M9 | |||
|---|---|---|---|
| Quadrant | BADHDUFLAG | Total packets | Discarded packets |
| A | 0 | 32 | 0 |
| B | 0 | 32 | 0 |
| C | 0 | 32 | 0 |
| D | 0 | 33 | 0 |
| Mode SS | |||
|---|---|---|---|
| Quadrant | BADHDUFLAG | Total packets | Discarded packets |
| A | 0 | 102 | 0 |
| B | 0 | 102 | 0 |
| C | 0 | 102 | 0 |
| D | 0 | 102 | 0 |
| Quadrant | Total seconds | Saturated seconds | Saturation percentage |
|---|---|---|---|
| A | 5019 | 5 | 0.099621% |
| B | 5019 | 142 | 2.829249% |
| C | 5019 | 104 | 2.072126% |
| D | 5019 | 371 | 7.391911% |
Noise dominated data is calculated using 1-second bins in cleaned event files. If a bin has >2000 counts, and if more than 50% of those come from <1% of pixels, then it is considered to be noise-dominated and hence unusable.
| Quadrant | # 1 sec bins | Bins with >0 counts | Bins with >2000 counts | High rate bins dominated by noise | Noise dominated (total time) | Noise dominated (detector-on time) | Marked lightcurve |
|---|---|---|---|---|---|---|---|
| A | 7113 | 5020 | 0 | 0 | 0.00% | 0.00% | 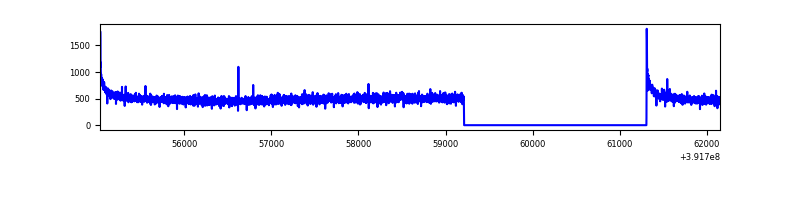 |
| B | 7113 | 5020 | 102 | 102 | 1.43% | 2.03% | 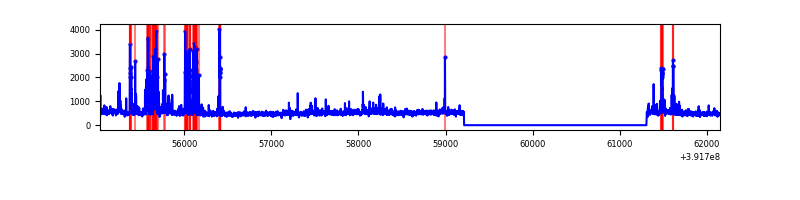 |
| C | 7113 | 5020 | 82 | 82 | 1.15% | 1.63% | 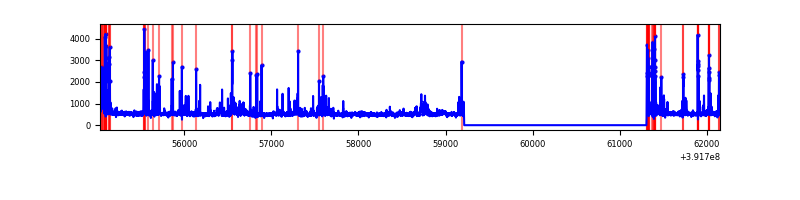 |
| D | 7113 | 5020 | 350 | 350 | 4.92% | 6.97% | 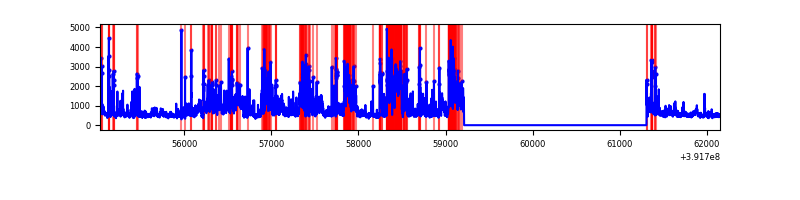 |
Top three noisy pixels from each quadrant. If the there are fewer than three noisy pixels in the level2.evt file, extra rows are filled as -1
| Pixel properties | Quadrant properties | ||||||
|---|---|---|---|---|---|---|---|
| Quadrant | DetID | PixID | Counts | Sigma | Mean | Median | Sigma |
| A | 10 | 83 | 166537 | 1375.44 | 599 | 589 | 120.7 |
| A | 13 | 6 | 6632 | 50.09 | 599 | 589 | 120.7 |
| A | 13 | 254 | 6441 | 48.5 | 599 | 589 | 120.7 |
| B | 5 | 172 | 450377 | 3979.45 | 591 | 576 | 113.0 |
| B | 0 | 190 | 91368 | 803.25 | 591 | 576 | 113.0 |
| B | 0 | 229 | 44522 | 388.8 | 591 | 576 | 113.0 |
| C | 0 | 207 | 330048 | 2454.91 | 580 | 584 | 134.2 |
| C | 0 | 10 | 213733 | 1588.22 | 580 | 584 | 134.2 |
| C | 15 | 214 | 208998 | 1552.94 | 580 | 584 | 134.2 |
| D | 12 | 227 | 1381158 | 9881.12 | 566 | 550 | 139.7 |
| D | 12 | 6 | 283303 | 2023.68 | 566 | 550 | 139.7 |
| D | 1 | 52 | 237434 | 1695.4 | 566 | 550 | 139.7 |
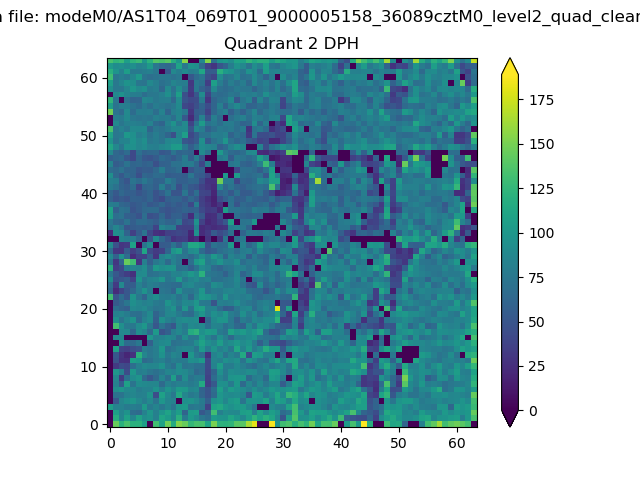
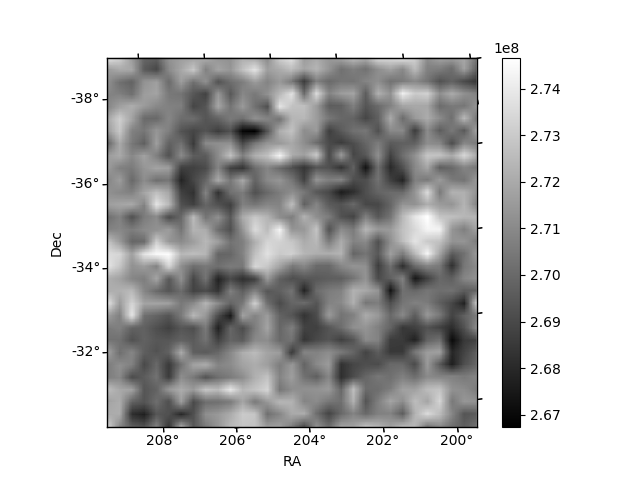
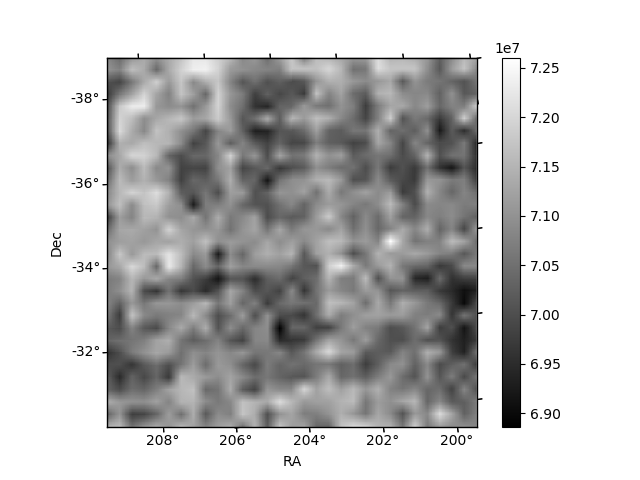
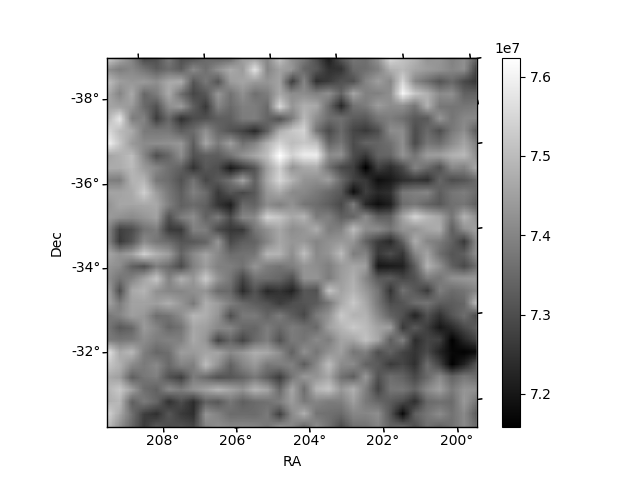
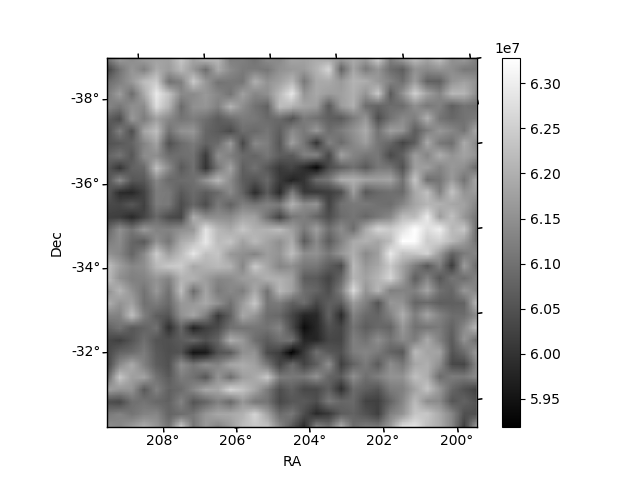
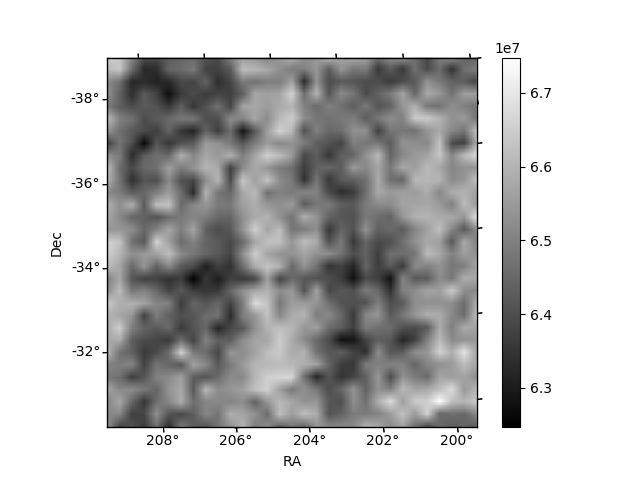
Histogram calculated using DETX and DETY for each event in the final _common_clean file
| Quadrant A | 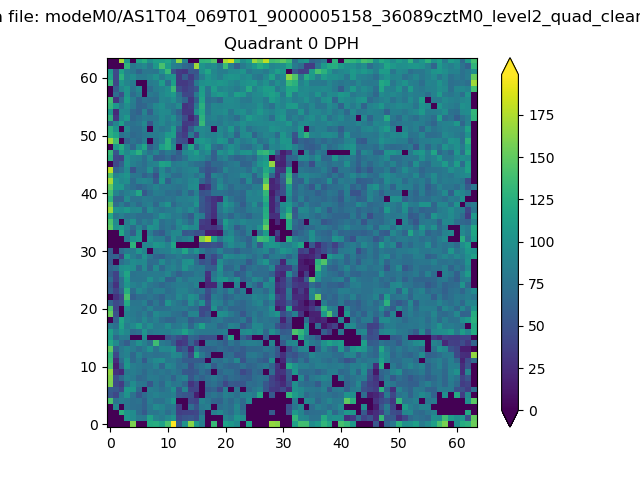 |
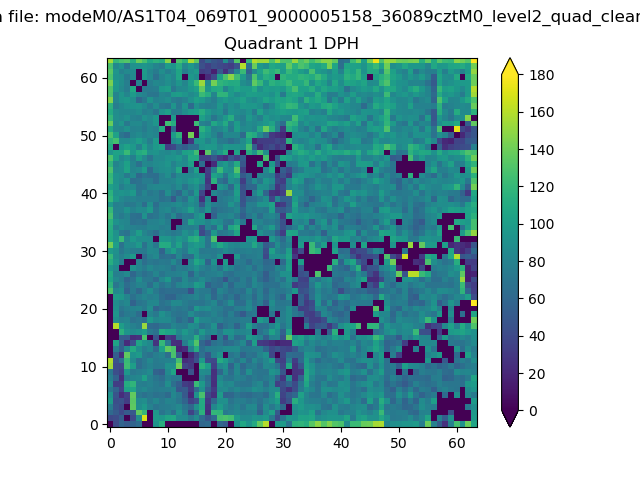 |
Quadrant B |
|---|---|---|---|
| Quadrant D | 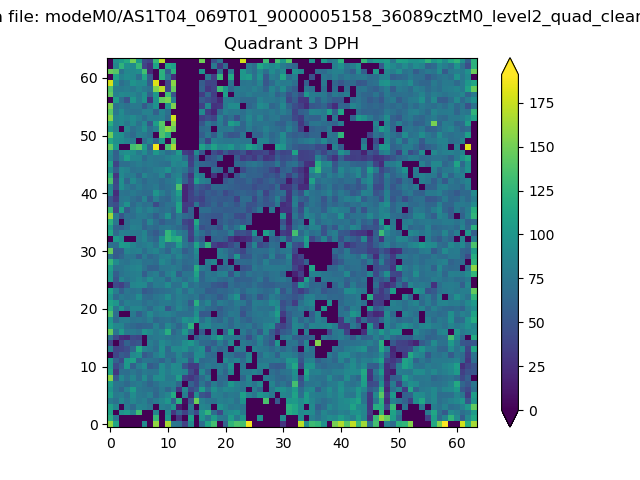 |
 |
Quadrant C |
| Plot type | Count rate plots | Images |
|---|---|---|
| Comparison with Poisson distribution Blue bars denote a histogram of data divided into 1 sec bins. Red curve is a Poisson curve with rate = median count rate of data. |
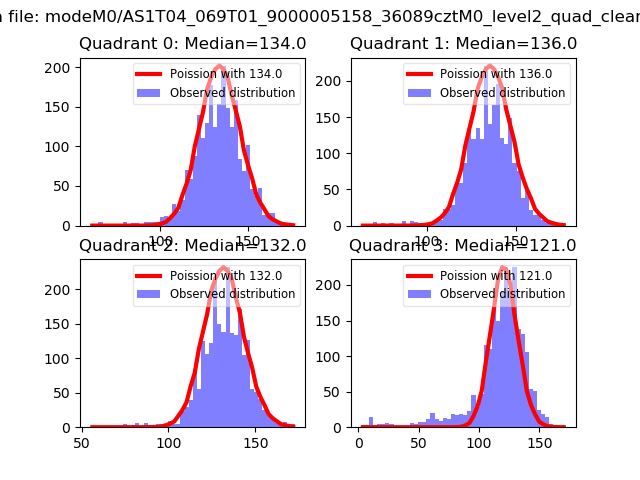 |
 |
| Quadrant-wise count rates Data is divided into 100 sec bins |
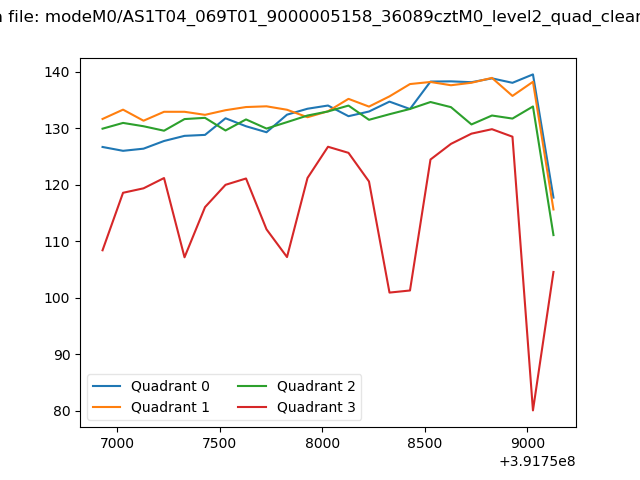 |
|
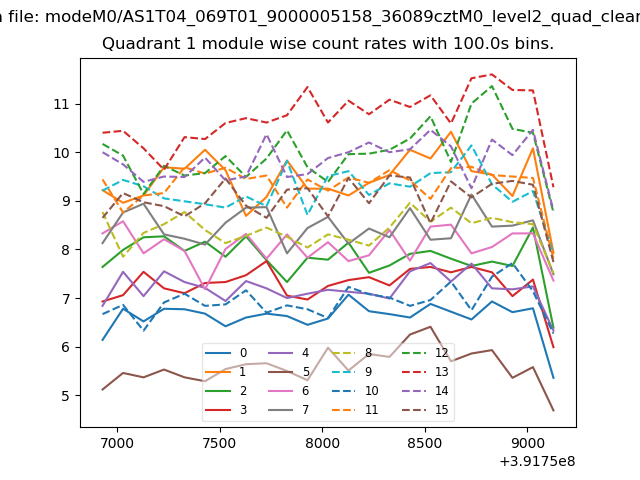
| Module-wise count rates for Quadrant A Data is divided into 100 sec bins |
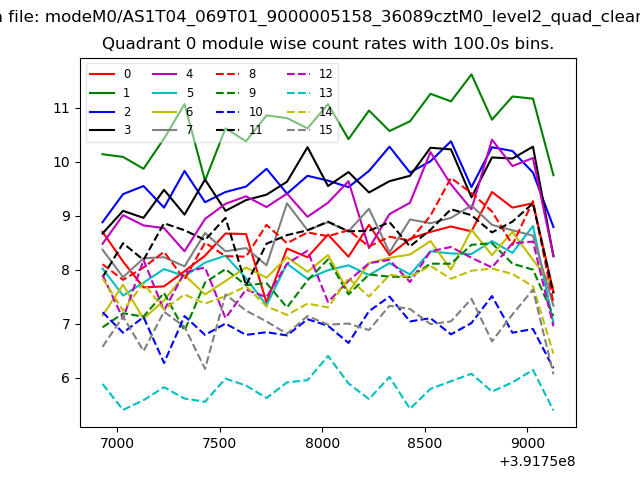 |
 |
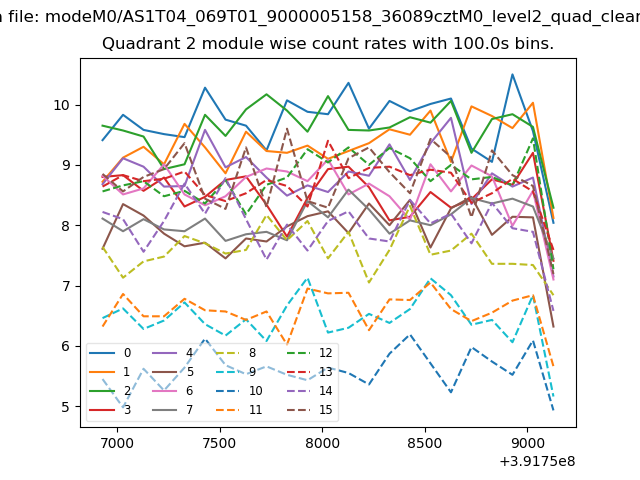
| Module-wise count rates for Quadrant B Data is divided into 100 sec bins |
 |
 |
| Module-wise count rates for Quadrant C Data is divided into 100 sec bins |
 |
 |
| Module-wise count rates for Quadrant D Data is divided into 100 sec bins |
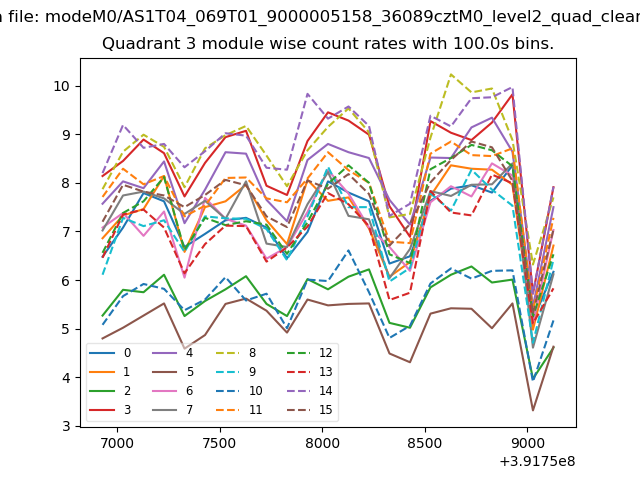 |
 |
| Parameter | Plot |
|---|---|
| CZT HV Monitor | 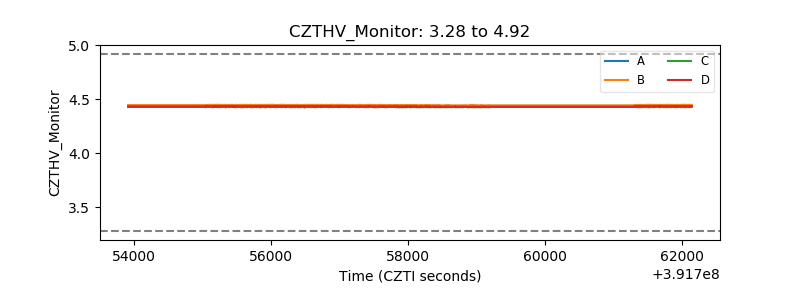 |
| D_VDD | 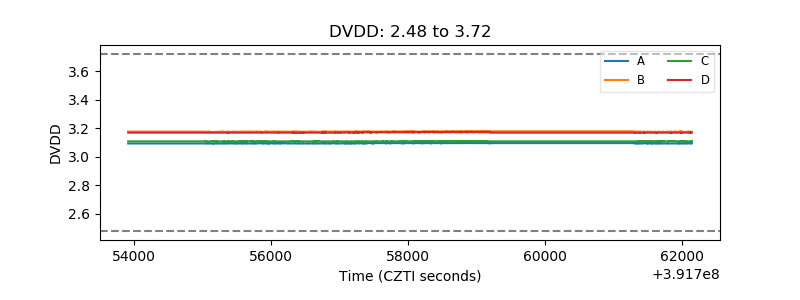 |
| Temperature 1 | 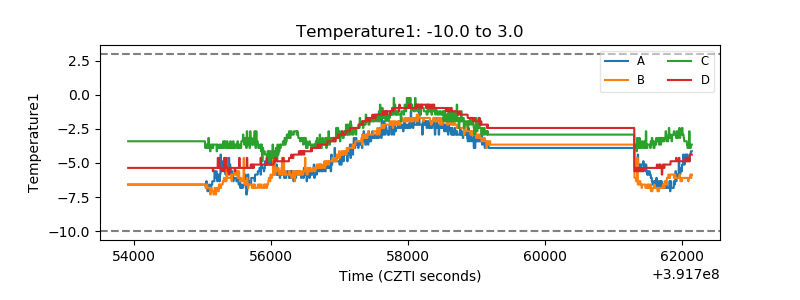 |
| Veto HV Monitor | 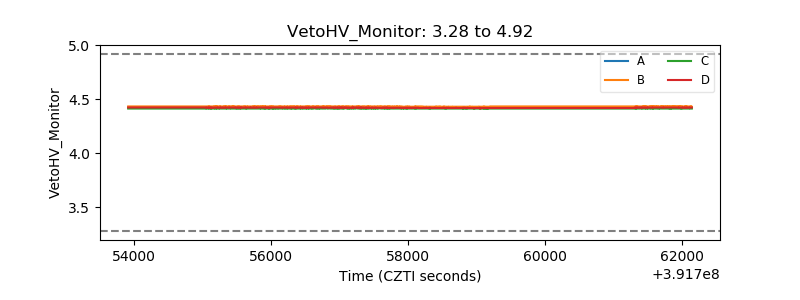 |
| Veto LLD | 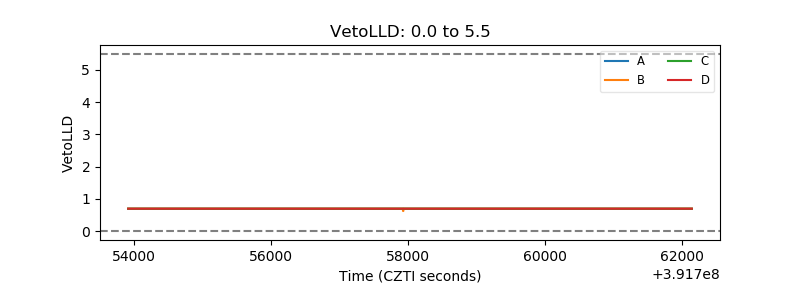 |
| Alpha Counter | 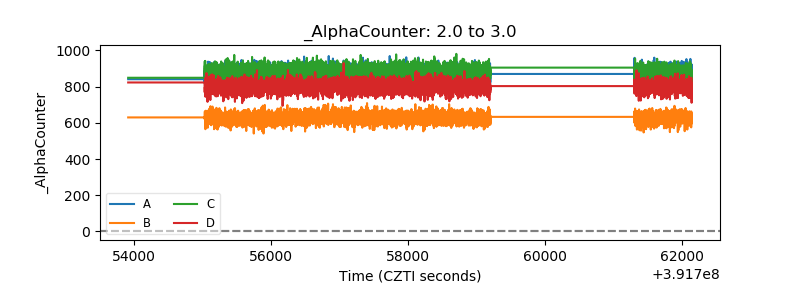 |
| _CPM_Rate | 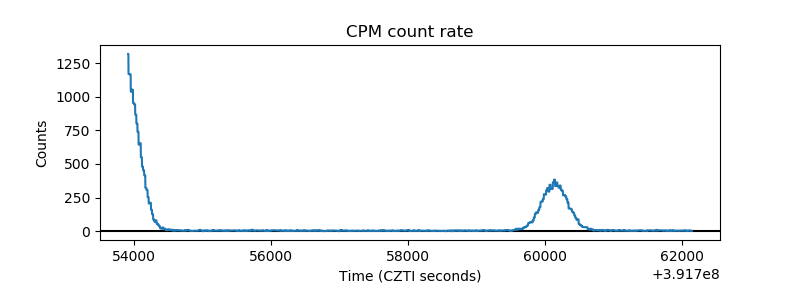 |
| CZT Counter | 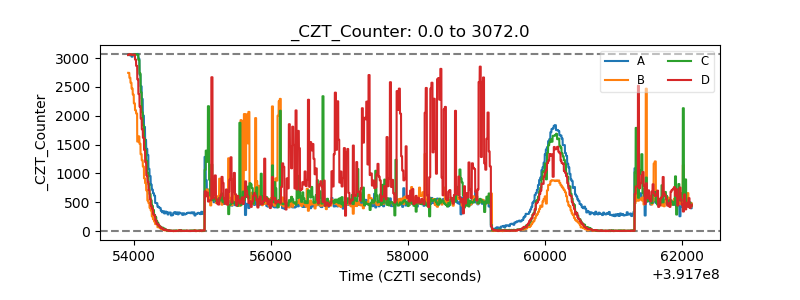 |
| +2.5 Volts monitor | 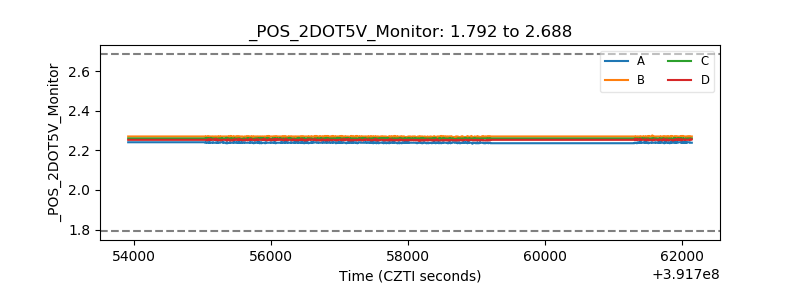 |
| +5 Volts monitor | 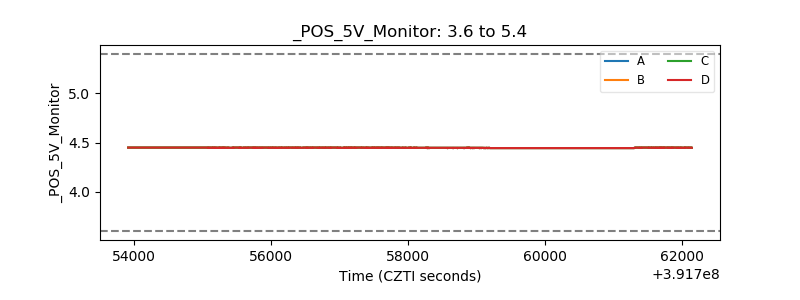 |
| _ROLL_ROT | 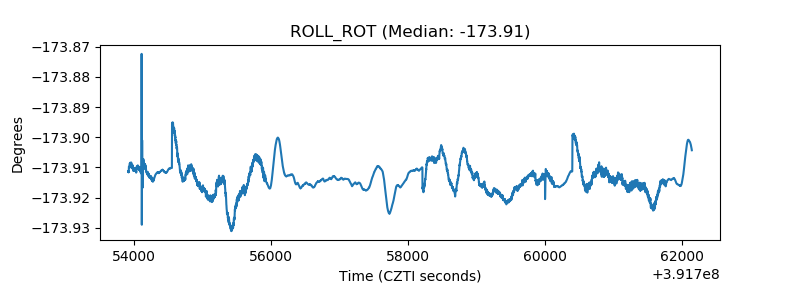 |
| _Roll_DEC | 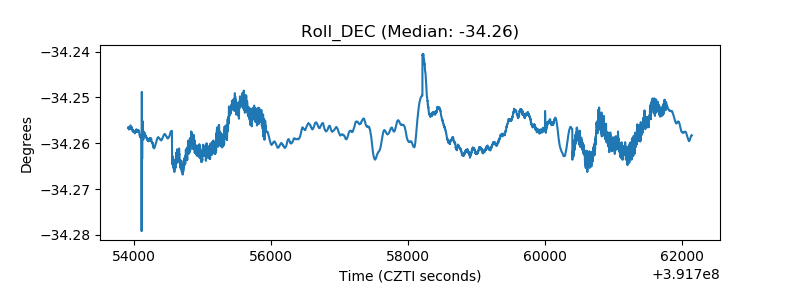 |
| _Roll_RA | 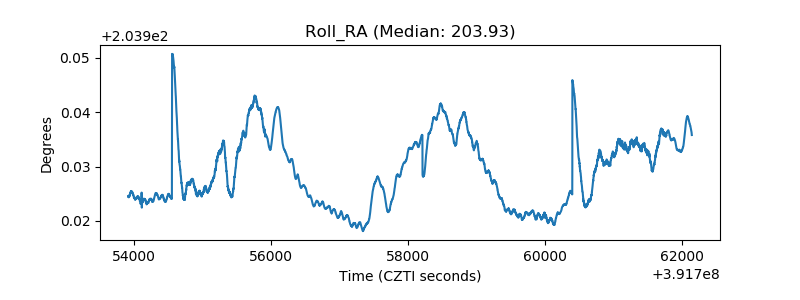 |
| Veto Counter | 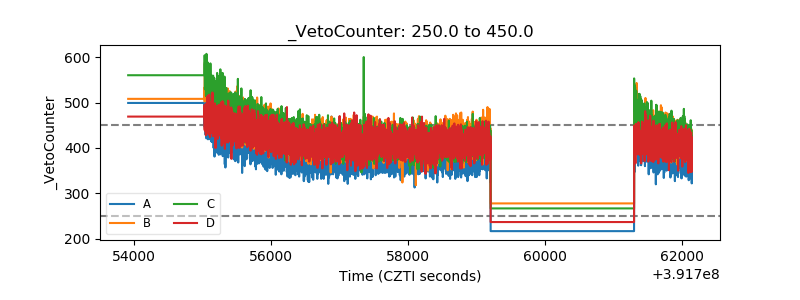 |